HAL Id: hal-02007111
https://hal.archives-ouvertes.fr/hal-02007111
Submitted on 21 Oct 2019
HAL is a multi-disciplinary open access
archive for the deposit and dissemination of sci-entific research documents, whether they are pub-lished or not. The documents may come from teaching and research institutions in France or abroad, or from public or private research centers.
L’archive ouverte pluridisciplinaire HAL, est destinée au dépôt et à la diffusion de documents scientifiques de niveau recherche, publiés ou non, émanant des établissements d’enseignement et de recherche français ou étrangers, des laboratoires publics ou privés.
To cite this version:
Wei Hu, Zhen-Yu Yin, Gianvito Scaringi, Christophe Dano, Pierre-Yves Hicher. Relating fragmenta-tion, plastic work and critical state in crushable rock clasts. Engineering Geology, Elsevier, 2018, 246, pp.326-336. �10.1016/j.enggeo.2018.10.012�. �hal-02007111�
Relating fragmentation, plastic work and critical state in crushable
rock clasts
Wei HU 1*, Zhen-Yu YIN 2, Gianvito SCARINGI 1, Christophe DANO 3, and Pierre-Yves
HICHER 2
1 State Key Laboratory of Geohazard Prevention and Geoenvironment Protection, Chengdu University of
Technology, Chengdu, 610059, China.
2 Research Institute in Civil and Mechanical Engineering, Ecole Centrale de Nantes, Nantes, UMR CNRS
6183, France
3Laboratoire 3SR Domaine Universitaire, Grenoble Cedex 9, BP5338041, France * Corresponding to Dr. Wei Hu, [email protected]
ABSTRACT
Grain breakage during compression and shearing is one important mechanism responsible for irrecoverable changes of the mechanical properties of granular materials. Here we present results of triaxial tests on limestone fragments under some monotonic and cyclic stress paths and we investigate the relationships between the progression of grain breakage, the plastic work and the evolution of the critical state line. Using the plastic work concept, we propose a method for determining grain shape and grain breakage indices, and we show how grain breakage influences the critical stress state, and hence the mechanical behavio ur. The validity of the relationships is then verified on different granular assemblies (granite fragments and quartz sands), although further tests remain necessary to validate them under more generic stress paths.
1. INTRODUCTION
Clasts fragmentation (also termed grain breakage) can occur during compression and shearing of granular materials, especially under high confining stresses and dynamic loadings (Coop et al., 2004; Kaproth et al., 2010; Coop and Altuhafi, 2011; Kimura et al., 2014, 2018; Mehta and Patel, 2018). Important breakage can also occur under low confining stress, particularly if the grains are fragile and present irregular shape (e.g., Nakata et al., 1999). Grain breakage is a fundamental issue for the stability of earth dams, embankments and railway ballasts, and for the bearing capacity of piles (e.g., Daouadji et al., 2011; Okonta, 2015; Winter et al., 2017). Quantitative information about the shearing history can be retrieved from glacial sediments (Altuhafi and Baudet, 2011) and landslide granular deposits (Zhang and McSaveney, 2017), and can be crucial for understanding the likelihood of the latter to exhibit further instability (Hu et al. 2017, 2018a, 2018b, 2018c; Fan et al., 2018). Extensive fragmentation has been also related to frictional weakening in rock avalanches, although the issue is still debated (Davies et al., 1999; Fan et al., 2017; Scaringi et al., 2017, 2018; Ren et al., 2018) and further, dedicated experimental investigations are required.
The amount of fragmentation can be quantified through the changes of grain size distribution (GSD). Different ways to measure its evolution have been suggested (e.g., Marsal, 1967; Hardin, 1985; Einav, 2007). The effect of particle crushing on various physical and mechanical properties has been investigated (e.g., McDowell et al., 1996; Bandini and Coop, 2011; Zhang et al., 2018), and introduced into constitutive and numerical modelling (e.g., Ma et al., 2017; Zhou, 2017). However, understanding how the breakage amount can be measured and how this measure can be related to mechanical properties explicitly is still challenging. The three following issues need to be investigated: (1) what are suitable measures for the amount of grain breakage; (2) how to determine these measures based on stress-strain histories; and (3) how to relate these measures to mechanical properties of the granular assembly. Once these three points are solved, the quantity measuring the amount of grain breakage can be introduced as a variable to control the influence of particle crushing on the mechanical properties of a granular material undergoing a generic
stress-strain path.
For the first issue, a breakage measure varying in the range 0-1 with the GSD changing seems convenient. Among the proposed measures, the modified relative breakage index Br* of
Einav (2007), and the relative uniformity Bu, based on the fractality of the GSD (e.g., Coop et al.,
2004) and on the coefficient of uniformity Cu, seem good choices. Various methods to quantify
the GSD change under different loading conditions were developed and validated through tests under monotonic loading: i.e. the crushing surface approach (Kikumoto et al., 2010), and the energy approach (Einav, 2007). So far, these two approaches have not been fully examined under different loading conditions, including under cyclic loading. Therefore, in this paper we propose a unified approach to quantify the change of GSD (in terms of Bu and Br*) for different loading
conditions.
Changes of the GSD can be correlated to the evolution of mechanical characteristics. Several properties (stress-dilatancy, peak shear strength, plastic modulus, etc.) depend on the distance of the current stress state (p’, e) from the corresponding critical state (p’, ec) of the granular material.
Hence, understanding how fragmentation-induced changes of GSD affect the location of the critical state line (CSL) becomes crucial for relating particle crushing to the mechanical behaviour. CSL-GSD relationships have been demonstrated by experiments on crushable sands (Bandini and Coop, 2011) and by discrete element simulations on crushable granular materials (Bolton et al., 2008).
In the following sections, we first analyse the measures of particle crushing amount. We carry out laboratory tests on crushable limestone grain assemblies under various stress-strain paths, with both monotonic and cyclic loadings to propose a unified determination method for the measure of particle crushing. Secondly, we use the test results to propose a relation between these measures and the CSL location. Finally, we apply the relations obtained on limestone fragments to other materials to validate the method.
2. MEASURES OF GRAIN BREAKAGE
diameter for a percentage of passing equal to 15% in weight, and subscript “i” and “f” represent the initial and final values, e.g. before and after testing (Lee and Farhoomand, 1967; Fig. 1a); (2)
R/100, that is the increase in % passing the sieve having the largest increase, measured from the
GSDs before and after testing (Marsal, 1967; Fig. 1b); (3) the relative breakage Br=Bt/Bp, where
Bp is the area between the line d = 0.074 mm and the portion of the initial GSD with d > 0.074
mm, and Bt is the area between the initial GSD and the GSD after loading with d > 0.074 mm
(Hardin, 1985; Fig. 1c); (4) the particle breakage factor B10=1- D10f/D10i (Lade et al., 1996; Fig.
1d); (5) the change of the coefficient of uniformity Cu=D60/D10, related to the amount of grain
breakage (Biarez and Hicher, 1997; Fig. 1e); (6) the particle breakage factor Bf=R/100, where R
is the percentage of particles smaller, after testing, than the smallest particle size in the initial GSD (Nakata et al., 1999; Fig. 1f); (7) the modified relative breakage index Br*=Bt/Bp, obtained
by replacing the line d = 0.074 mm by the ultimate grading in the definition of Hardin’s Bp and
Bt (Einav, 2007; Fig. 1g); (8) the grading state index IG=Bt/Bp, with the initial grading curve
determined by lower limit of the biggest particle size (Kikumoto et al., 2010; Fig. 1h). As the grading proceeds toward a fractal distribution, only Einav’s measure Br* evolves from 0 to 1
following the evolution of the GSD, therefore it is selected in this study to describe the breakage amount.
Another measure can be defined, that can be named “relative uniformity” Bu and employs
the coefficient of uniformity Cu=D60/D10 in the following way:
u ui u uf ui C C B C C (1)
where Cui is the initial coefficient of uniformity, and Cuf is the ultimate coefficient of uniformity
proper of the final, fractal grading. Hence, Bu also evolves from 0 to 1. Note that Bu includes also
the change of D10 which is a factor influencing the mechanical properties as shown by Lade et al.
(1996). Since the definition of Bu is based on Cu, which is a common coefficient in engineering
practice and can be easily measured, the use of Bu is convenient to describe the grain breakage
amount, provided that it can be related to mechanical variables influencing grain breakage. Therefore, in addition to B*, B is also examined in this study in connection with the amount of
grain breakage.
2.1. A UNIFIED APPROACH
As grain breakage is produced by mechanical loading, the breakage amount can be related to the input energy. Based on this idea, Lade et al. (1996) proposed a hyperbolic relation between the particle breakage factor B10 and the total energy input calculated by stresses and total strains.
Einav (2007) proposed to link the breakage energy, using stresses and total strains, to the relative breakage Br* for compression tests. Different from the energy methods, Simonini (1996) and
Kikumoto et al. (2010) defined a crushing surface to determine the breakage amount based on the distance from the stress state to this crushing surface. However, the accumulation of grain breakage during cyclic loading cannot be described by these different approaches.
Another measure in relationship with the amount of crushing is the plastic work of Daouadji et al. (2001). To avoid the non-uniqueness of the summation of the plastic work along a loading path where stresses or strains are reversed, we adopted the following different definition of the plastic work:
p p
w
d (2)where and dp are stress and incremental plastic strain tensors, respectively, and the use of Macaulay’s brackets implies that F
F F
2. In this way, under cyclic loading, theplastic work can be cumulated (Hu et al., 2013). Thus, linking the plastic work to the measure of breakage amount makes it possible to take the additional grain breakage after the first loading into account.
3. MATERIALS AND METHODS
In order to establish the relation between the measures of breakage (Bu and Br*) and the
plastic work, we performed drained triaxial tests under both monotonic and cyclic conditions. For each test, the GSD was measured after testing and the plastic work was calculated along the loading path.
shape of the grains is sub-angular according to the D2488-10 ASTM standard. The material has a unit weight γ = 17.1 kN/m3 and a specific gravity Gs = 2.70. The samples were prepared with an
initial coefficient of uniformity Cu = 1.8, mean grain size D50 = 6 mm, minimum grain size dm =
1 mm, and maximum grain size dM = 10 mm. The initial void ratio e0 ranges from 1.05 to 1.1,
with minimum and maximum void ratios of 0.83-1.43. All samples have 70 mm diameter and 105 mm height. All samples were saturated before testing. The rate of axial displacement for all triaxial tests was 0.03 mm/min. The correction of the cross section and the correction of membrane penetration are considered by applying the French Standard NF P 94-074 and the method of Head (1992).
The relations between breakage measures, plastic work and CSL location obtained on the limestone grains are also applied to granite fragments, Cambria sand (e.g., Yamamuro and Lade, 1996) and Sydney sand (Russell and Khalili, 2004), as will be shown in Section 5.3.
The granite fragments consist of sub-angular grains of quartz with feldspars, with sizes between 0.3 mm and 2 mm. The material has an initial uniformity coefficient Cu = 2.0, a median
grain size D50 = 0.85 mm and a specific gravity Gs = 2.65. Minimum and maximum void ratios
are 0.83 and 1.23. The initial eref0 = 1.28 and c = 0.088 were obtained adopting the correlation
by Biarez and Hicher (1997). The relative uniformity, modified relative breakage index, CSL location and applied plastic work were obtained from drained triaxial tests carried out by Kim (1995) with confining stress of 1, 5, 10, 30 and 60 MPa.
The Cambria sand is composed of sub-rounded grains of quartz (with small quantity of gypsum) with sizes between 0.83 mm and 2 mm, a median grain size D50 = 1.43 mm and an
initial uniformity coefficient Cu = 1.3. Minimum and maximum void ratios are 0.503 and 0.792.
The specific gravity is Gs = 2.69. The initial eref0 = 0.73 and c = 0.088 were measured from
drained and undrained triaxial tests under low confining pressures (100, 200, 500 kPa) with no change of grading (Yamamuro and Lade, 1996), thus Biarez and Hicher’s correlation is not needed. The relative uniformity, modified relative breakage index, CSL location and applied plastic work were obtained using drained and undrained triaxial tests under high confining
pressures up to 52 MPa (Lade and Bopp, 2005; Bopp and Lade, 2005; Yamamuro and Lade, 1996).
The Sydney sand is mostly made of quartz. It was sampled from sand dunes at Kurnell, Sydney. It has a median grain size D50 = 0.31 mm, initial uniformity coefficient Cu = 1.83,
specific gravity Gs = 2.65. Minimum and maximum void ratios are 0.60 and 0.92. The initial eref0
= 0.97 and c = 0.07 were obtained from drained and undrained triaxial tests under low confining
pressures (50, 150 and 200 kPa) with no change of grading (Russell and Khalili, 2004). The relative uniformity, modified relative breakage index, CSL location and applied plastic work were obtained using drained and undrained triaxial tests under high confining pressures up to 7.8 MPa (Russell and Khalili, 2004).
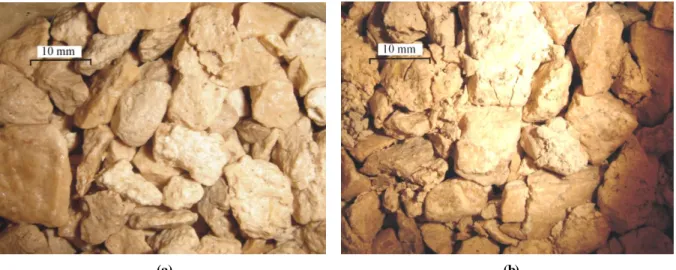
Photographs of the limestone material before testing and after a drained triaxial test under constant mean effective stress p’ = 400 kPa are shown in Fig. 2. By comparing Fig. 2a and Fig.
2b, one can see that some grains were crushed into smaller pieces, and some grains were damaged with visible cracks, while some others appear still intact. The breakage amount can be estimated by the GSD measured after testing. Figure 3a presents the results of two drained triaxial tests with confining stresses p’0 = 50 kPa and 100 kPa. The elastic properties can be measured on the stress-strain curves. We assume a non-linear elasticity and we adopt the formulation proposed by Richart et al. (1970):
2 0.5 0 2.97 1 at at e p G G p e p (3)
2 0.5 0 2.97 1 at at e p K K p e p (4)where pat = 101.325 kPa is the atmosphere pressure.
The shear modulus was measured on the stress-strain curves up to a deviatoric strain of 0.1% in Fig. 3a. We found G0 = 80. The bulk modulus was measured from the isotropic compression
tests (Fig. 3b). We found K0 = 105, which corresponds to a Poisson’s ratio of 0.2. Taking into
consideration the decrease of the shear modulus with the strain level found for various sands (e.g., Clayton, 2010), we can assume that the elastic modulus at very small strains is
approximately five times bigger than the elastic modulus at 0.1%. Therefore, G0 = 400 and K0 =
525 corresponding to the very small strain level were used to estimate the elastic strain component.
According to McDowell et al. (1996), the GSD for both initial and tested samples can be approximately expressed as follows
3( ) / M
F D D d (5)
where F(D) is the percentage of passing corresponding to the grain size D. In agreement with Einav (2007), a fractal GSD was assumed with = 2.6 according to Coop et al. (2004). Therefore, the relative breakage index Br* for each test can be obtained as proposed by Einav
(2007). For the measure of Bu, the current Cu and the ultimate Cuf are needed besides Cui. Cu can
be obtained from the grading curve at the end of each test. Cuf corresponding to fractal GSD can
be determined using Eq. (5) with = 2.6 as follows: for F(D) = 60% and 10%, 60% =
(D60/dM)3- and 10% = (D10/dM)3-2.6, then Cuf = D60/D10 = 61/(3-) = 88.18 is obtained. Therefore,
based on Eq. (1), the value of Bu can be obtained once Cu is measured after the test.
The corrections of the volumetric change due to the membrane penetration is important for accuracy of analysis. We used the method proposed by Baldi and Nova (1984) to correct the test results. Baldi and Nova (1984) investigated the membrane penetration in triaxial tests and found that depended strongly on DVm 50,
' 3
, and the diameter of the specimen (Ds) as well as the
membrane characteristics. The following equation was used to account for the membrane penetration effect: 1 ' 3 50 3 50 0 2 m s m m D D V V D E t (6)
where Emis the Young’s modulus of the membrane material and tm is the thickness of the
4. RESULTS
4.1. TESTS UNDER MONOTONIC LOADING
4.1.1. Tests at different confining stresses
Drained triaxial tests under various constant confining stresses (constant-’3 tests) varying
from 22 kPa to 800 kPa were carried out (Fig. 4). One can notice that, for elevated confining stresses, the material appears very ductile and the stress ratio q/p’ continues to increase even at large strains (Fig 4a). This is due to a large amount of particle breakage developing during loading, as shown in Fig. 4c. Figure 4b presents the volume changes during the drained triaxial tests. They show a dilative behaviour under low confining stresses of 22 kPa and 50 kPa, and a contractive behaviour under higher confining stresses of 100 kPa, 400 kPa and 800 kPa. For samples under high confining stresses, the large contraction is also a consequence of a significant grain breakage. The GSDs after testing were measured, as shown in Fig. 4c. Significant crushing occurs even under low confining stresses. The relative uniformity Bu and the modified relative
breakage index Br* were then obtained for each test, and the values summarised in this figure.
The results show that a higher confining stress induces a higher amount of grain breakage, thus raising the values of Bu and Br*.
4.1.2. Tests with different loading paths
A drained triaxial test under constant mean effective stress (constant-p’ test) p’ = 400 kPa up
to a = 25 % was carried out, as shown in Fig. 5. The results are compared to the constant-’3
test results at the same consolidation stress. During the constant-p’ test, the lateral stress is
reduced in order to keep p’ constant, which also results in a smaller amplitude of the deviatoric
stress. As a consequence, less grain breakage occurred compared to the constant-’3 test (Fig.
5c). This leads to a stiffer stress-strain relationship and a smaller volume change for the constant-p’ test. The evolution of the stress-strain relationship with the grading change is similar to the one obtained for the previous constant-’3 tests. Note that the variability of the grading
measurements for a given stress history is mainly due to the amount of fine particles (e.g. < 2 mm). In Fig. 5c, the difference in the gradation curves between the constant p’ and the constant
’3 tests is statistically significant, especially for particles bigger than 2 mm. The values of Bu
and Br* for the constant-p’ test are smaller than those for the constant-’3 test. 4.1.3. Tests with different consolidation histories
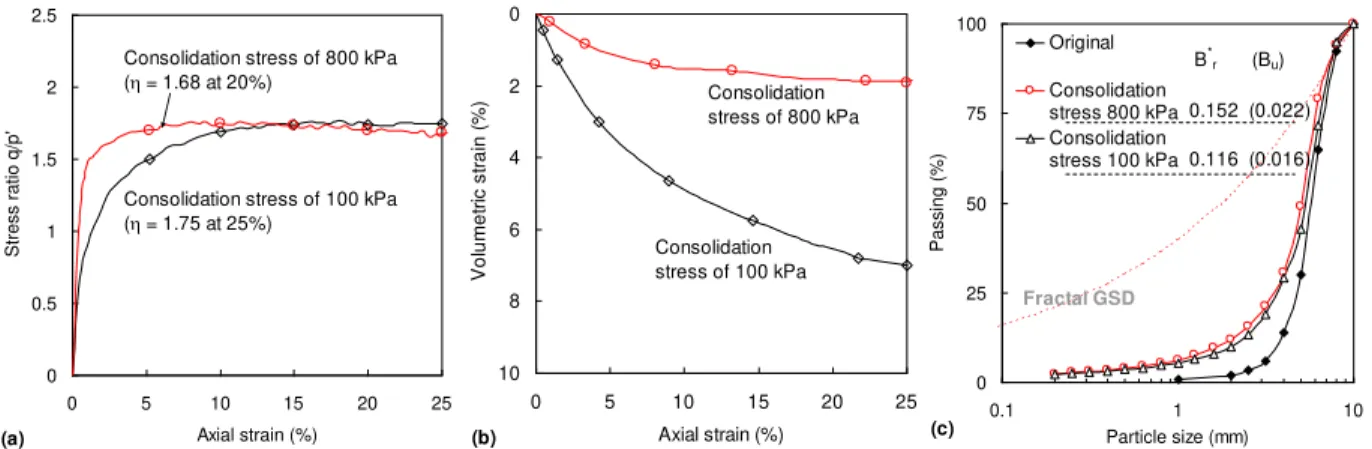
A conventional drained triaxial test at ’3 = 100 kPa up to a = 25 % on a sample
isotropically consolidated up to 800 kPa and unloaded to 100 kPa was carried out, and compared to the constant-’3 test with ’3 = 100 kPa without an over-consolidation history (Fig. 6).
Although the whole difference of grading between the two tests is small (Fig. 6c), the difference of distribution for particles larger than 2 mm was adequately measured. The results show the influence of stress history on the grain breakage: the test with the over-consolidation process results in slightly more grain breakage than the test without the over-consolidation history (Bu
and Br* for the former are higher than for the latter). This is essentially due to the isotropic
loading phase up to 800 kPa where plastic strains developed (see Fig. 3b). The shearing phase did not bring any significant additional grain breakage and, therefore, the stress-strain relationship and the volume change for these two tests are in agreement with what is usually observed by comparing normally and over-consolidated material behaviours: a stiffer and less contractive behaviour for the over-consolidated sample.
4.2. CYCLIC LOADING TESTS
In order to seek a unified approach for determining the breakage amount under different loading conditions, three types of drained cyclic triaxial tests on samples isotropically consolidated at 400 kPa were carried out:
Series 1: two tests with constant confining stress, CYC-CCS1 in which qm ax and qm inincrease
from one cycle to another, CYC-CCS2 with constant qm ax and qm in, in order to investigate the
influence of the axial loading amplitude on grain breakage;
Series 2: three tests under constant p’ with different number of cycles Ncycle = 0, 5, 20 (CYC-CP0, CYC-CP5 and CYC-CP20) to investigate the influence of the number of cycles on grain breakage;
Series 3: a test with constant deviatoric stress with varying p’ (CYC-CDS) to investigate the influence of the stress ratio on grain breakage.
4.2.1. Tests at constant confining stress
Figure 7 shows stress-strain patterns and GSDs for two tests at constant confining stress (Series 1). The test CYC-CCS1 was strain-controlled with axial strains up to 1%, -1%, 2%, -2%, 3%, -3%, 4%, and ending by -4%. qmax reached 370, 570, 770 and 890 kPa, and qm in reaches to
-250, -310, -310, -310 kPa. The test CYC-CCS2 was stress-controlled with the axial stress varying between qm ax = 865 kPa and qm in = -310 kPa for 4 cycles. The stress-strain curves in Fig.
7a and the evolution of the volumetric strain in Fig. 7b can be used to calculate the plastic work during the tests. The amount of grain breakage in Test CYC-CCS1 is lower than the one in Test CYC-CCS2 (Fig. 7c), because the values of qm ax during the first three cycles for Test CYC-CCS1
are smaller than those applied in Test CYC-CCS2 (Fig. 7a).
4.2.2. Tests with constant mean effective stress
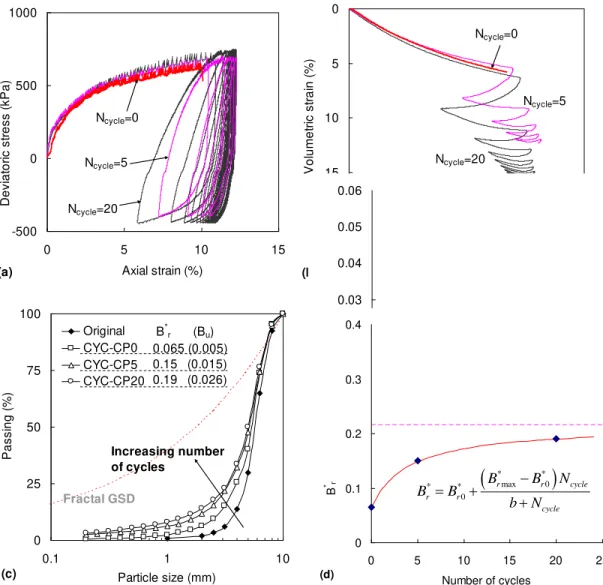
Figure 8 shows the GSDs for tests at constant p’ with different number of cycles (Series 2).
For the test CYC-CP0, the sample was only monotonically sheared up to q = 730 kPa with a =
10 % and q/p’ = 1.83. The other two tests CYC-CP5 and CYC-CP20 were carried out with qm ax = 730 kPa and qm in = -420 kPa (q/p’ between 1.83 to -1.05) up to 5 and 20 cycles, respectively. The
stress-strain curves in Fig. 8a and the evolution of the volumetric strains in Fig. 8b can be used to calculate the plastic work. The amount of grain breakage observed after testing increases with the applied number of cycles (Fig. 8c). Figure 8d shows the evolution of Bu and Br* with the number
of cycles Ncycle, which demonstrates that grain breakage occurs at fast pace at the beginning of
the loading, and then slows down. Based on this figure, the evolution of these two variables can be expressed by
* *
max 0 max 0 * * 0 0 B u u cycle ; r r cycle u u r r cycle cycle B B N B B N B B B a N b N (7) with B*r0 = 0.065, B*rmax = 0.215, a = 4; and Bu0 = 0.0054, Bumax = 0.037, b = 11 obtained by
4.2.3. Tests with constant deviatoric stress
The GSD for the test at constant deviatoric stress CYC-CDS (Series 3) is shown in Fig. 9. In this test, the sample was sheared up to q = 180 kPa with a = 0.1 % and p’ = 460 kPa after an
isotropic compression up to 400 kPa; then it was stress-controlled by changing the axial stress and the confining stress simultaneously, keeping constant the value of q and varying p’ from 460
kPa to 140 kPa (q/p’ varies from 0.39 to 1.29, less than q/p’=1.46 of the constant-’3 test at ’3=400 kPa) with three cycles. Such low values of q and p’m ax were applied to ensure that little
grain breakage would be caused by the applied stresses during the first loading. Therefore, the test can be used to investigate the influence of the stress ratio (changing between 0.39 and 1.29) on grain breakage. Note that the deviatoric stress varies from 190 to 170 kPa with an average of 180 kPa due to the lack of very accurate test control; this average value is considered for the interpretation. The stress-strain curve in Fig. 9a and the volume change in Fig. 9b show that only small strains developed during the test. The increase of the volumetric strain during the stages of decreasing p’ is mainly due to elastic unloading. The amount of grain breakage observed after testing was very small (Fig. 9c), which demonstrates that the cyclic change of stress ratios with moderate amplitudes had little influence on grain breakage.
5. INTERPRETATION OF THE RESULTS AND DISCUSSION
5.1. RELATION BETWEEN GRAIN BREAKAGE MEASURES AND PLASTIC WORK
An energy input is needed for grains to break (McDowell et al., 1996). We decided to adopt the plastic work as a measure of this energy and to link it to the breakage measures Bu and Br*
representing the evolution of GSD. Under axisymmetric loading condition, the plastic work wp
defined in Eq. (2) can be expressed as follows
d p d p
p v d
w
p q (8)where dvp and ddp are the volumetric and deviatoric plastic strain increments. The plastic strain
increment can be calculated by subtracting the elastic strain increment to the total strain increment (dp = d-de) with d
plastic work due to shear induced dilation (dvp<0) does not influence grain breakage.
The plastic work was calculated through Eqs. (3), (4), and (8) from the stress-strain patterns. Then, Bu and Br* were plotted against the plastic work wp (Fig. 10). They can be expressed
univocally, regardless of the loading pattern as:
* ; p p u r p p w w B B a w b w (9)
with the fitting parameters a = 6000 and b = 1000. Eq. (9) implies that the two breakage indices increase asymptotically to the value of 1 when the plastic work increases. There is no further breakage once the ultimate grading is reached, which agrees with Coop et al. (2004). Therefore, the plastic work appears to be a suitable variable to determine Bu and Br*, and thus the evolution
of the GSD, independently of the (monotonic or cyclic) stress path.
5.2. INFLUENCE OF GRAIN BREAKAGE ON THE EVOLUTION OF THE CSL
In the literature, three main methods for describing the effect of particle crushing on the CSL have been developed: (1) movement of CSL with the amount of plastic work (e.g., Daouadji et al., 2001; Biarez and Hicher, 1997); (2) direct description of CSL by one or several segments for different stress levels (e.g., Russell and Khalili, 2004); (3) movement of CSL with the change of the grading state index IG (Kikumoto et al., 2010). The concept of the CSL relies on the
assumption that, at the critical state, the material keeps its volume while undergoing deformation. If the CSL moves with the grading changing because of grain crushing, this concept becomes dynamic and its evolution needs to be specified. To investigate this, we carried out drained triaxial tests under a confining stress of 100 kPa and different stress paths (Fig. 11a), and tests with constant ’3 and constant p’ (Fig. 11c) (see Section 4.1.3). The hypothesis of a movement of
the CSL can be justified on the basis of the e-logp’ patterns of the two tests shown by Fig. 11a
with different amounts of crushing (Fig. 6c). If we assume that the CSL evolves with grain breakage, we need to determine its initial position. For our tested material, as well as for any easily crushable materials, it is difficult to measure the initial location of the CSL because significant breakage can occur even during triaxial tests at low confinement. We assumed that
tests performed at 22 kPa could be used to indicate the location of the initial CSL because crushing, if not absent, was very limited and could not change the GSD significantly (Fig. 4c).
Furthermore, it is still unclear whether the slope of CSL is dependent or not on the GSD (Daouadji et al., 2001; Biarez and Hicher, 1997; Bandini and Coop, 2011). Here for simplicity we hypothesized a constant slope of the CSL, so that the CSL can be expressed by:
ln c ref c at p e e p (10)
where eref is the critical void ratio for a reference stress (for convenience equal to pat), ec stands
for the critical void ratio relative to the current p’, and c represents the slope of CSL in the
e-lnp’ plane (Fig. 11b).
Test results under different confining stresses (Fig. 11b) show the shift of the CSL with the confining stress increasing due to the increasing amount of grain breakage (Fig. 4c). Fig. 11c shows that the final value of the void ratio for the test under constant ’3 = 400 kPa is lower than
that for the test under constant p’ = 400 kPa, due to the higher amount of grain breakage in the former test (Fig. 5c). Note that for tests under high confining stresses the critical state is not easily measurable (Fig. 4). Bandini and Coop (2011) proposed to perform a second (i.e. unloading and shearing) loading phase to measure the critical state line under an appropriate, much lower confining stress, under which only negligible further crushing occurs. In this study, the final states at a strain level of 25% for all tests were chosen (arbitrarily) to represent the “dynamic” critical state. This specific treatment does not affect the trend of the shift in the CSL. If we plot eref for each test against the breakage measures Bu and Br* (Fig. 12b), we can relate the
evolutions of the CSL location and the GSD in the following way:
*
0 ; 0 *
u r
ref ref ref ref ref ref
u r B B e e e e e e c B d B (11)
with eref0 = 1.43, eref = 0.5, and c = 0.006 and d = 0.035 by best fitting. The proposed
formulation for the evolution of the CSL location with the grain breakage measures takes a different form with respect to the one proposed by Kikumoto et al. (2010) with the grading state index IG. Substituting Eq. (9) into Eq. (11), eref can be also related directly to wp as follows:
0 ; 0
1 1
p p
ref ref ref ref ref ref
p p w w e e e e e e ac c w bd d w (12)
In Eq. (12), the values of (1+c) and (1+d) can be taken approximately equal to 1 because the values of c and d are much smaller than 1. Thus, only a·c and b·d control the evolution rate of the CSL location with the plastic work. It was found that the fitting curves based on Bu and Br* in Fig.
12c are very close with a·c = 39 (based on Fig. 10a and Fig. 12a) and b·d = 35 (based on Fig. 10b and Fig. 12b). It should be noted that the CSL location cannot be directly measured in cyclic tests. If we assume that the results obtained from monotonic tests hold for more general loading conditions, than the CSL location for cyclic tests can be estimated from Fig. 12c and Eq. (12). This seems a reasonable assumption, since the grain breakage measures appear to be a univocal function of wp for various loading conditions including monotonic and some cyclic loadings (Eq.
8). Therefore, it appears suitable to use the breakage measures Bu and Br* to determine the CSL
location, which is of practical importance for constitutive modelling. However, it should be pointed out that Eq. (8) should be still validated also through larger numbers of loading cycles under high confinement stresses
5.3. APPLICATION TO OTHER GRANULAR MATERIALS
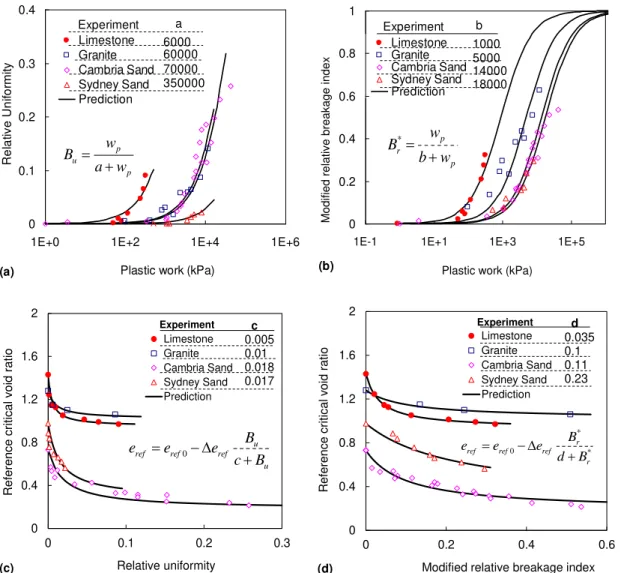
The above relations between breakage measures, plastic work and CSL location obtained on the limestone grains were also used to interpret triaxial tests carried out on granite fragments, Cambria sand and Sydney sand. For the three granular materials, we plotted the relative uniformity and the modified relative breakage index versus the applied plastic work in Fig. 13a and Fig. 13b using Eq. (8). Furthermore, using Eq. (11), the reference critical void ratio was plotted with the relative uniformity and the modified relative breakage index in Fig. 13c and Fig. 13d, respectively. Comparisons between experimental results and calculations show that the proposed relationships based on limestone grains are also suitable for other crushable granular materials.
6. CONCLUSIONS
uniformity Bu as convenient measures for the engineering practice. Through triaxial tests on
limestone fragments under monotonic loading, we demonstrated that the evolutions of these measures appear to be hyperbolic functions of the plastic work wp (which highlights their
asymptotic nature). This relation was found to hold also under some cyclic loading conditions, suggesting that it should remain valid regardless of the loading nature. However, further tests remain necessary to confirm the relation also after larger numbers of loading cycles under high confinement stresses.
We find the location of the critical state line changing as breakage proceeds. In absence of further constraints, we assumed for simplicity that a parallel shift of the critical state line occurs as breakage proceeds. This is a strong assumption that must be verified carefully through further tests. If deemed acceptable, the location of the critical state line can be found by evaluating the plastic work at any stage of loading. We validated our approach by applying the relations we found for the limestone to other granular materials (granite fragments, Cambria sand and Sydney sand), obtaining satisfactory predictions.
ACKNOWLEDGEMENTS
This research was supported by the National Basic Research Program of China: the funds for creative research groups of China (41521002) and the basic research funds (41790433). The work was also supported by the Sichuan funding for young researchers (2016JQ0021).
REFERENCES
Altuhafi, F., Baudet, B. A., 2011. A hypothesis on the relative roles of crushing and abrasion in the mechanical genesis of a glacial sediment. Engineering Geology, 120(1-4):1-9.
Bandini, V., Coop, M. R., 2011. The influence of particle breakage on the location of the critical state line of sands. Soils and Foundations, 51(4):591-600, doi: 10.3208/sandf.51.591.
Biarez, J., Hicher, P.-Y., 1997. Influence de la granulométrie et de son évolution par ruptures de grains sur le comportement mécanique de matériaux granulaires. Revue Française de Génie Civil, 1(4):607-631.
Bolton, M. D., Nakata, Y., Cheng, Y. P., 2008. Micro- and macro-mechanical behaviour of DEM crushable materials. Géotechnique 58(6): 471-480.
Bopp, P. A., Lade, P. V., 2005. Relative density effects on undrained sand behavior at high pressures. Soils and Foundations 45(1): 15-26.
Coop, M. R., Altuhafi, F., 2011. Changes to particle characteristics associated with the compression of sands. Géotechnique, 61(6):459-471, doi: 10.1680/geot.9.P.114.
Coop, M. R., Sorensen, K. K., Bodas Freitas, T., Georgoutsos, G., 2004. Particle breakage during shearing of a carbonate sand. Géotechnique, 54(3):157-163, doi: 10.1680/geot.2004.54.3.157.
Daouadji, A., Hicher, P.-Y., Rahma, A., 2001. An elastoplastic model for granular materials taking into account
grain breakage. European Journal of Mechanics-A/Solids, 20(1):113-137, doi:
10.1016/S0997-7538(00)01130-X.
Davies, T. R., McSaveney, M. J., Hodgson, K. A., 1999. A fragmentation-spreading model for long-runout rock avalanches. Canadian Geotechnical Journal, 36:1096-1110, doi: 10.1139/t99-067.
Einav, I., 2007. Breakage mechanics- Part I: Theory. Journal of the Mechanics and Physics of Solids, 55(6):1274-1297, doi: 10.1016/j.jmps.2006.11.003.
Fan, X., Juang, C. H., Wasowski, J., Huang, R., Xu, Q., Scaringi, G., van Westen, C. J., Havenith, H. B., 2018. What we have learned from the 2008 Wenchuan Earthquake and its aftermath: A decade of research and challenges Engineering Geology (in press), doi: 10.1016/j.enggeo.2018.05.004.
Fan, X., Xu, Q., Scaringi, G., et al., 2017. Failure mechanism and kinematics of the deadly June 24th 2017 Xinmo landslide, Maoxian, Sichuan, China. Landslides 14(6):2129-2146, doi: 10.1007/s10346-017-0907-7. Hardin, B. O., 1985. Crushing of soil particles. Journal of Geotechnical Engineering ASCE, 111(10):1177-1192.
Head, K. H., 1992. Manual of soil laboratory testing, Volume 3: Effective stress tests, second edition. John Wiley & Sons, New York, pp 428.
Hu, W., Hicher, P.-Y., Scaringi, G., et al., 2018a. Seismic precursor to instability induced by internal erosion in loose granular slopes. Géotechnique, doi: 10.1680/jgeot.17.p.079.
Hu, W., Huang, R., McSaveney, M., et al., 2018b. Mineral changes quantify frictional heating during a large low-friction landslide. Geology, doi: 10.1130/G39662.1.
Hu, W., Scaringi, G., Xu, Q., Huang, R., 2018c. Internal erosion controls failure and runout of loose granular deposits: Evidence from flume tests and implications for post-seismic slope healing. Geophysical Research Letters 45(11):5518-5527, doi: 10.1029/2018GL078030.
Hu, W., Scaringi, G., Xu, Q., et al., 2017. Sensitivity of the initiation and runout of flowslides in loose granular deposits to the content of small particles: An insight from flume tests. Engineering Geology 231:34-44, doi: 10.1016/j.enggeo.2017.10.001.
Hu, W., Yin, Z.-Y., Dano, C., Hicher, P.-Y., 2013. Influence of grain breakage on critical state. In: Q. Yang et al. (eds.): Constitutive modelling of Geomaterials, Springer Series in Geomechanics and Geoengineering, pp. 173-177, Springer-Verlag, Berlin, Heidelberg, doi: 10.1007/978-3-642-32814-5_20.
Kaproth, B. M., Cashman, S., Marone, C., 2010. Deformation band formation and strength evolution of unlithified sand: The role of grain breakage. Journal of Geophysical Research: Atmospheres, 115(B12) , doi: 10.1029/2010JB007406.
Kikumoto, M., Muir Wood, D., Russell, A. R., 2010. Particle crushing and deformation behaviour. Soils and Foundations, 50(4):547-563, doi: 10.3208/sandf.50.547.
Kim, M. S., 1995. Etude expérimentale du comportement mécanique des matériaux granulaires sous fortes contraintes. Thèse de Doctorat, École Centrale de Paris.
Kimura, S., Kaneko, H., Ito, T., Minagawa, H., 2014. The Effect of Effective Normal Stress on Particle Breakage, Porosity and Permeability of Sand: Evaluation of Faults around Methane Hydrate Reservoirs. Tectonopysics 630(1), doi: 10.1016/j.tecto.2014.05.031.
shear-zone development of sand under high vertical stress. Engineering Geology, 238:86-98.
Lade, P. V., Bopp, P. A., 2005. Relative density effects on drained sand behaviour at high pressures. Soils and Foundations 45(1): 1-13.
Lade, P. V., Yamamuro, J. A., Bopp, P. A., 1996. Significance of particle crushing in granular materials. Journal of Geotechnical Engineering ASCE 122(4):309-316.
Lee, K. L., Farhoomand, I., 1967. Compressibility and crushing of granular soil in anisotropic triaxial compression. Canadian Geotechnical Journal, 4(1):68-86, doi: 10.1139/t67-012.
Ma, G., Zhou, W., Regueiro, R. A., Wang, Q., Chang, X., 2017. Modeling the fragmentation of rock grains using computed tomography and combined FDEM. Powder Technology, 308:388-397, doi: 10.1016/j.powtec.2016.11.046.
Marsal, R. J., 1967. Large-scale testing of rockfills materials. Journal of the Soil Mechanics and Foundation Engineering ASCE, 93(2):27-44.
McDowell G. R., M. D. Bolton, and D. Robertson (1996). Fractal crushing of granular materials. Journal of the mechanics and physics of solids, 44(12):2079-2102.
Mehta, A. A., Patel, A., 2018. An investigation on the particle breakage of Indian River sands. Engineering Geology, 233:23-37.
Nakata, Y., Hyde, A. F. L., Hyodo, M., Murata, H., 1999. A probabilistic approach to sand particle crushing in the triaxial test. Géotechnique, 49(5):567-583, doi: 10.1680/geot.1999.49.5.567.
Okonta, F. N., 2015. Effect of grading category on the roundness of degraded and abraded railway quartzites. Engineering Geology, 193: 231-242.
Ren, Z., Wang, K., Yang, K., Zhou, Z.-H., Tang, Y.-J., Tian, L., Xu, Z.-M., 2018. The grain size distribution and composition of the Touzhai rock avalanche deposit in Yunnan, China. Engineering Geology, 234:97-111. Richart, F. E., Hall, J. R., Woods, R. D., 1970. Vibration of Soils and Foundations. International Series in Theoretical and Applied Mechanics. Prentice-Hall: Englewood Cliffs, NJ.
Russell, A. R., Khalili, N., 2004. A bounding surface plasticity model for sands exhibiting particle c rushing. Canadian Geotechnical Journal, 41(6):1179-1192, doi: 10.1139/t04-065.
Scaringi, G., Hu, W., Xu, Q., Huang, R., 2017. Shear-Rate-Dependent Behavior of Clayey Bimaterial Interfaces at Landslide Stress Levels. Geophysical Research Letters, doi: 10.1002/2017GL076214
Scaringi, G., Hu, W., Xu, Q., 2018. Discussion on: “Experimental study of residual strength and the index of shear strength characteristics of clay soil” [Eng.Geo.233:183-190]. Engineering Geology, doi: 10.1016/j.enggeo.2018.06.021.
Simonini, P., 1996. Analysis of Behavior of Sand Surrounding Pile Tips. Journal of Geotechnical Engineering ASCE, 122(11):897-905, doi: 10.1061/(ASCE)0733-9410(1996)122:11(897).
Winter, M. J., Hyodo, M., Wu, Y., Yoshimoto, N., Bin Hasan, M., Matsui, K., 2017. Influences of particle characteristic and compaction degree on the shear response of clinker ash. Engineering Geology, 230:32-45. Yamamuro, J. A., Lade, P. V., 1996. Drained sand behavior in axisymmetric tests at high pressures. Journal of Geotechnical Engineering ASCE 122(2): 109-119.
Zhang, M., McSaveney, M. J., 2017. Rock-avalanche deposits store quantitative evidence on internal shear during runout. Geophysical Research Letters, doi: 10.1002/2017GL073774.
Zhang, X., Hu, W., Scaringi, G., Baudet, B. A., Han, W., 2018. Particle shape factors and fractal dimension after large shear strains in carbonate sand. Géotechnique Letters, 8(1):73-79, doi: 10.1680/jgele.17.00150. Zhou, B., 2017. Discrete element modeling of crushable sands considering realistic particle shape effect. Computers and Geotechnics, 91:179-191, doi: 10.1016/j.compgeo.2017.07.016.
FIGURES Before test Before test Before test Before test Before test Before test (Lade et al 1996) (Kikumoto et al 2010)
Fig. 1. Illustration of different measures of grain breakage.
(a) (b)
Fig. 2. Photographs of a tested sample: (a) before testing, and (b) after testing under constant p’ =
0 50 100 150 200 0 0.3 0.6 0.9 1.2 Deviatoric strain (%) D e v ia to ri c s tr e s s ( k P a ) Cal. with G0=80 (a) s '3c = 100 kPa s '3c = 50 kPa 0.8 0.9 1 1.1 1.2 10 100 1000 10000
Mean effective stress (kPa)
V o id r a tio IC tests Cal. With K0=105 (b) p' = 135 kPa p' = 190 kPa
Fig. 3. (a) Deviatoric stress-strain curves of drained triaxial tests under constant confining
stresses at 50 kPa and 100 kPa, and (b) isotropic compression tests in e-log(p’) plane.
0 0.5 1 1.5 2 2.5 0 5 10 15 20 25 Axial strain (%) S tr e s s r a ti o q /p ' 22 kPa 50 kPa 100 kPa 400 kPa 800 kPa (a) h at 25% 1.97 1.89 1.75 1.51 1.38 Tests -15 -10 -5 0 5 10 15 20 0 5 10 15 20 25 Axial strain (%) V o lu m e tr ic s tr a in ( % )
22 kPa 50 kPa 100 kPa 400 kPa 800 kPa (b) 0 25 50 75 100 0.1 1 10 Particle size (mm) P a s s in g ( % ) Original 22 kPa 50 kPa 100 kPa 400 kPa 800 kPa (c) Increasing confining stress B* r (Bu) 0.0 (0.0) 0.021 (0.001) 0.065 (0.004) 0.116 (0.016) 0.28 (0.056) 0.322 (0.072) Tests Fractal GSD
Fig. 4. Drained triaxial tests under constant confining stresses varying from 22 to 800 kPa: (a)
stress ratio versus axial strain, (b) volumetric strain versus axial strain, (c) grain size distributions. 0 0.5 1 1.5 2 2.5 0 5 10 15 20 25 Axial strain (%) S tr e s s r a tio q /p ' (b) h = 1.69 (at 25%) h = 1.51 (at 25%) Constant '3 = 400 kPa Constant p' = 400 kPa (a) 0 5 10 15 20 0 5 10 15 20 25 Axial strain (%) V o lu m e tr ic s tr a in ( % ) (b) Constant s'3 = 400 kPa Constant p' = 400 kPa 0 25 50 75 100 0.1 1 10 Particle size (mm) Passing (%) Original Constant confining stress Constant p' B* r (Bu) 0.28 (0.056) 0.212 (0.04) (c) Fractal GSD
(a) stress ratio versus axial strain, (b) volumetric strain versus axial strain, (c) grain size distributions. 0 0.5 1 1.5 2 2.5 0 5 10 15 20 25 Axial strain (%) Stress ratio q/p' (a)
Consolidation stress of 100 kPa (h = 1.75 at 25%)
Consolidation stress of 800 kPa (h = 1.68 at 20%) 0 2 4 6 8 10 0 5 10 15 20 25 Axial strain (%) V o lu m e tr ic s tr a in ( % ) (b) Consolidation stress of 100 kPa Consolidation stress of 800 kPa 0 25 50 75 100 0.1 1 10 Particle size (mm) Passing (%) Original Consolidation stress 800 kPa Consolidation stress 100 kPa B*r (Bu) 0.152 (0.022) 0.116 (0.016) (c) Fractal GSD
Fig. 6. Comparison of drained triaxial tests with different consolidation histories: (a) stress ratio
versus axial strain, (b) volumetric strain versus axial strain, (c) grain size distributions.
-500 0 500 1000 -5 0 5 10 Axial strain (%) Deviatoric stress (kPa) (a) CYC-CCS1 CYC-CCS2 0 5 10 15 20 -5 0 5 10 Axial strain (%) Volumetric strain (%) (b) CYC-CCS1 CYC-CCS2 0 25 50 75 100 0.1 1 10 Particle size (mm) P a s s in g ( % ) Original CYC-CCS1 CYC-CCS2 (c) B* r (Bu) 0.116 (0.016) 0.19 (0.029) Fractal GSD
Fig. 7. Comparison of drained triaxial tests with different stress strain levels: (a) deviatoric stress
-500 0 500 1000 0 5 10 15 Axial strain (%) D e v ia to ri c s tr e s s ( k P a ) (a) Ncycle=0 Ncycle=5 Ncycle=20 0 5 10 15 20 0 5 10 15 Axial strain (%) V o lu m e tr ic s tr a in ( % ) (b) Ncycle=0 Ncycle=5 Ncycle=20 0 25 50 75 100 0.1 1 10 Particle size (mm) P a s s in g ( % ) Original CYC-CP0 CYC-CP5 CYC-CP20 B* r (Bu) 0.065 (0.005) 0.15 (0.015) 0.19 (0.026) (c) Increasing number of cycles Fractal GSD 0 0.01 0.02 0.03 0.04 0.05 0.06 0 5 10 15 20 25 Number of cycles B u max 0 0 B u u cycle u u cycle B B N B a N 0 0.1 0.2 0.3 0.4 0 5 10 15 20 25 Number of cycles B * r (c)
* *
max 0 * * 0 r r cycle r r cycle B B N B B b N (d)Fig. 8. Comparison of drained triaxial tests with different number of cycles: (a) deviatoric stress
versus axial strain, (b) volumetric strain versus axial strain, (c) grain size distributions, (d) Bu and
B*r versus number of cycles.
0 100 200 300 0 0.2 0.4 0.6 Dev iatoric s tress (kP a) Axial strain (%) (a) p' q CSL ① ② ③ -1 -0.5 0 0.5 1 0 0.2 0.4 0.6 V ol umet ric s train (% ) Axial strain (%) (b) p' increasing p' decreasing ① ② ③ 0 25 50 75 100 0.1 1 10 Particle size (mm) P a s s in g ( % ) Original CYC-CDS (c) B*r (Bu) 0.01 (0.0) Fractal GSD
Fig. 9. Results of drained triaxial tests with constant deviatoric stress: (a) deviatoric stress versus
0 0.05 0.1 0.15 0.2
1E+0 1E+1 1E+2 1E+3 1E+4 1E+5
Plastic work (kPa)
Relative Uniformity Monotonic tests Cyclic tests Prediction (a) p u p w B a w cyclic test: constant q 0 0.2 0.4 0.6 0.8 1
1E+0 1E+1 1E+2 1E+3 1E+4 1E+5
Plastic work (kPa) Monotonic tests Cyclic tests Prediction Relative breaka ge index * p r p w B b w (b) cyclic test: constant q
Fig. 10. (a) Relative uniformity and (b) modified relative breakage index versus plastic work.
0.9 0.95 1 1.05 1.1 100 1000
Mean effective stress (kPa)
V o id r a tio (a) Consolidation stress of 100 kPa (eref = 1.075) Consolidation stress of 800 kPa (eref = 1.05) Critical states 0.4 0.7 1 1.3 10 100 1000 10000
Mean effective stress (kPa)
V o id r a tio 22 kPa 50 kPa 100 kPa 400 kPa 800 kPa (b) Original CSL of Biarez & Hicher
eref 1.245 1.145 1.051 0.99 0.97 Tests Original CSL of Kikumoto et al. 0.5 0.7 0.9 1.1 1.3 1.5 10 100 1000 10000
Mean effective stress (kPa)
V o id r a tio
Constant confining stress Constant p' Original CSL (c) eref 0.99 1.013 Tests
Fig. 11. Shift of the critical state line: (a) tests with various consolidation histories, (b) with
various confining stresses, and (c) with various stress paths.
0.9 1 1.1 1.2 1.3 1.4 1.5 0 0.05 0.1 0.15 0.2 R ef erenc e c rit ic al v oid rat io Relative uniformity Experiment Prediction (a) 0 u
ref ref ref u B e e e c B 0.9 1 1.1 1.2 1.3 1.4 1.5 0 0.1 0.2 0.3 0.4 R ef erenc e c rit ic al v oid rat io
Modified relative breakage index
Experiment Prediction
(b)
*
0 r *
ref ref ref r B e e e d B 0.9 1 1.1 1.2 1.3 1.4 1.5 0 200 400 600 800 R ef erenc e c rit ic al v oid rat io Plastic work Experiment Prediction for cyclic tests
(c)
Based on Bu
Based on B*
r
Fig. 12. (a) eref against relative uniformity, (b) against the modified relative breakage index, and
0 0.1 0.2 0.3 0.4
1E+0 1E+2 1E+4 1E+6
Plastic work (kPa)
R e la tiv e U n ifo rm ity Limestone Granite Cambria Sand Sydney Sand Prediction Experiment p u p w B a w (a) 6000 a 60000 70000 350000 0 0.2 0.4 0.6 0.8 1
1E-1 1E+1 1E+3 1E+5
Plastic work (kPa)
Modified relative breakage
index Limestone Granite Cambria Sand Sydney Sand Prediction Experiment (b) b * p r p w B b w 18000 1000 5000 14000 0 0.4 0.8 1.2 1.6 2 0 0.1 0.2 0.3 Ref eren c e c riti c al v oi d rati o Relative uniformity Limestone Granite Cambria Sand Sydney Sand Prediction Experiment (c) c 0.005 0.01 0.018 0.017 0 u
ref ref ref u B e e e c B 0 0.4 0.8 1.2 1.6 2 0 0.2 0.4 0.6 R ef erenc e c rit ic al v oid rat io
Modified relative breakage index Limestone Granite Cambria Sand Sydney Sand Prediction Experiment (d) d 0.035 0.1 0.11 0.23 * 0 * r ref ref ref
r B e e e d B
Fig. 13. (a) Relative uniformity and (b) modified relative breakage index versus plastic work; (c)