HAL Id: halshs-01228397
https://halshs.archives-ouvertes.fr/halshs-01228397
Submitted on 13 Nov 2015HAL is a multi-disciplinary open access archive for the deposit and dissemination of sci-entific research documents, whether they are pub-lished or not. The documents may come from teaching and research institutions in France or abroad, or from public or private research centers.
L’archive ouverte pluridisciplinaire HAL, est destinée au dépôt et à la diffusion de documents scientifiques de niveau recherche, publiés ou non, émanant des établissements d’enseignement et de recherche français ou étrangers, des laboratoires publics ou privés.
Identifying seasonal patterns of phosphorus storm
dynamics with dynamic time warping
Rémi Dupas, Romain Tavenard, Ophélie Fovet, Nicolas Gilliet, Catherine
Grimaldi, Chantal Gascuel-Odoux
To cite this version:
Rémi Dupas, Romain Tavenard, Ophélie Fovet, Nicolas Gilliet, Catherine Grimaldi, et al.. Identifying seasonal patterns of phosphorus storm dynamics with dynamic time warping. Water Resources Re-search, American Geophysical Union, 2015, 51 (11), pp.8868-8882. �10.1002/2015WR017338�. �halshs-01228397�
1
Identifying seasonal patterns of phosphorus storm dynamics with
Dynamic Time Warping
Authors:
Rémi Dupas 1, 2, 3,*, Romain Tavenard 4, Ophélie Fovet 1, 2, Nicolas Gilliet 1, 2, Catherine Grimaldi 1, 2, Chantal Gascuel-Odoux 1, 2
1 AGROCAMPUS OUEST, UMR 1069 Sol Agro et hydrosystème Spatialisation, F-35000 Rennes, France
2 INRA, UMR1069 Sol Agro et hydrosystème Spatialisation, F-35000 Rennes, France 3 Université européenne de Bretagne, France
4 Univ. Rennes 2 / LETG-COSTEL, Rennes, France
‘* Corresponding author: [email protected]
2
Key points
A storm event clustering method based on Dynamic Time Warping is presented Seasonal patterns of phosphorus storm dynamics are identified in two watersheds Identified patterns are interpreted in terms of phosphorus transport mechanisms
3
Abstract
Phosphorus (P) transfer during storm events represents a significant part of annual P loads in streams and contributes to eutrophication in downstream water bodies. To improve understanding of P storm dynamics, automated or semi-automated methods are needed to extract meaningful information from ever-growing water quality measurement datasets. In this paper, seasonal patterns of P storm dynamics are identified in two contrasting watersheds (arable and grassland) through Dynamic Time Warping (DTW) combined with k-means clustering. DTW was used to align discharge time series of different lengths and with differences in phase, which allowed robust application of a k-means clustering algorithm on rescaled P time series. In the arable watershed, the main storm pattern identified from autumn to winter displayed distinct export dynamics for particulate and dissolved P, which suggests independent transport mechanisms for both P forms. Conversely, the main storm pattern identified in spring displayed synchronized export of particulate and dissolved P. In the grassland watershed, the occurrence of synchronized export of dissolved and particulate P forms was not related to the season, but rather to the amplitude of storm events. Differences between the seasonal distributions of the patterns identified for the two watersheds were interpreted in terms of P sources and transport pathways. The DTW-based clustering algorithm used in this study proved useful for identifying common patterns in water quality time series and for isolating unusual events. It will open new possibilities for interpreting the high-frequency and multi-parameter water quality time series that are currently acquired worldwide.
4
Key words
Time series analysis; Dynamic Time Warping; storm events; phosphorus; watershed
Index terms
1804 1806 1872
5
1. Introduction
Storm-induced changes in stream flow and chemistry have been a major research topic in hydrology for years. The concentration of certain elements, such as phosphorus (P), can increase by one to several orders of magnitude during storms [Heathwaite and Dils, 2000;
Sharpley et al., 2008]. Combined with the increase in discharge (Q), P export rates during
storm events surpass those in baseflow conditions; so, storm events can represent a large part of the annual P load in rural watersheds [Gburek and Sharpley, 1998; Pionke et al., 1999;
Melland et al., 2012; Rodriguez-Blanco et al., 2013a, 2013b]. Another reason that scientists
focus on storm events is that dynamics of P concentrations during storms can be analyzed to infer spatial origins of sources and dominant transport pathways. Early concentration peaks, relative to the discharge peak, indicate mobilization of a P source located within or close to the stream channel (supply limitation), whereas late concentration peaks are often interpreted as resulting from mobilization of a P source on hillslopes (transport limitation) [Haygarth et
al., 2005; Stutter et al., 2008; Dupas et al., 2015a; Perks et al., 2015].
Discharge-concentration hysteresis plots are often used to better visualize time lags between discharge and concentration peaks during storm events [Williams, 1989; Bowes et al., 2005, 2015;
Cerro et al., 2014; Outram et al., 2014; Bieroza and Heathwaite, 2015; Ramos et al., 2015;].
To refine load estimations and infer transport mechanisms, researchers have developed methods to interpret water quality time series during storm events. When few storm events are studied at a time, end-member mixing analysis [Soulsby et al., 2003; Jarvie et al., 2011;
Delsman et al., 2013; Lambert et al., 2014;] and loadograph recession analysis [Mellander et al., 2012, 2013, 2015] are useful techniques to trace the origin of one or several elements of
interest. When a large number of monitored storm events is available and several water quality parameters are measured, statistical descriptor variables and clustering techniques can be valuable for interpreting the data (e.g. perform seasonal and interannual analyses, compare
6
watersheds). The “hysteresis index” [Lawler et al., 2006], the “pollutogram factor” [Rossi et
al., 2005; Stutter et al., 2008] and the semiquantitative index of Butturini et al. [2008] are
three examples of descriptor variables used to quantify the magnitude and direction of hysteresis loops in discharge-concentration plots. Such descriptor variables can be used to cluster storm events, or alternatively, time series can be direct input into clustering algorithms [Aubert et al., 2013a]. Clustering algorithms create groups, called clusters, with minimum within-cluster variance and maximum between-cluster variance. Existing clustering techniques include k-means, hierarchical clustering, interval clustering and self-organizing maps [Astel et al., 2007; Fytilis and Rizzo, 2013; Toth, 2013; Wong and Hu, 2013]. The need for such automated data analysis methods is increasing along with the worldwide development of high-frequency and multi-parameter water quality measurement instruments [Jordan et al., 2007; Rozemeijer et al., 2010; Wade et al., 2012; Bowes et al., 2015]. Clustering techniques have proven useful for identifying seasonal storm patterns and thus for increasing knowledge about seasonal variability in storm export mechanisms (e.g. Aubert et
al. [2013a], Bende-Michl et al. [2013]).
Clustering techniques usually require calculating a distance between pairs of comparable points in several time series. For this reason, direct clustering (without using hysteresis-descriptor variables) of high frequency storm concentration time series is usually irrelevant because their length (number of measurement points) may differ and/or measurement points may have different positions relative to the hydrograph (flow rise and recession); hence, it is difficult to calculate a distance between pairs of comparable points. While existing hysteresis-descriptors have proven useful in describing the variation in concentrations relative to the variation in discharge, they cannot describe complex patterns such as storm events with two concentration peaks [Rodriguez-Blanco et al., 2013a]. The aim of this study was to develop a clustering method that overcomes these two limits and test its ability to compare seasonal
7
variability of P storm dynamics in two headwater watersheds. Both watersheds are ca. 5 km², have similar climate and geology, but differ in land use and P pressure intensity. The clustering method used relies on Dynamic Time Warping (DTW), an algorithm that aligns time series that may have different lengths and/or local distortions [Sakoe and Chiba, 1978]. The intended benefit of using DTW was to enable comparison of storm event time series with differences in the position of the discharge peak and/or differences in durations/slopes of the rising and recession limbs of hydrographs. DTW is used here in combination with the classic Euclidian distance in a k-means clustering framework. This study is part of a wider investigation into P transport mechanisms in agricultural watersheds in western France.
2. Materials and Methods
2.1. Study sites
The two study watersheds, Kervidy-Naizin and Moulinet, are located in agricultural areas in western France (respectively 48°N, 3°W and 48°N, 1°W, Figure 1). The Kervidy-Naizin watershed belongs to the AgrHyS environmental research observatory (http://www6.inra.fr/ore_agrhys_eng), which studies the impact of agriculture and climate change on water quality [Molenat et al., 2008; Salmon-Monviola et al., 2013; Aubert et al., 2013b; Lambert et al., 2014]. The Moulinet watershed belongs to the PFC environmental research observatory (https://www6.inra.fr/ore-pfc), which studies both sediment and solute transfers and their impacts on aquatic ecosystems [Lefrancois et al., 2007; Vongvixay et al., 2010; Gascuel-Odoux et al., 2011]. The two watersheds share most of their physical characteristics, as described elsewhere (e.g. Dupas et al. [2015a] for Kervidy-Naizin and
Lefrancois et al. [2007] for Moulinet). Briefly, both are second Strahler order watersheds, are ca. 5 km² in size, with a temperate oceanic climate. During the study period (2007-2014),
means ± standard deviations of annual rainfall, temperature and discharge in Kervidy-Naizin were 924 ± 178 mm, 10.8 ± 0.6°C and 344 ± 168 mm, respectively, while those in Moulinet
8
were 862 ± 131 mm, 11.2 ± 0.5°C and 352 ± 91 mm, respectively. The stream in Kervidy-Naizin is usually dry from August to October every year, while that in Moulinet flows all year. The topography in both watersheds is gentle, with slopes not exceeding 5%. Bedrock consists of impervious Brioverian schists capped by several meters of unconsolidated weathered material and loamy soils. Soils are naturally well-drained in the upland domain but hydromorphic in riparian wetlands, since the water table reaches the soil surface ca. 6 months per year [Molenat at al., 2008]. Artificial drainage represents <10% of the surface area in both watersheds but is generally ineffective at lowering the water table in the wetland area because the drains are in disrepair.
Kervidy-Naizin and Moulinet differ in land use, landscape structures and P pressure intensity (P surplus and soil P content). Agricultural activities in the Kervidy-Naizin watershed are dominated by intensive indoor animal production (dairy and pig farming). Agricultural land use consists of 85% arable crops (mainly cereals and maize) and 15% grassland. Hedgerow density is low (46 m ha-1), but the stream network is protected by a row of trees and there is no presence of cattle near the stream network [Benhamou et al., 2013]. Estimated soil P surplus was 13.1 kg P ha-1 yr-1 [Dupas et al., 2015b], and soil extractable P (Olsen method, ISO 11263) in 2013 was 62 ± 28 mg P kg-1 (n = 86 samples).
Agriculture in Moulinet is dominated by moderately intensive dairy production. Agricultural land use consists of 40% arable crops (mainly cereals and maize) and 60% grassland. Hedgerow density is relatively high (76 m ha-1), which is characteristic of a “bocage” landscape. However, stream banks are degraded by cattle trampling, and the tree row along the stream network is discontinuous [Lefrancois et al., 2007; Gascuel-Odoux et al., 2011]. Estimated soil P surplus was 8.1 kg P ha-1 yr-1, and soil extractable P in 2008 was 37 ± 7 mg P kg-1 (n = 6). Although the amount of soil data in the Moulinet watershed was lower than that
9
of Kervidy-Naizin, the difference in soil P content between the two areas is confirmed by the national P map of French topsoils [Delmas et al., 2015].
In both watersheds, manure and slurry spreading is prohibited from July to January (or March for maize).
Figure 1. Land use in the Kervidy-Naizin (2013 survey) and Moulinet watersheds (2008
survey).
2.2. Stream monitoring
Stream discharge was determined at the outlet of each watershed with an automatic gauging station, every minute in Kervidy-Naizin and every 10 minutes in Moulinet. To obtain consistent 10-minute frequencies, the one-minute measurements in Kervidy-Naizin were sub-sampled every 10 minutes.
To record both long-term and within-storm dynamics of P concentrations, two monitoring strategies complemented each other from 2007 to 2014: regular sampling every 6 days (manual in Kervidy-Naizin; automatic in Moulinet) at approximately the same time (17:00 local time), and high-frequency sampling during storm events with autosamplers (ISCO 6712 Full-Size Portable Sampler). The autosamplers were placed in the shade at the outlet and
10
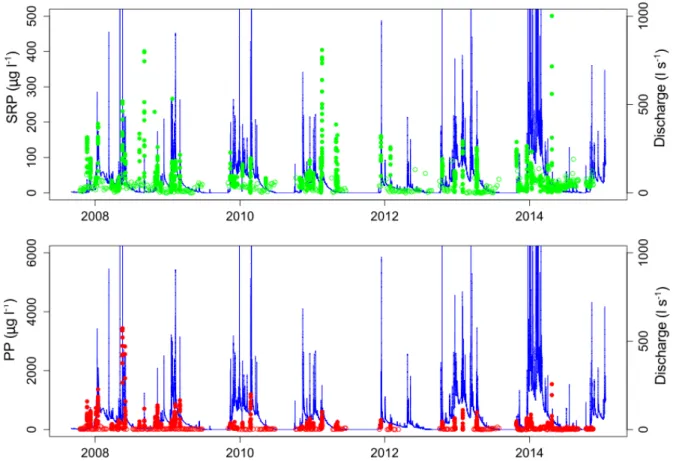
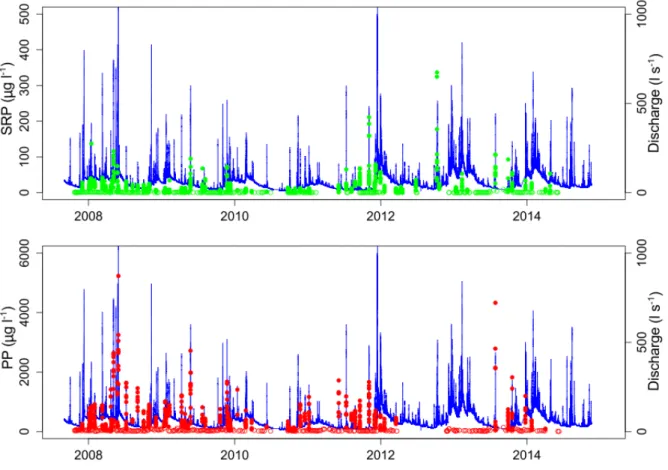
collected samples when the stream level reached a threshold (adjusted depending on baseflow discharge level), at a frequency of one sample every 30 minutes for 12 hours. In total, 54 storm events were remotely monitored in Kervidy-Naizin (Figure 2) and 58 in Moulinet (Figure 3), with 7-24 samples analyzed per storm. Only storm samples with good coverage of the event and with only one discharge peak (based on visual verification of discharge and turbidity data) were sent, within one week, for analysis.
For each sample collected, one aliquot was filtered directly on-site for soluble reactive P (SRP) analysis (0.45 µm cellulose acetate filter) and another aliquot remained unfiltered for total P (TP) analysis. SRP was determined colorimetrically by reaction with ammonium molybdate. Precision of SRP measurement was ±4 µg l-1. TP was determined with the same method, after digestion of the unfiltered samples with potassium peroxydisulfate. Particulate phosphorus (PP) was approximated by subtracting SRP from TP, because analyses have shown that ≥80% of total dissolved P consisted of SRP [Dupas et al., 2015a]. Discharge and phosphorus time series for both watersheds are presented in Figures 2 and 3.
11
Figure 2. Discharge and phosphorus time series in the Kervidy-Naizin watershed (SRP:
Soluble Reactive Phosphorus; PP: Particulate Phosphorus). Time resolution for discharge is 10 minutes. Open circles represent baseflow samples (every 6 days), and filled circles represent storm events monitored at high frequency (every 30 minutes).
12
Figure 3. Discharge and phosphorus time series in the Moulinet watershed (SRP: Soluble
Reactive Phosphorus; PP: Particulate Phosphorus). Time resolution for discharge is 10 minutes. Open circles represent baseflow samples (every 6 days), and filled circles represent storm events monitored at high frequency (every 30 minutes).
2.3. Clustering method
We used a two-step approach to perform storm clustering. The first step consisted of realigning all storm time series so that their discharges temporally matched. Temporal realignment overcame three difficulties that may arise when comparing storm-event data: time series may have i) different starting times due to the discharge threshold at which the autosamplers were triggered, since it was regularly re-adjusted according to baseflow discharge level, ii) different lengths due to analysis of 7-24 samples, and iii) differences in phase that yield different positions of the discharge peak and of concentration data points
13
relative to the hydrograph. To align time series, we used the DTW algorithm. DTW was originally developed for speech recognition [Sakoe and Chiba, 1978] to measure the similarity between pairs of time series. Given two time series, 𝑆 = {𝑆!, … , 𝑆!, … , 𝑆!!} and
𝑅 = {𝑅!, … , 𝑅!, … , 𝑅!!}, DTW finds an optimal alignment that allows for both global phase
correction and local distortions (stretched and compressed sections). To do so, all local (squared) distances between pairs of points in the time series are stored in a matrix, and the DTW algorithm finds the matrix path 𝑊∗, called “matching path”, that minimizes the
cumulative squared distance (Figure 4, left): 𝑊∗(𝑆, 𝑅) =argmin
!∈𝒫 𝑑(𝑆!, 𝑅!)
! !,! ∈!
The set 𝒫 of admissible paths is restricted to those fulfilling the following conditions:
• boundary conditions (the first and last elements of time series 𝑆 and 𝑅 have to be matched together);
• monotonicity condition (temporal ordering in time series must be respected);
• continuity condition (each element in one of the two time series must be matched to at least one element in the other time series).
This matching path can be viewed as the optimal way to perform point-wise alignment of time series (Figure 4, right).
14
Figure 4. Time series alignment with Dynamic Time Warping: optimal path and
corresponding point-wise alignment. Discharge time series are subsampled for the sake of clarity in the figure.
We used the matching path obtained to align each discharge time series 𝑆Q,! to the same
reference discharge time series 𝑅!. The reference discharge time series used in this study
(Figure 4) was chosen in the database as a storm event with full coverage of flow rise and flow recession phases. Alternatively, one could choose a synthetic idealized storm hydrograph. As stated above, the continuity condition imposed on admissible paths results in each element of reference time series 𝑅! being matched with at least one element in 𝑆!,!. Let
us denote 𝑓!!∗ the function that, given a time series 𝑆!,!, a matching path 𝑊!∗ and a time
index 𝑗 ∈ [1, 𝑁!], returns the (non-empty) set of elements in 𝑆!,! that were matched with 𝑅 !Q
in 𝑊!∗:
𝑓!Q∗ 𝑆
Q,!, 𝑗 = {𝑆
!Q,! such that 𝑖, 𝑗 ∈ 𝑊!∗}
In a regularization step, we temporally rescaled all the time series for the concentration parameters (here PP and SRP) for each storm using information from the DTW alignment
Reference discharge time series RQ
Observ ed disc harge time series S Q,n
15
computed from discharge information (Figure 5). Given a time series 𝑆!,! for parameter 𝑝, we generated a regularized time series 𝑆!,! of length 𝑁
! such that:
∀𝑗 ∈ 1, 𝑁! , 𝑆!!,! = average 𝑓!Q∗ 𝑆p,!, 𝑗
Note that in this formula, the matching path 𝑊!∗ was computed from discharge information. In
practice, this means that concentration parameters extracted, for example, at the time of maximum discharge that are matched to the reference discharge maximum (Figure 4, blue dot) are time-aligned for all storms in the dataset.
Figure 5. Regularization step: Resampling of water quality time series based on the Dynamic
Time Warping alignment path (example of soluble reactive phosphorus (SRP) during storm #25).
At this point, each time series was represented as a vector 𝑆! of length 𝑁
!×𝑁!, where 𝑁! is
the number of water quality parameters considered in the study (all parameters were used together in the clustering process).
Reference discharge time series RQ
Original discharge time series SQ,25
Reference discharge time series RQ
Resampled discharge time series ˆSQ,25
16
In the second step, a standard k-means algorithm was used to cluster rescaled time series. The k-means clustering algorithm aims to minimize intra-cluster variance 𝑉:
𝑉 = 𝑆!− 𝜇! ! !!∈!!
!
!!!
where 𝐶! is the 𝑖-th cluster of mean 𝜇!. Note that a Euclidean distance was used for clustering
since time series had already been rescaled during the regularization step; hence, no time-sensitive metric (such as DTW) was needed at this point.
A single program written in the Python language performed the two successive steps: DTW alignment and k-means clustering.
2.4. Data preparation and program runs
In this study, parameters of interest were PP and SRP, because we were interested in the synchronization/desynchronization of their dynamics with each other and with the dynamics of discharge. Turbidity and suspended matter concentration data are available for both watersheds but were not included in the clustering because they are highly correlated with PP [Dupas et al., 2015a], and we wanted to give equal weights to particulate and dissolved P forms. We focused analysis on storm events with a SRP concentration peak > 30 µg l-1 to ensure significant variation in concentration compared to baseflow conditions (18 ± 18 µg l-1 in Kervidy-Naizin and 10 ± 29 µg l-1 in Moulinet, Figures 2 and 3, respectively). As a result, 48 out of 54 events were kept for analysis for Kervidy-Naizin and 20 out of 58 events for Moulinet. This pre-selection step biased the characteristics of storm events analyzed later by discarding many events, especially in the Moulinet watershed, where SRP concentrations were particularly low (Figure 3). This was necessary to ensure that variations in measured SRP concentrations during storm events were not due to measurement errors. Because we wanted to focus analysis on concentration dynamics rather than concentration values
17
themselves, data were normalized between 0 and 1 for each event, with 0 = the antecedent concentration value measured in baseflow conditions and 1 = the highest recorded value during the storm event. Peak concentrations were analyzed separately. Because the data were normalized, it was crucial to eliminate storm events with insignificant variations in concentration, because measurement noise would be treated as actual concentration peaks. Two strategies for initializing the k-means clustering algorithm were tested, one using three randomly selected storm events, the other using three storms with meaningful patterns, identified in a previous study [Dupas et al., 2015a]: i) synchronized SRP and PP peaks, ii) unsynchronized SRP and PP peaks and iii) “double SRP peak” storm events and single PP peak patterns. These patterns were considered to contain meaningful information because they can be interpreted in terms of P transport mechanisms. For both strategies, the number of clusters (k) was set to three. The success of each strategy was assessed based on its ability to identify clusters that resembled the three above-mentioned patterns. Storm events from both watersheds were clustered together to increase the number of time series in the clustering and to be able to compare the seasonal distribution of the same identified patterns in both watersheds. The clusters obtained were analyzed by season because a previous study with data from the Kervidy-Naizin [Dupas et al., 2015a], which involved multivariate analysis of hydroclimatic variables, showed that storm characteristics depended greatly on the season.
3. Results
3.1. Pattern identification
When initializing the clustering algorithm with three randomly selected storm events, the resulting clusters did not clearly identify the three patterns expected (Figure 6). For all three clusters, PP peaks during flow rise or at the time of maximum discharge and decreases quickly; PP decreases more slowly during flow recession in cluster 2 than in clusters 1 and 3.
18
For all three clusters, SRP increases more progressively than PP and remains high during flow recession; SRP remains high longer in cluster 1 than in clusters 2 and 3.
Figure 6. Representation of the clusters obtained with Dynamic Time Warping (DTW) -
k-means algorithm, random initialization. All data were normalized between 0 and 1. Time is represented as a DTW-transformed sequence of 100 points. Thick lines represent the mean of all the time series (Kervidy-Naizin and Moulinet) in a given cluster, and gray zones represent ± 1 standard deviation.
Overall, initializing the clustering algorithm with random storm events revealed the shape of the dominant storm pattern in each cluster, as identified in a previous study (i.e. clockwise hysteresis for PP and counterclockwise hysteresis for SRP, Dupas et al. [2015a]), with slight differences in the speed of PP and SRP rise and decrease between clusters. It did not identify
19
other patterns of interest, such as storms with synchronized variations in PP and SRP or storms with a double peak of SRP.
When initializing the clustering algorithm with time series of three meaningful storm events, the three clusters identified corresponded to three very distinct storm patterns (Figure 7). For this reason, subsequent analyses focused on results from this second strategy.
Figure 7. Representation of the clusters obtained with Dynamic Time Warping (DTW) -
k-means algorithm, initialization with three meaningful time series. All data were normalized between 0 and 1. Time is represented as a DTW-transformed sequence of 100 points. Thick lines represent the mean of all the time series (Kervidy-Naizin and Moulinet) in a given cluster, and gray zones represent ± 1 standard deviation.
20
Cluster 1 displays relatively synchronized variations in SRP, PP and discharge, i.e. no hysteresis pattern in a concentration-discharge plot. In the Kervidy-Naizin watershed, 14/48 storm events belong to cluster 1 (29%), whereas 16/20 events belong to this cluster in the Moulinet watershed (80%).
Cluster 2 displays unsynchronized variations in SRP, PP and discharge. PP has a sharp peak during flow rising (clockwise hysteresis); in contrast, SRP increases gradually and remains high during flow recession (counterclockwise hysteresis). In the Kervidy-Naizin watershed, 27/48 events belong to cluster 2 (56%), whereas 2/20 events belong to this cluster in the Moulinet watershed (10%).
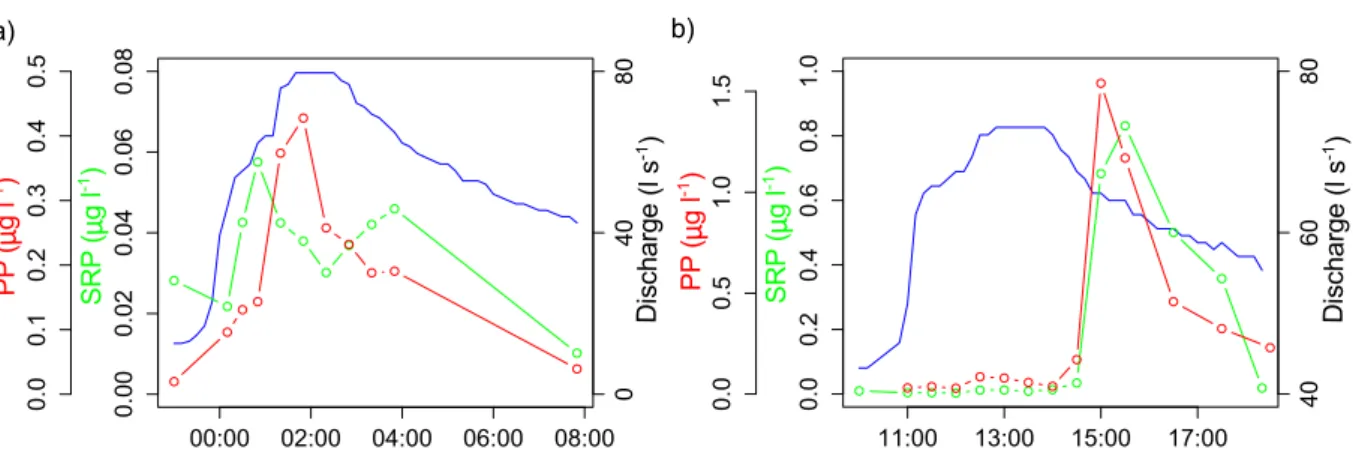
Cluster 3 does not display a clear pattern. It only comprised 7/48 events from the Kervidy-Naizin watershed (15%) and 2/20 events from the Moulinet watershed (10%), with a variety of shapes. Cluster 3 can be seen as a miscellaneous cluster with heterogeneous storm shapes. Among the storm events comprised in cluster 3, two present interesting pattern (Figure 8): one with two SRP peaks and one with both PP and SRP peaks considerably delayed after the discharge peak.
Figure 8. Patterns of two storm events in cluster 3 for the Kervidy-Naizin watershed: a)
double peak of soluble reactive phosphorus (SRP) (30 Oct 2008) and b) synchronized and delayed particulate phosphorus (PP) and SRP peaks (23 Apr 2014).
21
3.2. Comparison of concentration values and seasonal distribution of patterns
In both watersheds, the storm events that were discarded because of SRP concentration peaks < 30 µg l-1 generally had low maximum discharges (Figure 9) and occurred throughout the year (Figure 10). In Kervidy-Naizin, maximum discharges for events in cluster 2 were significantly higher than those of events in other clusters; in Moulinet, maximum discharges for events in cluster 1 were significantly higher than those of events in other clusters (Wilcoxon rank-sum test, p<0.05). No significant difference in SRP or PP concentrations (Figure 9) or loads (result not shown) existed between clusters 1 and 2 in Kervidy-Naizin or Moulinet. SRP concentrations were higher in Kervidy-Naizin than in Moulinet, whereas the opposite occurred for PP (see also Figures 2 and 3)
22
Figure 9. Boxplots of peak discharge and maximum concentration of SRP (soluble reactive
phosphorus) and PP (particulate phosphorus) of each cluster in each study watershed.
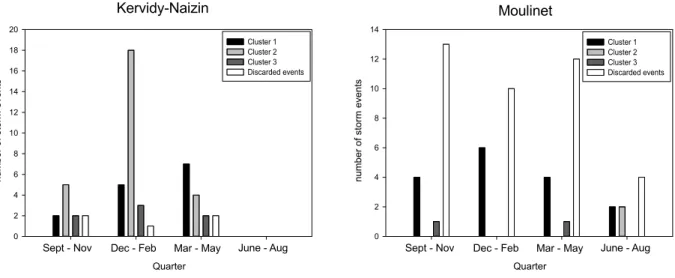
Seasonal analysis revealed that each of the storm patterns identified after expert initialization had a different probability of occurrence depending on the quarter of the year, and that this seasonal distribution differed between Naizin and Moulinet (Figure 10). In Kervidy-Naizin, cluster 2, with unsynchronized export of PP and SRP, dominated from autumn to winter (September - February). Cluster 1, with synchronized export of PP and SRP, dominated in spring (March - May). Cluster 3, the heterogeneous cluster, was present all year,
23
with the double SRP peak event occurring at the beginning of the hydrological year (October) and the events with synchronized and delayed PP and SRP peaks occurring in spring (April). In Moulinet, cluster 1 dominated all year, whereas cluster 2 occurred only in summer (June-August). Cluster 3 was present once in winter (September – November) and once in spring (March – May).
Figure 10. Quarterly distribution of clusters in the Kervidy-Naizin and Moulinet watersheds.
4. Discussion
4.1. Hydrological interpretation
Synchronized export of PP and SRP is often interpreted as resulting from PP and SRP having the same spatial origin and following the same transport pathways. Conversely, distinct export dynamics between PP and SRP indicate independent transport mechanisms. Interpretation of time lags between concentration and discharge peaks can be used to infer transport mechanisms [Bowes et al., 2005, 2015; Haygarth et al., 2005; Stutter et al., 2008; Outram et
al., 2014; Perks et al., 2015].
In cluster 1, PP and SRP peaks are synchronized and are close to the discharge peak; this type of pattern is often interpreted as mobilization of both dissolved and particulate P forms on hillslopes, followed by delivery by overland flow and erosion [Lefrancois et al., 2007; Ramos
24
et al., 2015]. Pattern 1 occurred all year in Moulinet regardless of the season (Figure 10), but
mainly occurred during the largest storm events (Figure 9). However, since 66% of storm events were discarded from the Moulinet dataset because of low SRP concentrations, thus creating a bias toward large events, the actual percentage of storm events causing overland flow and erosion (i.e., in cluster 1) was lower than the 80% calculated. In contrast to Moulinet, pattern 1 occurred mainly in spring in Kervidy-Naizin (Figure 10), but did not necessarily require large storm events to occur (Figure 9). Thus, season seemed to control the occurrence of pattern 1 in Kervidy-Naizin, whereas storm size determined its occurrence in Moulinet. A probable explanation is that Kervidy-Naizin is an arable watershed in which seedbed preparation in spring, combined with high-intensity rainfall during spring storms [Dupas et al., 2015a], can degrade the soil surface structure. As a consequence, erosion and overland flow can occur at this time of the year [Le Bissonnais et al., 2002]. Such surface transfer may also cause incidental losses of animal manure, which is frequently applied in spring. Conversely, the dominance of permanent grassland throughout the year in Moulinet makes this watershed less sensitive to the seasonality of agricultural practices than Kervidy-Naizin. Events in cluster 1 in Moulinet were the largest events, probably because they connect areas of the watershed located far from the stream, which contain more arable land and higher soil P content than riparian areas [Gascuel-Odoux et al., 2007].
In cluster 2, PP and SRP peaks are unsynchronized. The PP peak present on the rising limb of the hydrograph probably resulted from mobilization of a P source located within or close to the stream channel [Bowes et al., 2005; Haygarth et al., 2005; Stutter et al., 2008; Bieroza
and Heathwaite, 2015]. This export mechanism is preponderant for PP both in
Kervidy-Naizin and Moulinet. In the cluster analysis of Moulinet storms, events with early PP concentration peaks are in the minority because we discarded the smallest storms by excluding events with SRP < 30 µg l-1. Previous work on the Moulinet watershed has shown
25
that erosion of the stream channel and remobilization of streambed sediment are major sources of suspended solids, including PP [Lefrancois et al., 2007; Vongvixay et al., 2010], as in many watersheds from the temperate zone [Bowes et al., 2005; Kronvang et al., 2012; Lu et
al., 2015]. Unlike PP, SRP increased gradually and was followed by a plateau that lasted until
the end of flow recession. Such dynamics are often interpreted as resulting from subsurface transfer of a source located in the riparian area (e.g. Morel et al. [2009]; Cerro et al. [2014];
Perks et al., 2015; Ramos et al. [2015]). In the context of watersheds with impervious
bedrock, water table rise in riparian wetlands is the most probable mechanism causing SRP transfer via subsurface flow paths [Dupas et al., 2015a]. In Kervidy-Naizin, SRP dynamics during storm events are similar to those of dissolved organic carbon, which supports the idea that SRP is transferred from riparian wetlands via subsurface flowpaths [Aubert et al., 2013b;
Lambert et al., 2014; Dupas et al., 2015a]. Extensive monitoring of soil and soil-solution SRP
concentrations in Kervidy-Naizin has shown that some riparian areas were highly enriched in P and that groundwater level dynamics controlled its solubilization and transfer [Dupas et al., 2015c]. This transfer mechanism of SRP dominated all year in Kervidy-Naizin, except for storm events in spring when it was overshadowed by incidental losses of recently applied animal manure. In Moulinet, the events that caused SRP to exceed 30 µg l-1 were only those causing overland flow and erosion, probably because soil P content in riparian areas was too low for groundwater fluctuation to cause subsurface transfer of SRP.
In cluster 3, the double SRP peak events (Figure 8) may have at least two interpretations. First, because this event occurred in Kervidy-Naizin at the start of the hydrological season, the first rainfall events of the hydrological year may have formed ponds in the dry stream channel. These ponds may have solubilized P from organic matter that accumulated in the stream channel during autumn leaf fall. Connection of these ponds by a storm event that fully rewetted the stream network may have caused the first peak. The mechanism causing the
26
second peak was probably groundwater fluctuation in riparian areas, as in storm events belonging to cluster 2. Alternatively, resuspension of streambed sediments during flow rise could have caused immobilization of SRP by sorption on particles [Lazzarotto et al., 2005], thus creating a hollow in the middle of the SRP peak. The event with synchronized and delayed export of PP and SRP (Figure 8) was accompanied by an ammonium concentration exceeding 17 mg l-1 (data not shown), while it usually remains below 0.01 mg l-1 in Kervidy-Naizin during baseflow. Such high levels of ammonium are the signature of incidental transfer of animal manure to the stream in spring, even during a small storm. Thus, this event may be an extreme example of cluster 1, for which the occurrence of overland flow and erosion coincides with high source risk.
4.2. Implications for management
These findings have implications for management. First, distinct export mechanisms for SRP and PP were demonstrated for most storm events; hence, distinct management strategies should address both P forms. It would be useful to assess the bioavailability of PP to decide whether priority should be given to management strategies that target only SRP or both SRP and PP. During most storm events, PP originates from the stream channel; therefore, measures to reduce bank erosion, such as implanting riparian vegetation, restoring channel shape and restricting cattle access to the stream, should reduce the PP load [Lefrancois et al., 2007;
Vongvixay et al., 2010]. Unlike PP, SRP originates mainly from riparian areas and is
transferred to the stream because of the hydrological connectivity created by groundwater rise in these zones. Comparison between Kervidy-Naizin and Moulinet and in-situ measurement of pore-water SRP concentrations in riparian soils [Dupas et al., 2015c], suggest that the amount of SRP transferred dependents greatly on soil P status in these hydrologically active areas. To keep/restore a low soil P status in riparian areas, which are usually already managed as unfertilized buffer strips, one could: i) mine P from these zones by exporting biomass; ii)
27
prevent further P enrichment of these zones by reducing erosion in upslope arable fields; or iii) increase immobilization, e.g. by using P-sorbing material in the most sensitive areas. Both catchments exhibit evidence of overland flow and erosion in upslope fields during a minority of events, which be accompanied by incidental losses of manure/slurry. Since degradation of soil structure is often the cause of soil erosion [Le Bissonnais et al., 2002], conservation practices should be promoted. Better prediction of major rainfall events during the manure spreading season would reduce the risk of incidental losses to the stream or to riparian areas. Unlike other regions, direct P losses from upslope arable fields appear to be less importance than P remobilization in the riparian zone or in the stream channel itself. One probable reason is that slopes are moderately steep and riparian buffer strips have been installed along the entire stream network. The signal of mobilization in upslope fields is rarely transmitted to the stream; however, this does not mean that efforts to reduce erosion and overland flow are ineffective [Haygarth et al., 2012], because they would contribute to limit the enrichment of riparian zones where remobilization takes place.
4.3. Methodological limits and perspectives
With the recent development of high-frequency and multi-parameter water quality measurement techniques, the amount of data generated often exceeds the capacity of manual analysis [Jordan et al., 2007; Rozemeijer et al., 2010; Wade et al., 2012; Kirchner and Neal, 2013]. Hence, automated or semi-automated techniques are required to extract meaningful information and knowledge from the data. The DTW-based clustering method presented here has proven useful for identifying meaningful patterns in storm water quality time series with several parameters (Q, PP, SRP). The main advantage of DTW-based clustering is that it provides a synthetic view of P storm patterns in the two watersheds, which renders data analysis and interpretation of multiple time series easier than using visual description. After DTW-transformation, the time lags of discharge and concentration peaks can be compared
28
even when hydrographs have different shapes. One improvement compared to previous storm-description approaches [Rossi et al., 2005; Lawler et al., 2006; Butturini et al., 2008;
Stutter et al., 2008] is that DTW can isolate events with an unusual pattern in the same cluster
(here, cluster 3). It did not, however, create a specific cluster for each type of unusual event, even when we increased the number of potential clusters in k-means (results not shown). If identifying exceptional events is an objective of a study, dedicated methods, such as statistical modeling of extreme values [Coles et al., 2001], should be investigated instead of k-means. In the present application, we interpreted seasonal distributions of clusters in terms of P transport mechanisms in two watersheds. The dataset used, i.e. 68 storm time series with two water quality parameters, was relatively modest compared to what would have been obtained with nearly-continuous measurement. Based on analysis of daily data in Kervidy-Naizin,
Aubert et al., [2013a] estimated that an average of 31 storm events with noticeable changes in
stream chemistry occur yearly in the watershed. By extrapolating this value to seven years and two watersheds, over 400 storm events could have been monitored in the Kervidy-Naizin and Moulinet watersheds during the study period. Besides monitoring more events, nearly-continuous monitoring would enable exhaustive sampling of all storm events, which would prevent the risk of sampling bias in the dataset [Outram et al., 2014]. In contrast, the monitoring strategy used in this study creates unavoidable sampling bias: for example, during a succession of storms, autosamplers will often trigger during the first one but miss those that follow. With more data and greater confidence that datasets are unbiased, further analysis with the DTW-based clustering method is possible, in addition to seasonal analysis of storm dynamics:
- Applying the clustering method to non-normalized data to obtain clusters that consider both concentrations values and their dynamics. In the present application, data were normalized because the Euclidean distance used in k-means is sensitive to
29
concentration values, and we wanted to focus analysis on their dynamics relative to the hydrograph. The concentrations values were analyzed separately (Figure 9), which did not reveal significant differences between clusters. Variables used previously to describe storm dynamics [Rossi et al., 2005; Lawler et al., 2006; Butturini et al., 2008;
Stutter et al., 2008] also require separate analysis of concentration values.
- Comparing interannual pattern distributions to investigate effects of interannual climate variability [Aubert et al., 2013a]. Contrary to seasonal analysis, in which storm events can be grouped by quarter regardless of the year, studying each year separately would require monitoring many storm events in each combination of year × quarter. One could also group different years according to climatic characteristics. - Increasing k in k-means to investigate the ability of the clustering method to create a
specific cluster for each type of unusual pattern, because the unusual storm events would be present in larger number.
Because the DTW-based clustering method presented here involves a k-means algorithm, results were highly sensitive to initialization strategy. Initialization with randomly selected storm events resulted in cluster patterns that were not meaningful for inferring the seasonality of P transport mechanisms (Figure 6). In contrast, initialization with previously identified storm events (Figure 7) led to clusters with meaningful patterns. Hence, in this application of a semi-automated method, expertise and a hypothesis-driven approach was necessary to extract useful information and knowledge from data.
5. Conclusion
This paper describes a new method to identify patterns of P storm dynamics in two contrasting watersheds. The method consists of two steps:
30
- Using DTW to temporally realign discharge data onto a reference time series and rescaling P data with the same transformation.
- Applying a k-means clustering algorithm to rescaled P data.
Meaningful patterns were identified when expert initialization was performed. Seasonal distribution of these patterns in two contrasting watersheds was analyzed to investigate the variability in P transport mechanisms. In the arable watershed, most analyzed storm events exhibited unsynchronized export of PP and SRP, suggesting independent origins and/or transport pathways. PP was mobilized through resuspension of streambed sediments and/or erosion of the stream channel. SRP was transferred via subsurface flowpaths. Hillslope erosion and delivery of PP and SRP was only observed for a minority of events, mainly in spring, because of the combination of high source and transport risks during this time of the year. In the grassland watershed, events with subsurface transfer of SRP were less frequent, probably because of lower soil P content than in the arable watershed. Occurrence of hillslope erosion and synchronized delivery and PP and SRP was not related to seasonal risk factors, but rather to the amplitude of storm events. Beyond the study case, the DTW clustering method opens new possibilities for data interpretation in the context of the worldwide development of high-frequency and multi-parameter measurement techniques.
Acknowledgements
Data of “ORE AgrHyS” can be downloaded from http://www6.inra.fr/ore_agrhys/Donnees. Data of “ORE PFC” can be requested from the corresponding author. The DTW-based clustering program has not been released.
This work was funded by the ‘Agence de l’Eau Loire Bretagne’ via the ‘Trans-P project’. Long-term monitoring in the Kervidy-Naizin watershed is supported by ‘ORE AgrHyS’. Long-term monitoring in the Moulinet watershed is supported by ‘ORE PFC’. We would like
31
to thank all those who helped with the field and lab work, particularly Jean-Paul Guillard and Laurence Carteaux.
32
References
Astel, A., S. Tsakouski, P. Barbieri, and V. Simeonov (2007), Comparison of self-organizing maps classification approach with cluster and principal components analysis for large environmental data sets, Water Res., 41(19), 4566-4578.10.1016/j.watres.2007.06.030
Aubert, A. H., R. Tavenard, R. Emonet, A. de Lavenne, S. Malinowski, T. Guyet, R. Quiniou, J. M. Odobez, P. Merot, and C. Gascuel-Odoux (2013a), Clustering flood events from water quality time series using Latent Dirichlet Allocation model, Water Resources Research,
49(12), 8187-8199.10.1002/2013wr014086
Aubert, A. H., et al. (2013b), Solute transport dynamics in small, shallow groundwater-dominated agricultural catchments: insights from a high-frequency, multisolute 10 yr-long monitoring study, Hydrology and Earth System Sciences, 17(4), 1379-1391. 10.5194/hess-17-1379-2013
Bende-Michl, U., K. Verburg, and H. P. Cresswell (2013), High-frequency nutrient monitoring to infer seasonal patterns in catchment source availability, mobilisation and delivery, Environmental monitoring and assessment, 185(11), 9191-9219.10.1007/s10661-013-3246-8
Benhamou, C., J. Salmon-Monviola, P. Durand, C. Grimaldi, and P. Merot (2013), Modeling the interaction between fields and a surrounding hedgerow network and its impact on water and nitrogen flows of a small watershed, Agricultural Water Management, 121, 62-72.10.1016/j.agwat.2013.01.004
Bieroza, M. Z., and A. L. Heathwaite (2015), Seasonal variation in phosphorus concentration-discharge hysteresis inferred from high-frequency in situ monitoring, Journal of Hydrology, 524, 333-347. 10.1016/j.jhydrol.2015.02.036
Bowes, M. J., W. A. House, R. A. Hodgkinson, and D. V. Leach (2005), Phosphorus-discharge hysteresis during storm events along a river catchment: the River Swale, UK, Water
Res., 39(5), 751-762.10.1016/j.watres.2004.11.027
Bowes, M. J., H. P. Jarvie, S. J. Halliday, R. A. Skeffington, A. J. Wade, M. Loewenthal, E. Gozzard, J. R. Newman, and E. J. Palmer-Felgate (2015), Characterising phosphorus and nitrate inputs to a rural river using high-frequency concentration-flow relationships, Science
of the total environment, 511, 608-620.10.1016/j.scitotenv.2014.12.086
Butturini, A., M. Alvarez, S. Bernal, E. Vazquez, and F. Sabater (2008), Diversity and temporal sequences of forms of DOC and NO3-discharge responses in an intermittent stream: Predictable or random succession?, Journal of Geophysical Research-Biogeosciences,
113(G3).10.1029/2008jg000721
Cerro, I., J. M. Sanchez-Perez, E. Ruiz-Romera, and I. Antiguedad (2014), Variability of particulate (SS, POC) and dissolved (DOC, NO3) matter during storm events in the Alegria agricultural watershed, Hydrological Processes, 28(5), 2855-2867.10.1002/hyp.9850
Coles, S., J. Bawa, L. Trenner, and P. Dorazio (2001), An introduction to statistical modeling of extreme values, London: Springer
33
Delmas, M., N. Saby, D. Arrouays, R. Dupas, B. Lemercier, S. Pellerin, and C. Gascuel-Odoux (2015), Explaining and mapping total phosphorus content in French topsoils, Soil Use
and Management, 31(2), 259-269.
Delsman, J. R., G. Essink, K. J. Beven, and P. J. Stuyfzand (2013), Uncertainty estimation of end-member mixing using generalized likelihood uncertainty estimation (GLUE), applied in a lowland catchment, Water Resources Research, 49(8), 4792-4806.10.1002/wrcr.20341
Dupas, R., C. Gascuel-Odoux, N. Gilliet, C. Grimaldi, and G. Gruau (2015a), Distinct export dynamics for dissolved and particulate phosphorus reveal independent transport mechanisms in an arable headwater catchment, Hydrological Processes, 29(14), 3162-3178.10.1002/hyp.10432
Dupas, R., M. Delmas, J. M. Dorioz, J. Garnier, F. Moatar, and C. Gascuel-Odoux (2015b), Assessing the impact of agricultural pressures on N and P loads and eutrophication risk,
Ecological Indicators, 48, 396–407.10.1016/j.ecolind.2014.08.007
Dupas, R., G. Gruau, S. Gu, G. Humbert, A. Jaffrezic, and C. Gascuel-Odoux (2015c), Groundwater control of biogeochemical processes causing phosphorus release from riparian wetlands, Water Research, 84. 10.1016/j.watres.2015.07.048
Fytilis, N., and D. M. Rizzo (2013), Coupling self-organizing maps with a Naive Bayesian classifier : Stream classification studies using multiple assessment data, Water Resources
Research, 49(11), 7747-7762.10.1002/2012wr013422
Gascuel-Odoux, C., C. Grimaldi, N. Gilliet, Y. Fauvel, and J. M. Dorioz (2007), Inter-comparison of suspended sediment and phosphorus fluxes and concentrations on two agricultural headwater catchments 6th International Phosphorus Workshop (IPW6), COST
action 869 “Mitigation options for nutrient reduction in surface water and groundwaters”
Gascuel-Odoux, C., P. Aurousseau, T. Doray, H. Squividant, F. Macary, D. Uny, and C. Grimaldi (2011), Incorporating landscape features to obtain an object-oriented landscape drainage network representing the connectivity of surface flow pathways over rural catchments, Hydrological Processes, 25(23), 3625-3636.10.1002/hyp.8089
Gburek, W. J., and A. N. Sharpley (1998), Hydrologic controls on phosphorus loss from upland agricultural watersheds, Journal of Environmental Quality, 27(2), 267-277
Haygarth, P. M., T. J. C. Page, K. J. Beven, J. Freer, A. Joynes, P. Butler, G. A. Wood, and P. N. Owens (2012), Scaling up the phosphorus signal from soil hillslopes to headwater catchments, Freshwater Biology, 57, 7-25. 10.1111/j.1365-2427.2012.02748.x
Haygarth, P. M., F. L. Wood, A. L. Heathwaite, and P. J. Butler (2005), Phosphorus dynamics observed through increasing scales in a nested headwater-to-river channel study, Science of
the Total Environment, 344(1-3), 83-106.10.1016/j.scitotoenv.2005.02.007
Heathwaite, A. L., and R. M. Dils (2000), Characterising phosphorus loss in surface and subsurface hydrological pathways, Science of the Total Environment, 251, 523-538.10.1016/s0048-9697(00)00393-4
34
Jarvie, H. P., C. Neal, P. J. A. Withers, D. B. Baker, R. P. Richards, and A. N. Sharpley (2011), Quantifying Phosphorus Retention and Release in Rivers and Watersheds Using Extended End-Member Mixing Analysis (E-EMMA), Journal of Environmental Quality,
40(2), 492-504.10.2134/jeq2010.0298
Jordan, P., A. Arnscheidt, H. McGrogan, and S. McCormick (2007), Characterising phosphorus transfers in rural catchments using a continuous bank-side analyser, Hydrology
and Earth System Sciences, 11(1), 372-381
Kirchner, J. W., and C. Neal (2013), Universal fractal scaling in stream chemistry and its implications for solute transport and water quality trend detection, Proceedings of the
National Academy of Sciences of the United States of America, 110(30),
12213-12218.10.1073/pnas.1304328110
Kronvang, B., J. Audet, A. Baattrup-Pedersen, H. S. Jensen, and S. E. Larsen (2012), Phosphorus Load to Surface Water from Bank Erosion in a Danish Lowland River Basin,
Journal of Environmental Quality, 41(2), 304-313.10.2134/jeq2010.0434
Lambert, T., A. C. Pierson-Wickmann, G. Gruau, A. Jaffrezic, P. Petitjean, J. N. Thibault, and L. Jeanneau (2014), DOC sources and DOC transport pathways in a small headwater catchment as revealed by carbon isotope fluctuation during storm events, Biogeosciences,
11(11), 3043-3056.10.5194/bg-11-3043-2014
Lawler, D. M., G. E. Petts, I. D. L. Foster, and S. Harper (2006), Turbidity dynamics during spring storm events in an urban headwater river system: The Upper Tame, West Midlands, UK, Science of the Total Environment, 360(1-3), 109-126.10.1016/j.scitotenv.2005.08.032 Lazzarotto, P., V. Prasuhn, E. Butscher, C. Crespi, H. Flühler, and C. Stamm (2005), Phosphorus export dynamics from two Swiss grassland catchments, Journal of Hydrology,
304(1-4), 139-150.10.1016/j.jhydrol.2004.07.027
Le Bissonnais, Y., S. Cros-Cayot, and C. Gascuel-Odoux (2002), Topographic dependence of aggregate stability, overland flow and sediment transport, Agronomie, 22(5), 489-501.10.1051/agro:2002024
Lefrancois, J., C. Grimaldi, C. Gascuel-Odoux, and N. Gilliet (2007), Suspended sediment and discharge relationships to identify bank degradation as a main sediment source on small agricultural catchments, Hydrological Processes, 21(21), 2923-2933.10.1002/hyp.6509
Lu, S. L., B. Kronvang, J. Audet, D. Trolle, H. E. Andersen, H. Thodsen, and A. van Griensven (2015), Modelling sediment and total phosphorus export from a lowland catchment: comparing sediment routing methods, Hydrological Processes, 29(2), 280-294.10.1002/hyp.10149
Melland, A. R., P. E. Mellander, P. N. C. Murphy, D. P. Wall, S. Mechan, O. Shine, G. Shortle, and P. Jordan (2012), Stream water quality in intensive cereal cropping catchments with regulated nutrient management, Environmental Science & Policy, 24, 58-70.10.1016/j.envsci.2012.06.006
35
Mellander, P.-E., A. R. Melland, P. Jordan, D. P. Wall, P. N. C. Murphy, and G. Shortle (2012), Quantifying nutrient transfer pathways in agricultural catchments using high temporal resolution data, Environmental Science & Policy, 24, 44-57.10.1016/j.envsci.2012.06.004 Mellander, P. E., P. Jordan, M. Shore, A. R. Melland, and G. Shortle (2015), Flow paths and phosphorus transfer pathways in two agricultural streams with contrasting flow controls,
Hydrological Processes.10.1002/hyp.10415
Mellander, P. E., P. Jordan, A. R. Melland, P. N. C. Murphy, D. P. Wall, S. Mechan, R. Meehan, C. Kelly, O. Shine, and G. Shortle (2013), Quantification of Phosphorus Transport from a Karstic Agricultural Watershed to Emerging Spring Water, Environ. Sci. Technol.,
47(12), 6111-6119.10.1021/es304909y
Molenat, J., C. Gascuel-Odoux, L. Ruiz, and G. Gruau (2008), Role of water table dynamics on stream nitrate export and concentration. in agricultural headwater catchment (France),
Journal of Hydrology, 348(3-4), 363-378.10.1016/j.jhydrol.2007.10.005
Morel, B., P. Durand, A. Jaffrezic, G. Gruau, and J. Molenat (2009), Sources of dissolved organic carbon during stormflow in a headwater agricultural catchment, Hydrological
Processes, 23(20), 2888-2901.10.1002/hyp.7379
Outram, F. N., et al. (2014), High-frequency monitoring of nitrogen and phosphorus response in three rural catchments to the end of the 2011-2012 drought in England, Hydrology and
Earth System Sciences, 18(9), 3429-3448.10.5194/hess-18-3429-2014
Perks, M. T., G. J. Owen, C. M. H. Benskin, J. Jonczyk, C. Deasy, S. Burke, S. M. Reaney, and P. M. Haygarth (2015), Dominant mechanisms for the delivery of fine sediment and phosphorus to fluvial networks draining grassland dominated headwater catchments, Science
of the Total Environment, 523, 178-190. 10.1016/j.scitotenv.2015.03.008
Pionke, H. B., W. J. Gburek, R. R. Schnabel, A. N. Sharpley, and G. F. Elwinger (1999), Seasonal flow, nutrient concentrations and loading patterns in stream flow draining an agricultural hill-land watershed, Journal of Hydrology, 220(1-2), 62-73.10.1016/s0022-1694(99)00064-5
Ramos, T. B., et al. (2015), Sediment and nutrient dynamics during storm events in the Enxoe temporary river, southern Portugal, Catena, 127, 177-190.10.1016/j.catena.2015.01.001 Rodriguez-Blanco, M. L., M. M. Taboada-Castro, and M. T. Taboada-Castro (2013a), Phosphorus transport into a stream draining from a mixed land use catchment in Galicia (NW Spain): Significance of runoff events, Journal of Hydrology, 481, 12-21.10.1016/j.jhydrol.2012.11.046
Rodriguez-Blanco, M. L., M. M. Taboada-Castro, J. J. Keizer, and M. T. Taboada-Castro (2013b), Phosphorus Loss from a Mixed Land Use Catchment in Northwest Spain, Journal of
Environmental Quality, 42(4), 1151-1158.10.2134/jeq2012.0318
Rossi, L., V. Krejci, W. Rauch, S. Kreikenbaum, R. Fankhauser, and W. Gujer (2005), Stochastic modeling of total suspended solids (TSS) in urban areas during rain events, Water
36
Rozemeijer, J. C., Y. Van der Velde, F. C. Van Geer, G. H. De Rooij, P. Torfs, and H. P. Broers (2010), Improving Load Estimates for NO3 and P in Surface Waters by Characterizing the Concentration Response to Rainfall Events, Environ. Sci. Technol., 44(16), 6305-6312.10.1021/es101252e
Sakoe, H., and S. Chiba (1978), Dynamic-programming algorithm optimization for spoken word recognition, Ieee Transactions on Acoustics Speech and Signal Processing, 26(1), 43-49.10.1109/tassp.1978.1163055
Salmon-Monviola, J., P. Moreau, C. Benhamou, P. Durand, P. Merot, F. Oehler, and C. Gascuel-Odoux (2013), Effect of climate change and increased atmospheric CO2 on hydrological and nitrogen cycling in an intensive agricultural headwater catchment in western France, Climatic Change, 120(1-2), 433-447.10.1007/s10584-013-0828-y
Sharpley, A. N., P. J. Kleinman, A. L. Heathwaite, W. J. Gburek, G. J. Folmar, and J. P. Schmidt (2008), Phosphorus loss from an agricultural watershed as a function of storm size, J
Environ Qual, 37(2), 362-368.10.2134/jeq2007.0366
Soulsby, C., J. Petry, M. J. Brewer, S. M. Dunn, B. Ott, and I. A. Malcolm (2003), Identifying and assessing uncertainty in hydrological pathways: a novel approach to end member mixing in a Scottish agricultural catchment, Journal of Hydrology, 274(1-4), 109-128.10.1016/s0022-1694(02)00398-0
Stutter, M. I., S. J. Langan, and R. J. Cooper (2008), Spatial contributions of diffuse inputs and within-channel processes to the form of stream water phosphorus over storm events,
Journal of Hydrology, 350(3-4), 203-214.10.1016/j.jhydrol.2007.10.045
Toth, E. (2013), Catchment classification based on characterisation of streamflow and precipitation time series, Hydrology and Earth System Sciences, 17(3), 1149-1159.10.5194/hess-17-1149-2013
Vongvixay, A., C. Grimaldi, C. Gascuel-Odoux, P. Laguionie, M. Faucheux, N. Gilliet, and M. Mayet (2010), Analysis of suspended sediment concentration and discharge relations to identify particle origins in small agricultural watersheds, in Sediment Dynamics for a
Changing Future, edited by K. Banasik, A. J. Horowitz, P. N. Owens, M. Stone and D. E.
Walling, pp. 76-83.
Wade, A. J., et al. (2012), Hydrochemical processes in lowland rivers: insights from in situ, high-resolution monitoring, Hydrology and Earth System Sciences, 16(11), 4323-4342.10.5194/hess-16-4323-2012
Williams, G. P. (1989), Sediment concentration versus water discharge during single hydrologic events in rivers, Journal of Hydrology, 111(1-4), 89-106.10.1016/0022-1694(89)90254-0
Wong, H., and B. Q. Hu (2013), Application of interval clustering approach to water quality evaluation, Journal of Hydrology, 491, 1-12.10.1016/j.jhydrol.2013.03.009