HAL Id: hal-00878963
https://hal.archives-ouvertes.fr/hal-00878963
Submitted on 31 Oct 2013
HAL is a multi-disciplinary open access
archive for the deposit and dissemination of
sci-entific research documents, whether they are
pub-lished or not. The documents may come from
teaching and research institutions in France or
abroad, or from public or private research centers.
L’archive ouverte pluridisciplinaire HAL, est
destinée au dépôt et à la diffusion de documents
scientifiques de niveau recherche, publiés ou non,
émanant des établissements d’enseignement et de
recherche français ou étrangers, des laboratoires
publics ou privés.
High intensity behavior of pyroelectric photorefractive
self-focusing in LiNbO3
Jassem Safioui, Fabrice Devaux, Kien Phan Huy, Mathieu Chauvet
To cite this version:
Jassem Safioui, Fabrice Devaux, Kien Phan Huy, Mathieu Chauvet. High intensity behavior of
pyro-electric photorefractive self-focusing in LiNbO3. Optics Communications, Elsevier, 2013, 294, pp.294
- 298. �10.1016/j.optcom.2012.12.069�. �hal-00878963�
High intensity behaviour of pyroelectric
photorefractive self-focusing in LiNbO
3
Jassem Safioui1, Fabrice Devaux2, Kien Phan Huy2 and Mathieu Chauvet2
1
Service OPERA-Photonique, Université Libre de Bruxelles (U.L.B.), 50 Avenue F. D. Roosevelt, CP 194/5, B-1050 Bruxelles, Belgium
2FEMTO-ST, UMR 6174, Université de Franche-Comté, 16 Route de Gray, 25000 Besançon, France
e-mail: jsafioui@ulb.ac.be
Abstract
The formation of self-confined beams using pyroelectric effect is numerically and experimentally studied in photorefractive LiNbO3. For a given crystal temperature change, the trapped beam width is shown to be less efficient as intensity is increased. Numerical calculations reveal that the induced refractive-index profile varies along propagation for large intensities due to a nonlinear photovoltaic effect. Moreover, it eventually gives beam splitting for intensities greater than a threshold intensity that depends on LiNbO3 composition.
Keywords
80.080: photorefractive and Kerr effects, 80.090: optical solitons
1. Introduction
Lithium niobate is one of the most widely used materials in the photonic industry. It features electro-optic effect, piezoelectricity and strong nonlinear coefficients that are useful for the realization of optical devices such as modulators, acousto-optic components or guided wavelength converter [1-3]. Photorefractive (PR) effect is also a key property of LiNbO3 [4]. It is also usually related to optical damages because intense visible light induces an inhomogeneous refractive-index change that can seriously disturb the propagation, leading to defocussing or beam distortion [4]. However PR effect can also be very useful for holographic applications such as wavelength filters, diffractive-optical elements or real time holography [5-7]. It also led to the observation of dark and bright spatial solitons [8, 9] with promising applications [10]. The latter is especially appealing as it enables optically induced 3-D photonics circuits inside a bulk crystal. To achieve this, a strong external electric field, typically few tens of kV/cm, is applied to overtake the intrinsic defocusing photovoltaic (PV) effect in order to have a focusing nonlinearity [9]. Although countering the diffraction in a bulk material seems very appealing, the need for such a strong external field is inconvenient practically. Recently, it was reported that this drawback could be overcome using the internal pyroelectric field. A self-focused beam, named pyroliton, was successfully obtained [11]. In this paper, we further investigate this pyroelectric self-trapping method. First, we focus on the self-focusing process in the high intensity regime for congruent and stoichiometric LiNbO3 samples. We then compare our results to 3-D numerical computations and discuss the “solitonic” nature of the beam propagation. Then we show that similarly to the external-field case, a beam splitting is observed above a certain threshold. Finally, this splitting behavior is studied both theoretically and experimentally.
2. Intensity pyroelectric self-focusing dependence
In order to investigate the self-focusing process with respect to intensity, we use a continuous wave visible laser source at 532nm whose beam is focused to a typical 12µm Full-Width Half Maximum (FWHM) (Fig. 1a) at the input of either undoped photonic-grade congruent (CLN) or stoichiometric (SLN) LiNbO3 z-cut wafers. The samples dimensions are 8x20x0.5 mm3 along X, Y and Z crystallographic axis, respectively. The power and polarization are tuned thanks to a polarizer and a half-wave plate. The beam propagates perpendicular to the crystal c-axis (Z-axis) over 20 mm in the crystal. Using microscope objectives and lenses, both crystal input and output faces can be imaged on a CCD camera (see Figure 1). The crystal temperature is controlled and stabilized by a Peltier cell.
The average beam intensity at the entrance of the crystal can be tuned from 0.2 MW/m² to 5.5 MW/m². Initially, the beam experiences natural diffraction (Fig. 1b). Because of photorefractive effect, free charges are efficiently photo-generated from deep donor center and, simultaneously, a photovoltaic current appears along c-axis in the illuminated area. These displaced charges then recombine on acceptor centers to form a local space-charge field Esc
whose amplitude can reach the photovoltaic field Eph. Esc induces a refractive-index change by
electro-optic effect that tends to defocus the beam, leading to the so-called optical damage. However, if the LiNbO3 crystal is subject to a temperature increase 1T, a constant internal pyroelectric field 1Epy appears along the c-axis.
0 1 . py r E p T ε ε ∆ = − ∆ (1)
with p=2Ps/2T being the pyroelectric coefficient that characterizes the LiNbO3 spontaneous polarization variation Ps as a function of temperature and 101r is the static dielectric constant of the medium. 1Epy gives a drift current that opposes to the photovoltaic current. As a
consequence, if 1Epy>Eph , the space charge field Esc can change sign and the refractive-index
modulation can now gives a focusing effect in the illuminated region. This phenomenon can lead to efficient beam self-trapping as shown in (Figs. 1c and 1d). We note that in all our experiments, the samples are illuminated only when their temperature is increased and stabilized. The temperature of the samples is homogenous and any pressure is applied to the samples.
(b) (c) (d)
50µm
t=0mn t=0.5mn t=5.5mn
(a) Entrance spot
c
A
50µm
X Z
Fig. 1. (a) Pyroelectric self-focusing dynamic of an extraordinary polarized beam at 2=532 nm in a 20mm long congruent LiNbO3 crystal. Light intensity I=0.8 MW/m2, Input spot FWHM=12µm (a), linear diffraction at room
temperature (b) and exit beam at intermediate (c) and best focusing state (d) for 3T=10°C.
In order to monitor the dynamic of the self-focussing, all the measurements are automated. A computer-controlled CCD camera records the beam evolution at the exit face of the crystal and measures the focussing beam FWHM in both vertical (along c-axis) and horizontal directions. The minimum reached size is thus easily detected. The experiment is repeated for different beam power. The beam FWHM at optimum confinement versus intensity is plotted
in figure 2(a), for intensities varying between 0.2 MW/m2 and 5 MW/m2. Beam width is observed to widen gradually as intensity is increased.
One-center photorefractive model predicts that self-trapped beams reach a minimum diameter that is independent of light power [12] for a given nonlinear strength. This is in contradiction with the experimental behaviour described in fig. 2a. To better explain the photorefractive effect in LiNbO3, Jermann et. al. introduced the influence of a second active deep center [13]. In LiNbO3, deep centers can be iron and polarons. According to this photorefractive two-center model, we implemented a numerical program to solve the nonlinear beam propagation in biased LiNbO3 [14]. In this time dependent model, both iron impurities and polarons were considered as photoactive centers and the three spatial components of the space charge field were calculated. The model from ref. [14] has been modified to take into account the pyroelectric effect. A straightforward solution is to substitute the applied field with the pyroelectric field 3Epy. Indeed 3Epy is screened under local illumination and can be
considered invariant over the duration of the self-trapping experiments, as for self-trapping with applied field. The measured values of pyroelectric coefficients are p=-10.10-5Cm-2K-1 for congruent LiNbO3 (CLN) composition and p=-9.10-5Cm-2K-1 for stoichiometric LiNbO3 (SLN) composition [15-17]. The calculated output beam FWHM for different input intensities reported in Figure 2b shows good agreement with experimental results (Fig. 2a). IN is the beam intensity normalized to dark irradiance intensity Id, IN=I/Id.
10 15 20 25 30 35 40 45 50 55 1 2 4 6 8 FWHM Z FWHM X Normalized intensity IN FWHM (µm) (b) 0 1 2 3 4 5 6 x 10⁶ 5 10 15 20 25 30 FWHM Z FWHM X Input intensity (W/m²) FWHM (µm) (a)
Fig. 2. Evolution of self-trapped beam FWHM at the exit face of 20mm long congruent LiNbO3 crystal versus
launched light intensity. Beam width along c-axis FWHMz (stars) and in the perpendicular direction FWHMx (circles) for both, experiments (a) and numerical calculations (b). Parameters: Extraordinary polarisation, input spot FWHM=12µm,2=532 nm and 3T=10°C.
One can see that for low power, the output beam is smaller and shows a better confinement than in the high power regime. Light distribution evolution observed at the exit face is evidently dictated by refractive index changes that occur inside the crystal. The numerical model reveals these features, which are challenging to measure experimentally. In addition, numerical results show some key phenomena that are crucial to have a good physical insight of the process.
-8
-8.5
-9
-8.8
-8.9
-9.1
-9
10
-410
-4(a)
(b)
(c)
(d)
I
N =1
Y
Z
X
Z
∆n
along propagation
∆n
at exit face
∆n
along propagation
∆n
at exit face
Y=0 Y=L/2 Y=L
∆n
along propagation
(f )
-8
-8.5
-9
10
-4(e)
∆n
at exit face
3mmI
N =8
I
N =10
Fig. 3. Calculated refractive index distribution cross-section at the exit face (left column) and along propagation (right column) photo-induced in LiNbO3 for three characteristics beam intensities. Parameters: Extraordinary polarization,
2=532 nm, L=20mm and input spot FWHM=12µm.
The refractive index distribution photo-induced inside the medium by a beam of similar size than the experimental one reveals tremendous differences depending on the launched light power (Fig. 3). Parameters are chosen to obtain beam self-trapping giving rise to spatial soliton formation at low input intensity (figs. 3a, b). Injected beam profile is indeed observed to evolve to an almost invariant profile after a short propagation distance. At such a low intensity the photovoltaic field Eph is due to a single deep center [14]. In this case, the
defocusing field Eph is weaker than the chosen focusing pyroelectric field 3Epy and, as a
illuminated area, which leads to self-focusing. Nonetheless, at higher power (figs. 3c, d), a second deep center comes into play and the PV field Eph increases [14]. The photovoltaic field
amplitude Eph gets closer to the amplitude of the pyroelectric field 3Epy and can even exceed
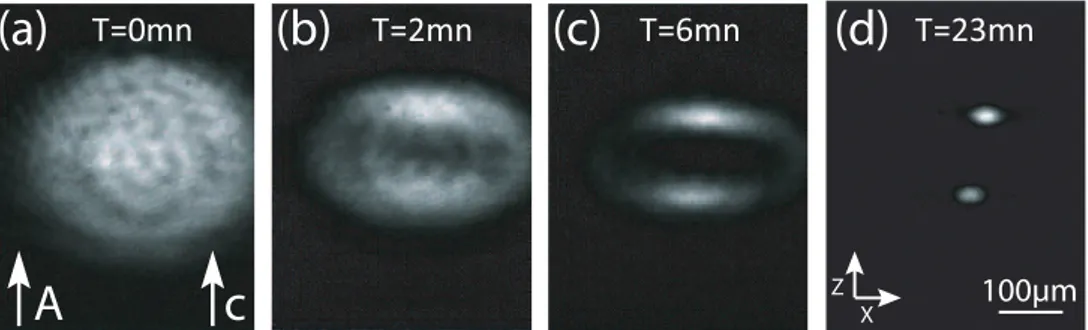
its value at locations where intensity is the highest. The refractive index variation can thus switch sign, as seen, in figure 3d where a defocusing zone surrounded by higher refractive index regions is clearly present at the entrance of the crystal. Such an index profile tends to defocus the beam that lowers its intensity and, as a consequence, a weak focusing state can be reached again after some distance. Such a phenomenon becomes more dramatic as launched beam power is increased. It explains the physics underlying the self-trapped output beam diameter increase versus intensity depicts in figure 2. Simulations from figure 3c-d also show that a similar beam size at the output and input faces does not guarantee formation of a spatial soliton. In particular, high power beams are subject to large change of their transverse profile while propagating inside the medium. Note that the beam behavior with respect to intensity shows good agreement with our two-center PR model with pyroelectric effect. For even stronger power, beam splitting is expected to occur as depicted in the last simulation (fig. 3e-f). In such a case, the light is repelled from the central part and splits in two separate spots located along z (c-axis).
c
A
(a)
T=0mn
(b)
T=2mn
(c)
T=6mn
(d)
T=23mn
100µm
X ZFig. 4. Experimental observation of beam splitting dynamic in a stoichiometric LiNbO3 sample at high power regime
I=1.1 MW/m², 2=532 nm, L=20mm, 3T=10°C, extraordinary polarisation and input spot FWHM=12µm.
Beam splitting is indeed observed experimentally when launched average intensity exceeds the threshold intensity Ith that depends on crystal composition. Figure 4 illustrates the observed dynamic in a SLN sample at an intensity of 0.1 MW/m2. First sign of beam splitting consists in a dark area that appears in the center of the diffracted beam (fig. 4b). The two brighter parts then slowly evolves into confined spots at the output of the crystal (fig. 4d). Very similar behavior is observed in CLN samples except that the threshold intensity is about 3 orders of magnitude higher (Ith=10 MW/m2) than in SLN samples. In both cases, the two focalized spots have dimensions similar to the single spot obtained at low intensity. Moreover, the two spots possess different power and they are not aligned with the z-axis contrary to the prediction of the numerical calculations. These two differences may be explained by photorefractive charge saturation that forms an asymmetric index variation [18] and by an additional photovoltaic component that tilts the splitting beam [19]. These features were not taken into account in our numerical computation, which explains the discrepancies.
3. Photovoltaic field evolution in congruent and stoichiometric lithium niobate
To further characterize this behavior, experiments have been repeated at various intensities below and above Ith. When beam self-focuses to a single spot, beam size at FWHM 4x is measured along c-axis, while beam splitting is characterized by the distance d between the two spots. From 4x measurements we can deduce an evaluation of the photovoltaic field amplitude Eph using the relation [20]:
2 2 ² ph py eff E E n x r λ 1 2 3 4 = ∆ − ∆ 3 4 5 6 (2)
where reff and n are respectively electro optic coefficient (reff =r33) and the average refractive index (n=ne), for extraordinary polarisation. The results are depicted in figure 5. As reported before, the photovoltaic field amplitude Eph increases gradually for intensities below the
splitting threshold Ith. From measurements in Fig. 5a, Eph is 15kV/cm greater in the SLN
crystal than in CLN at low intensity. When the intensity approaches Ith, an abrupt change in
behavior is observed. Ith is evaluated to 0.1 MW/m2 and 10 MW/m2 in stoichiometric and
congruent LiNbO3, respectively. For the temperature 3T =10°C used in these experiments,
1Epy value is estimated to 40kV/cm according to equation 1. From the above developed
physical understanding, the splitting occurs when Eph exceeds this value. This behavior is also
observed in our numerical computations where a stronger input power produces a stronger photovoltaic effect, which tends to split more efficiently the beam. Above Ith, the distance
between the two splitted parts is found to increase with intensity as shown in figure 5b. For even higher intensities (not shown), splitting of the beam in more than two spots is observed experimentally. Note that if a higher temperature (3T=20°C) is set, beam splitting can be avoided for the whole intensity range. This later situation corresponds to a pyroelectric field that stays higher than the photovoltaic field at any intensity.
104 105 106 107 108 0 21 26 31 36 Intensity (W/m )2 -E (kV/cm)ph Focusing d (µm) ∆E = 40kV/cmpy 0 Splitting a) b) 100 200
Fig. 5. Photovoltaic field evolution versus intensity inferred from experimental pyroelectric self-focusing experiments (a) and measured distance between spots when beam splitting has occurred (b) in CLN (circles) and SLN crystals (squares).
For the purpose of beam self-trapping, the tested CLN crystal is found to be a good candidate with a wider range of usable intensities and a consequently faster photorefractive response at low temperature changes. This behavior may be explained if we consider that the photorefractive effect in CLN is due to a dominant single deep center. Presence of a second deep center of a very low concentration induces a significant nonlinearity for the photovoltaic effect only at very high intensity values. In SLN samples the two centers appear to be of similar concentrations to give a low threshold intensity Ith. In both samples, deep centers may
be iron and polarons [21]. Iron is a common photorefractive center that has also been reported to give high PV field values in SLN [22]. Polarons consist of niobium ions occupying vacant lithium sites. Since SLN is nearly free from lithium vacant sites, polarons density should be
much lower in SLN than in CLN. However, other species such as niobium ions in niobium sites could also participate to the photorefractive process [23].
4. Conclusion
In this paper, we have reported the investigation of pyroelectric assisted self-focusing in CLN and SLN. The self-focussing behavior is clearly dependent on the input intensity. For a moderate crystal temperature raise of 10°C, experimental results along with numerical simulations show that spatial soliton can only form at low beam power. As intensity is increased, observation at the ouput face show that trapped beam enlarges. Above a threshold intensity Ith, that depends on crystal composition, beam splitting is observed. 3-D
computations reveal that this behavior is consistent with a nonlinear dependence of the photovoltaic current. The investigation of the splitting shows that for the crystal tested in the study, Ith is 100 times smaller in stoichiometric than in congruent samples. This study paves
the way to fabrication of 3-D photonic circuits.
Financial support provided by the Agence National de la Recherche for project ORA (ANR 2010 BLAN-0312) is gratefully acknowledged.
References
1. I.P. Kaminow, J.R. Carruthers, E.H. Turner, and L.W. Stulz, “Thin-film LiNbO3 electro1optic light
modulator,” Appl. Phys. Lett 22, 540-542 (1973).
2. S. E. Harris and R.W. Wallace, “Acousto-optic tunable filter,” J. Opt. Soc. Am. B 59, 744-747 (1969). 3. C. Q. Xu, H. Okayama, and M. Kawahara, “1.55m band efficient broadband wavelength conversion by
difference frequency generation in a periodically domain1inverted LiNbO3 channel waveguide,” Appl.
Phys. Lett 63, 3559-3562 (1993).
4. A. Ashkin, G. D. Boyd, J. M. Dziedzic, R. G. Smith, A. A. Ballman, A. A. Levinstein, and K. Nassau, “Optically-Induced Refractive Index Inhomogeneities in LiNbO3 and LiTaO3,” Appl. Phys. Lett 9, 72 (1966).
5. R. Müller, M. T. Santos, L. Arizmendi, and J. M. Cabrera, “A narrow-band interference filter with photorefractive LiNbO3,” J. Phys. D: Appl. Phys 27, 241-246 (1994).
6. A. Méndez and L. Arizmendi, “Maximum diffraction efficiency of fixed holograms in lithium niobate,” Opt. Mat 10, 55-59 (1998).
7. L. Hesselink, S. S. Orlov, A. Liu, A. Akella, D. Lande, and R. R. Neurgaonkar, “Photorefractive materials for non-volatile volume holographic data storage,” Science 282, 1089-1093 (1998).
8. M. Taya, M. C. Bashaw, M. M. Fejer, M. Segev, and G. C. Valley, “Observation of dark photovoltaic spatial solitons,” Phys. Rev. A 52, 3095-3100 (1995).
9. E. Fazio, , F. Renzi, R. Rinaldi, M. Bertolotti, M. Chauvet, W. Ramadan, A. Petris, and V. Vlad, “Screening-photovoltaic bright solitons in lithium niobate and associated single-mode waveguides,” Appl. Phys. Lett 85, 2193-2196 (2004).
10. V. Code, M. Chauvet, F.Pettazzi, and E. Fazio. “3-D integrated optical interconnect induced by self-focused beam,” Electron. Lett 42, 463-465 (2006).
11. J. Safioui, F. Devaux, and M. Chauvet, “Pyroliton: pyroelectric spatial soliton,” Opt. Express 17, 22209-22216 (2009).
12. M. F. Shih, P. Leach, M. Segev, M. H. Garrett, G. Salamo, and G. C. Valley, “Two-dimensional steady-state photorefractive screening solitons,” Opt. Letters 21, 324-326 (1996).
13. F. Jermann and J. Otten, “Light-induced charge transport in LiNbO3:Fe at high light intensities,” J. Opt.
Soc. Am. B 10, 2085-2092 (1993).
14. F. Devaux, J. Safioui, M. Chauvet, and R. Passier, “Two-photoactive-center model applied to photorefractive self-focusing in biased LiNbO3,” Phys. Rev. A 81, 013825-013830 (2010).
15. J. Parravicini, J. Safioui, V. Degiorgio, P. Minzioni and M. Chauvet, “All-optical technique to measure the pyroelectric coefficient in electro-optic crystals,” J. Appl. Phys 109, 033106-033110 (2011).
16. T. Bartholomäus, K. Buse, C. Deuper, and E. Krätzig, “Pyroelectric coefficients of LiNbO3 crystals of
different compositions,” phys. status solidi (a)142, K55-K57 (1994).
17. S. V. Yevdokimov, R. I. Shostak, and A. V. Yatsenko, “Anomalies in the pyroelectric properties of LiNbO3 crystals of the congruent composition,” Phys. Solid State 49, 1957-1962 (2007).
18. M. Chauvet, V. Coda, H. Maillotte, E. Fazio, G. Salamo, “Large self-deflection of soliton beams in LiNbO3,” Optics Letters 30, 1977-1979 (2005)
19. J. Safioui, M. Chauvet, F. Devaux, V. Coda, F. Pettazzi, M. Alonzo, and E. Fazio, “Polarization and configuration dependence of beam self-focusing in photorefractive LiNbO3,” J. Opt. Soc. Am. B 26,
20. M. Shih, Z. Chen, M. Mitchell, M. Segev, H. Lee, R. S Feigelson, and J. P Wilde, “Waveguides induced by photorefractive screening solitons,” J. Opt. Soc. Am. B 14, 3091-3101 (1997).
21. M. Simon, F. Jermann, and E. Krätzig, “Light-induced absorption changes in iron-doped LiNbO3,” Opt.
Mater 3, 243-250 (1994).
22. F. Jermann, M. Simon, and E. Krätzig, “Photorefractive properties of congruent and stoichiometric lithium niobate at high light intensities,” J. Opt. Soc. Am. B 12, 2066-2070 (1995).
23. B. Faust, H. Müller, and O. F. Schirmer, “Free small polarons in LiNbO3,” Ferroelectrics 153, 297-302 (1994).