HAL Id: hal-03191089
https://hal.archives-ouvertes.fr/hal-03191089
Submitted on 6 Apr 2021
HAL is a multi-disciplinary open access
archive for the deposit and dissemination of
sci-entific research documents, whether they are
pub-lished or not. The documents may come from
teaching and research institutions in France or
abroad, or from public or private research centers.
L’archive ouverte pluridisciplinaire HAL, est
destinée au dépôt et à la diffusion de documents
scientifiques de niveau recherche, publiés ou non,
émanant des établissements d’enseignement et de
recherche français ou étrangers, des laboratoires
publics ou privés.
Compression moulding of Carbon/PEEK
Randomly-Oriented Strands composites: A 2D Finite
Element model to predict the squeeze flow behaviour
Gilles-Philippe Picher-Martel, Arthur Lévy, Pascal Hubert
To cite this version:
Gilles-Philippe Picher-Martel, Arthur Lévy, Pascal Hubert. Compression moulding of Carbon/PEEK
Randomly-Oriented Strands composites: A 2D Finite Element model to predict the squeeze flow
behaviour. Composites Part A: Applied Science and Manufacturing, Elsevier, 2016, 81, pp.69-77.
�10.1016/j.compositesa.2015.11.006�. �hal-03191089�
1
Compression Moulding of Carbon/PEEK Randomly-Oriented Strands composites: A 2D Finite Element Model to predict the Squeeze Flow Behaviour
Gilles-Philippe Picher-Martela, Arthur Levyb and Pascal Hubert1b
a. Department of Mechanical Engineering, McGill University, 817 Sherbrooke St. West, Montréal, QC, H3A 0C3, Canada
b. Laboratoire de Thermocinétique de Nantes, La Chantrerie, rue Christian Pauc, BP 50609, 44306 Nantes cedex 3, France.
Abstract
Compression moulding of Randomly-Oriented Strands (ROS) of pre-impregnated thermoplastic composites is a process that enables the forming of complex parts with features such as ribs, thickness variations and holes in one single moulding step. This paper focuses on the macroscopic squeeze flow behaviour that occurs during forming. This mechanism rules the filling of intricate features of the mould initially empty. A 2D Finite Element model was developed to predict the squeeze flow of ROS composites. The material was modelled as a Bingham fluid and the equivalent viscosity and yield stress of three different strand sizes were determined using an inverse method. The viscosity and yield stress were found to increase with strand length. Experimental validation of the model was performed using Carbon/PEEK ROS flat samples and the average difference between experimentally measured and predicted final strain was below 5% for all cases.
Keywords:
A. Strand; B. Rheological Properties; C. Finite Element Analysis; E. Compression Moulding
1 Corresponding Author, +1 514 398 6303
Email addresses: gilles-philippe.picher-martel@mail.mcgill.ca (Gilles-Philippe Picher-Martel),
2
1. Introduction
Current applications of thermoplastic composites in aerospace structures are limited to simple components with minimal curvature and thickness variations. Indeed, continuous fibre (CF) thermoplastic composites, while exhibiting excellent mechanical performance, are difficult to form. In compression moulding of textile reinforced thermoplastic [1,2], the deformation is limited to avoid defects, such as wrinkles and ply buckling. On the contrary, the automotive industry can produce parts with intricate features using flow moulding compounds, but their mechanical properties and fibre volume content are generally too low for aerospace applications. Recent announcement by aerospace part manufacturers mentioned that they have successfully advanced the use of thermoplastic composite materials for aerospace structural metal replacement in complex-shape applications previously not suited for composites [3]. To do so, discontinuous long-fibre thermoplastic material was used. It consists of Randomly Oriented Strands of unidirectional pre-impregnated composite tape, denoted in this paper as ROS.
Recent studies on ROS, with high fibre volume fractions (>50%), have shown interesting forming and mechanical characteristics [4-11]. However, to the best knowledge of the authors, the major achievements were mainly on the prediction of ROS mechanical properties [4], but there are no predictive models to simulate the forming mechanisms. This paper focuses on the flow mechanisms governing the processing of ROS thermoplastic composites by compression moulding.
In this process strands of thermoplastic composite pre-impregnated tapes are distributed randomly in a mould cavity. The setup is then heated and compressed to consolidate the material. Complex shapes, including corners, thickness variations, ribs or holes, are obtained in one compression moulding step. Usually, a high pressure (60-120 bar) is needed to form good quality parts [10, 11]. The high pressure prevents short shots and helps to obtain a good consolidation quality with a minimum defects and a low void content.
The deformation that the material undergoes during compression moulding determines: (i) the feasibility of the process and (ii) the final quality of the part. Based on existing work on the deformation mechanisms
3
encountered in randomly distributed fibre bundles forming [12-16], it is assumed that during compression moulding of ROS, the material undergoes three different deformation modes:
1. An elastic compaction behaviour, denoted as packing deformation, at low load. It is mostly
associated to the bending and conformation of the strands. It has been studied by many authors for randomly distributed fibre bundles, Servais et al. [13] suggested an experimental method to measure the packing stress up to 100 kPa (i.e. low normal stress). Luchoo et al. [16] simulated the elastic response at the meso-scale. Hereunder, it is considered that normal stresses (6-12 MPa) involved while press forming ROS is way higher than the packing stress and that the fibre bed is fully compacted. The packing deformation therefore occurs only at very low load during the initial stage of the process and has negligible effects on the part quality. 2. A flow at the mesoscopic scale of the strand. In this mode, the applied pressure results in a spreading of each strand. With this squeezing, the gaps between strands reduce. This mechanism is denoted as the
inter-strand void content (ISVC) reduction. These inter-inter-strand voids have to reduce enough to prevent crack
initiation and dramatic strength property loss in the final part. This later mechanism has been studied in a recent work [17]. An analytical model to predict the ISVC for ROS flat panels under various processing conditions and strands geometry has been developed.
3. A flow at the macroscopic scale of the part. At this scale the material can be considered as a
homogeneous medium that undergoes a squeeze flow imposed by the tool platens. Several authors performed experimental and modelling work on thermoset moulding compounds. In the eighties, Lee and Tucker modelled the flow, heat transfer, and curing involved in compression moulding of reinforced thermoset polymers [18-19]. Barone, Caulk and Osswald studied the flow of chopped-fibre reinforced polymers during compression moulding of thin parts . However, most applications of thermoset SMC are limited to thin wall structures used for non-structural applications [20-24]. In these early models, a simple behaviour (Newtonian or power law) was used. More recently, several analytical models and experimental procedures were
developed to better predict the behaviour of such material [15, 25, 26]. These authors considered the micro-mechanics of dispersed fibres or bundles. They confirmed that contacts between fibres or bundles rule the macroscopic equivalent behaviour. Similarly, for ROS, the viscous behaviour of the equivalent homogeneous
4
material is intimately linked to the sliding between strands. However, to the best knowledge of the authors, no extensive study of that mechanism was performed. The macroscopic squeeze flow plays a dominant role in ROS forming. It rules whether the material will flow and fill intricate features, preventing short shots. These areas, such as corners or ribs, may indeed remain empty after the initial operator positioning of the strands in the mould.
The present study aims at characterizing and predicting this latter macroscopic squeeze flow phenomenon in order to better understand its sensitivity to the process parameters (temperature, pressure, strand geometry). During compression moulding of ROS composites, the material is deformed between two matching dies with a combination of heat and pressure. As a first step toward the understanding of the process, a study of the squeeze flow mechanism between two parallel plates is proposed.
1.1 Macroscopic squeeze flow
In order to predict the moulding of ROS composite parts, one has to study the macroscopic flow behaviour under representative processing conditions. Squeeze flow corresponds to a kinematic where a material is deformed between two parallel platens approaching each other at a constant applied force or closure rate [27]. The squeeze flow test is a rheometry method used on a wide range of materials, including purely viscous and viscoplastic liquids, viscoelastic solids and purely elastic solids. Engmaan et al. [27] reviewed the major experimental techniques and models developed in the past years.
The squeeze flow test can also be used to characterize the mechanical behaviour of fibre reinforced thermoplastic materials. Shuler and Advani [28] considered unidirectional fibre reinforced composites as a homogeneous continuum medium with an effective bulk transverse shearing viscosity 𝜂. When the flow occurs solely in the transverse fibre direction, since the inextensible fibres are considered to restrict flow in their direction, the flow can reasonably be considered two dimensional. Because the platen gap is usually an order of magnitude smaller than the sample width, lubrication assumption holds. Under these assumptions, the Stokes equation reduces to one single scalar equation that can easily be solved numerically to predict the sample height evolution as a function of time [28, 29].
5
However, a previous study by the authors [8, 30] showed that these assumptions can neither be extended to ROS composites, nor to the forming of UD composites under high strain. Even using a shear thinning Carreau law, the long time plateau behaviour observed when performing squeeze flow experiments under high strain, could not be reproduced. It was observed that UD and ROS composites follow a viscoplastic behaviour with a yield stress, when subjected to high pressure and large strain.
1.2 Bingham fluid resolution
Over a critical stress level, ie. when the second invariant of the stress tensor 𝜏 exceeds the yield stress 𝜏!,
viscoplastic materials start flowing. In the general case, there may be solid-like areas (unyielded regions) and fluid like areas (yielded regions). In some cases, a viscoplastic material can flow and deform throughout its whole domain, if the stress is everywhere above the yield stress, or it may not flow at all, if the stress is below this value everywhere [31-39].
Viscoplastic materials are often referred as Bingham Plastics after Bingham [38] who was the first in 1919 to describe paint using a yield stress behaviour. Many constitutive relations have been developed to model the viscosity of viscoplastic materials. The most common viscoplastic models are the Bingham model, the Herschel-Bulkley model and the Casson model [38-40]. Mitsoulis [35] reviewed the different models and several benchmark problems of viscoplastic flows. In this paper, as a first step the Bingham model was considered, equation (1) presents the Bingham model in tensor form:
In the above expressions, 𝜏 is the shear stress, 𝜂! is the viscosity, and 𝛾 is the L2 norm of the symmetric
rate-of-strain tensor. The Bingham equation follows a Newtonian behaviour above the yield stress. As the matrix is a thermoplastic polymer, the fluid regime should exhibit a shear thinning behaviour. Nonetheless, in the first attempt at determining a shear thinning Carreau behaviour for this complex ROS material, the yield effect proved to be a first order phenomenon [30]. Thus, in this paper, the most simple viscoplastic behaviour (eq. (1)) is tried to reproduce the plateau.
𝜏 = 𝜂!+
𝜏!
𝛾 𝛾 𝑓𝑜𝑟 𝜏 > 𝜏! 𝛾 = 0 𝑓𝑜𝑟 𝜏 ≤ 𝜏!
6
In the case of such a viscoplastic behaviour, the lubrication assumption is not valid anymore, and the spatial dimensions need to be accounted for in the resolution of the flow problem [33, 34]. There is no known analytical solution for this problem.
The main challenge in solving a viscoplastic flow problem is that all the theoretical models presented above are discontinuous at 𝜏 = 𝜏!. Papanastasiou [34] proposed a modification of the Bingham model (eq. 1) with
an exponential stress-growth term.
It converts the conditional equations into one analytical expression with an equivalent viscosity that is the analog of a Non-Newtonian fluid. This model smoothes the discontinuity of the Bingham viscoplastic model and makes it much easier to implement and solve numerically.
In this paper, a model to predict the squeeze flow of ROS Carbon/PEEK composites using the modified viscoplastic Papanastasiou equation was developed. Section 2 presents the model development and numerical implementation. Section 3 presents the experimental methods, materials and procedures used to validate the model. Finally, Section 4 presents the experimental results, model validation and discussion.
2. Modelling and simulation
As a first step in the understanding of the macroscopic flow of ROS, the squeeze flow of a flat pre-consolidated rectangular plate is modelled. As discussed in the previous section, several deformation mechanisms occur during compression moulding of ROS. In order to avoid measuring pre-consolidation effects, due to the inter-strand void content reduction [17] and packing stresses, pre-consolidated ROS samples were used for all the squeeze flow tests performed in this study. This was done to ensure solely a macroscopic squeeze flow deformation mode. Also, in this paper, the squeeze flow was restricted to one direction (see Figure 1), by constraining two sides of the sample, thus reducing the problem to a two
𝜂!"= 𝜂! 1 + 𝛬 𝛾 ! (!!!)! +𝜏! 1 − 𝑒 !! ! 𝛾 (2)
7
dimensional problem. Because lubrication assumption does not stand, the Stokes flow problem has to be solved numerically in the spatial domain and over time.
The spatial discretization is handled using the finite element method. Several difficulties appear when solving the squeeze flow of a Bingham fluid, mainly the highly non linear behaviour (eq.(2)), the large deformation and the singular boundary condition imposed by the moving platen.
2.1 Modelling
2.1.1 Equilibrium
Because of the high equivalent viscosity of the composite melt, the inertia and gravity terms can be neglected, such that the local equilibrium reduces to:
where 𝝈 is the total Cauchy stress tensor. Pre-consolidated ROS samples were used for all the squeeze flow tests performed in this study. This was done to focus on the pure macroscopic squeeze flow behaviour and avoid pre-consolidation effects. The material is then assumed incompressible, such that the velocity 𝒖 satisfies:
Only the deviatoric stress
can be obtained from the kinematic (strain rate 𝜸) and the total stress tensor 𝝈 is known to within a hydrostatic pressure 𝑝:
𝛁 ∙ 𝝈 = 𝟎 (3)
𝛁 ∙ 𝒖 = 0. (4)
𝝉 = η𝜸 (5)
8
2.1.2 Behaviour
Instead of the conditional visco-plastic behaviour, the smoothed exponential approach (equation (2)) suggested by Papanastasiou [34] and used later [33] was used here. As a first approximation, the fluid was considered to behave as a Bingham fluid, i.e. the exponent 𝑛 was set to 1, such that equation (2) reduces to:
This way, the flow behaviour of ROS composites can be characterized by an equivalent Newtonian viscosity 𝜂! and a yield stress 𝜏!. The exponent 𝑚 is used to smooth the discontinuous yield stress behaviour. When 𝑚
is increased, the equation converges to the ideal discontinuous behaviour. These parameters will be characterized in section 4.1.
2.1.3 Constitutive equation
Equation (3) to (7) lead to the following constitutive equations for the flow problem:
2.1.3 Geometry
Figure 1 shows a top and side view of the sample placed in the tool cavity and the geometrical domain used for the model. Figure 1a) shows a top view of the sample placed in the instrumented hot-press tool cavity. The sample (in black) initially covers one-half of the mould cavity and is restricted on three edges by the tool picture frame. Considering the mould and sample symmetry, a 2D cross-section of the sample at the tool centerline was considered for modelling, as shown on Figure 1b). Therefore, edge effects at the interface with the picture frame are not considered in this model. As shown on Figure 1b), the light gray region corresponds
𝜂!"= 𝜂!+ 𝜏! 1 − 𝑒!! ! 𝛾 (7) 𝛁 ⋅ η! 𝜸 + 𝜏! 1 − 𝑒!! ! 𝛾 𝜸 = 𝜵𝑝 𝜵 ⋅ 𝒖 = 0 𝜸 = 𝜵𝒔𝒖 𝛾 = 1 2𝑇𝑟 𝜸×𝜸 (8)
9
to the pre-consolidated ROS flat panel. The sample has a rectangular cross-section and using the horizontal symmetry, only the bottom half of the sample and tool cavity are considered.
2.1.4 Boundary conditions
Using the problem symmetry, only one half of the domain was considered in the model. Besides symmetry boundary conditions, the right edge of the domain was let free and a vertical displacement was applied on the top boundary corresponding to the symmetry plane:
The platen velocity 𝑑ℎ(𝑡)/𝑑𝑡 imposed on the top platen is an additional scalar unknown that is calculated at each time step with the platen force balance equation. Indeed, The closing force 𝐹 applied on the bottom boundary 𝛤 is known, but the normal stress distribution at the boundary is not. It should follow the force balance equation:
where 𝒆! is the vertical normal vector to the boundary in contact with the top platen 𝛤, 𝐿! is the width of the
cavity, and W its depth. Eq. (10) is the last scalar equation that closes the unknown boundary condition (9) and defines the force imposed squeeze flow problem.
Also, a no-slip boundary conditions was imposed at the interface with the bottom platen, such that:
where 𝒖 and 𝒗 are respectively the horizontal and vertical velocity vectors.This no-slip condition was observed in an experimental study by the authors using X-Ray tomography. It showed that the ROS Carbon/PEEK material sticks to the tool platens during squeeze flow tests [9].
𝒗 =𝑑ℎ(𝑡)/𝑑𝑡 2 𝑎𝑡 𝑦 = ℎ(𝑡)/2 (9) 𝛔 ! ∙ 𝒆𝒚∙ 𝒆𝒚𝑑𝑆 = 𝑊. 𝛔 !! !!! (y = h) ∙ 𝒆𝒚∙ 𝒆𝒚𝑑𝑙 = 𝐹 (10) 𝒖 = 𝒗 = 𝟎 𝑎𝑡 𝑦 = 0 (11)
10
2.2 Numerical methods
2.2.1 Mesh and large deformation
In order to deal with the large in-plane deformations associated with the squeeze flow of ROS, an original mixed Eulerian-Lagrangian approach was developed. In this case, out-of-plane deformations are much smaller than in-plane deformation. To avoid dealing with highly deformed mesh, an Eulerian approach was used for the in-plane direction. The dotted region in Figure 1.b corresponds to the model domain that is meshed. The bottom half of the pre-consolidated sample covers half of the domain and the rest is initially filled with air.
Meanwhile, the mesh was deformed in the out-of-plane (y) direction according to the closure of the mould. In the y-direction, the mesh deforms according to the calculated sample height at a given time step ℎ(𝑡). At each time step, the deformed mesh coordinates 𝒀! are simply updated by the following equation:
Where ℎ! is the initial sample height and 𝒀 the reference mesh coordinates This Lagrangian approach in the
out-of-plane direction simplifies the application of the boundary condition in the contact with the platen. In addition, in the Eulerian in-plane framework, a level-set was used to track the in-plane position of the interface between material and air throughout the whole simulation. Initially, the interface was set in the middle of the mould cavity, according to the experimental pre-consolidated sample edge.
Figure 2 shows the mesh and boundary conditions for the model. The domain is meshed with 7984 unstructured triangular elements. 2D triangular elements were generated and refined around the initial position of the interface and near the mould cavity boundary, where high strain rates will occur. The mesh was separated in two sub-domains with different material properties. The left domain has an equivalent viscosity given by equation (4) and the right domain has simply the constant Newtonian viscosity of the air (18.3x10⁻⁶ Pa-s).
𝒀!= 𝒀(ℎ(𝑡)
ℎ!
11
2.2.2 Implementation
In order to solve this highly non-linear problem with original boundary conditions (9) and (10) and large deformations, COMSOL Multiphysics was used. This software can solve strongly coupled partial differential equations. It allows to define any analytical expressions for the viscosity term in Stokes equation, it can handle mesh large deformations and any additional scalar equations defined by the user. The whole system of equations is then fully coupled and can be solved simultaneously using robust non-linear algorithms.
The Stokes flow defined by equations (7) to (10) was solved using the two phase flow module in COMSOL Multiphysics. A mixed formulation was used for the velocity and pressure fields using a standard P2/P1 interpolation (quadratic for the velocity field, linear for the pressure). A level-set tracked the interface. The time integration was handled using the built-in backward Euler time-dependent solver.
The force balance (10) was implemented using an additional physics (global algebraic equation), thus adding the scalar unknown 𝑑ℎ(𝑡))/𝑑𝑡 to the model.
The nonlinear problem arising from the non-constant viscosity (7) was solved using a lumped Newton-Raphson method. A constant damping factor of 1 was used. At each time step a relative tolerance of 1x10⁻³ was reached. The maximum number of Newton-Raphson iteration was set to 25.
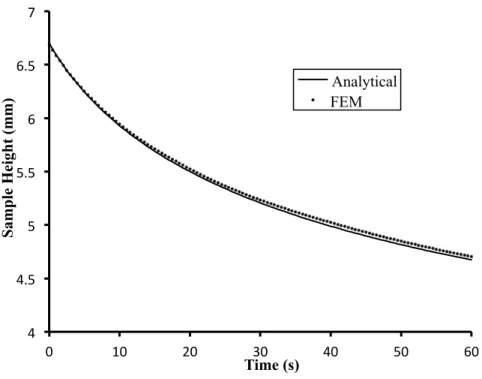
In order to validate the solving procedure, a test case was performed (see appendix). The material was considered Newtonian, such that the lubrication assumption stands, and an analytical solution exists. Comparison was performed between the finite element simulation and this analytical solution.
2.4 Final strain and flow distance
The model provides the sample height evolution ℎ(𝑡) as a function of time. The out-of-plane strain 𝜀 is then defined as
12
where ℎ! is the initial height. The strain, and especially its final value, is useful to quantify the deformation
under given processing conditions.
3. Experimental procedures
3.1 Materials
The material used in this study is a Carbon / PEEK (PolyEtherEtherKetone) pre-impregnated unidirectional tape composite. ROS samples were manufactured using chopped strands of pre-impregnated tape. They were supplied already cut at the desired width and length. Unlike usual moulding compounds, that exhibit a variation in chopped strands dimensions, the ROS studied here, all have the same dimensions. The fibre volume fraction was approximately 60%. The consolidated ply thickness was 0.136 mm. The manufacturer’s recommended consolidation temperature was between 370 and 400 ⁰C. In this study, three different strand sizes were considered: Large (25.4mm long by 6.35 mm wide), Medium (12.5mm long by 3.18mm wide) and Small (6.35mm long by 3.18mm wide).
3.2 Instrumented hot-press
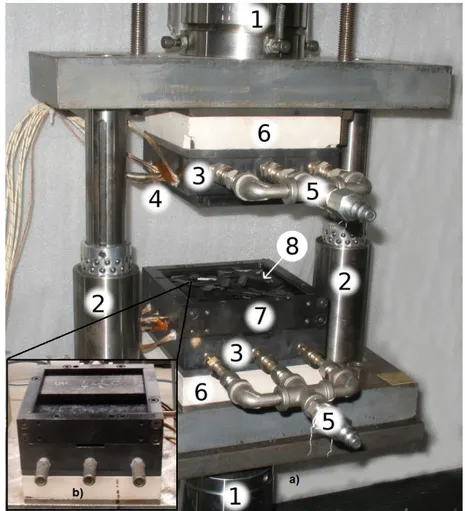
A specific instrumented hot press was designed (Figure 3) [9, 30]. The fixture consisted of a custom built miniaturized heated press with two H13 steel platens (100 mm x 100 mm) heated using four 500 W cartridge heaters. The platens’ temperature was controlled with a PID controller from Watlow. A picture frame was placed on the bottom platen to ensure that the material remained inside the testing section throughout the tests. A cooling system using compressed air was also used to cool down the fixture after each test. The apparatus was mounted in a 250 kN MTS compression testing machine that controls the applied force. The closing of the mould was measured using the MTS transducer.
3.3 Test procedure
ROS preconsolidated flat laminates were used to perform all the squeeze flow tests presented in section 4. This ensured that consolidation effects at low load (packing stress and ISVC mechanisms discussed in section 1.1) were not observed during the experiments but only the squeeze flow behaviour of interest here.
13
3.3.1 Sample preconsolidation
The ROS samples used in this study were cut from 184 mm by 279 mm flat panels pre-consolidated by compression moulding on an industrial press. The laminates were made using a steel tool with a 184x279 mm cavity. 560 g of material was used for each ROS laminates, to reach an average thickness of 6.5 mm ±0.2 mm. Strands were added to the mould in small batches and shuffled manually each time to ensure random
distribution and minimize their out-of-plane orientation. Then the mould was closed and placed into a Wabash 100 Tons hot press preheated to 395 °C. A thermocouple was placed into a hole on the side of the mould to measure and monitor the plate temperature during the cycle. A pressure of 22 bars was then applied and maintained during 15 minutes. The mould was then cooled down to 70 °C at an approximate rate of 12 °C/min and was removed from the press when the temperature dropped below 70 °C. The panels were trimmed and 50.8 x 101.6mm samples were cut using a diamond blade saw.
3.3.2 Squeeze flow tests
The squeeze tests were all performed at 400 ⁰C on the pre-consolidated 50.8 by 101.6 mm samples. The instrumented hot-press platens were coated with FREEKOTE 700-NC release agent before each tests to prevent material sticking to the platens and ease demoulding. The samples were placed against one edge of the picture frame, covering half of the bottom platen and the upper platen was moved down until a contacting force was measured. The MTS machine was set in force control mode. The contacting force (80-100N) was low compared to the applied force during the test (1 to 20 kN), ensuring no flow during the heating phase. The platens were then heated to 400 ⁰C in about 15-20 min. Force control allowed for a compensation of the thermal expansion of the setup.
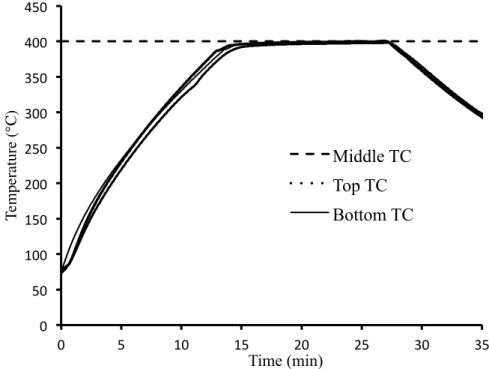
The platens are then kept at 400°C using the PID controller. In order to verify when isothermal condition is reached, a specific stabilization test was first performed. Thermocouples were placed in the middle of a 6.5 mm thick sample, at top, bottom and in the mid-plane of the sample. The platens were heated and kept at 400°C, according to the experimental procedure. Figure 4 shows the temperature in these three thermocouple
14
and suggest that a stabilization time of 10 min is enough to ensure isothermal conditions. This stabilization time is to be compared to the characteristic through thickness diffusion time in the preconsolidated sample:
In the present case, the material density ρ ≈ 1300 kg/m!, its heat capacity c
!≈ 1700 J. kg!!K!!, its
through thickness thermal conductivity K ≈ 0.7 Wm!!K!! and the plate thickness h = 6.5 mm. The
characteristic through thickness heat diffusion time is then t!≈ 30 s. This also confirms that steady state isothermal condition is reached after 10 minutes, which is 20 times t!.
A closing force according to the test matrix given in Table 1 was then applied in a one second ramp and maintained during 5 min. The press was cooled down using compressed air. The cooling rate was not controlled but measured to be approximately 15 ⁰C/min. Finally, when the temperature dropped below 143 ⁰C, which is the glass transition temperature of PEEK, the press was opened and the sample ejected. Sample length, width and thickness were measured prior and after each squeeze flow test using a micrometer and caliper.
Three different strands size were tested and three different load levels were used for each strand size. The load levels were such that the material flowed and filled the whole cavity only at the highest load level.
In summary, for each experiment the sample thickness was acquired versus time in-situ and the final width was measured after the test.
4. Results
In this section, the experimental and modelling results obtained following the procedures presented in section 2 and 3 are presented and discussed.
4.1 Viscosity and yield stress determination
The equivalent viscosity and yield stress of the ROS melt depend on the strand size. For the three different strand size tested, these two parameters were determined by fitting the experimental and modelled sample
𝑡
!=
𝜌𝑐
!𝐾
ℎ
2
! (14)15
height evolutions for the highest load level. The obtained parameters, given in Table 2, were then used as input to predict the sample height reduction for the two other load levels.
The viscosity values found increased with strand size. The viscosity of large and medium strands were respectively five and four times higher than the viscosity of small strands (42 and 30 compared to 8kPa.s). The yield stress also increased with strand size, but less drastically. It increased by 15% between small and medium strands and by 86% between medium and large strands.
Small and medium strands had the same width (3.18 mm), but medium strands were twice longer (12.7 compared to 6.35 mm). Therefore, the strand length strongly affected the melt viscosity. Indeed, doubling length resulted in increasing viscosity by a factor 4. For the yield stress values, the difference between small and medium strands was less significant. However, the yield stress values found for large strands were significantly higher, than small and medium strands. Large strands were longer than small and medium strands but also wider, suggesting that the yield stress was more affected by strand width than strand length.
Figure 5 shows a comparison of the experimentally measured and predicted sample height versus time, for the three load levels tested, for the medium strands case. The R2 coefficient was over 97% for all nine test cases.
A good agreement was observed between predicted and measured height as a function of time, especially for the final height. Also, the model predicts the plateau behaviour of ROS that was observed in a previous study and was not captured by purely viscous models [30]. The viscosity value that were found determined the sample height reduction rate 𝑑ℎ(𝑡))/𝑑𝑡 in the first seconds of the squeeze flow test, whereas the yield stress values influence the onset of the plateau and the final strain value. When the load level is relatively low, such as the 2kN load case shown in Figure 5, the sample height reduction is slower and the yield stress restricts the final strain to only 20%. For medium strands, at a load of 10kN, most of the flow occurred in the first 30 seconds and the final strain calculated using equation (14) was near 50%.
4.2 Flow front prediction
The flow front in plane position was tracked using a level-set method as defined in section 2, whereas he mesh deforms in the thickness direction only (equation (12)). Figure 6 shows the predicted progression of the
16
interface at several time instant for the 5kN load case with small strands. Note that with the symmetry assumption only half of the flow profile was modelled and is shown on Figure 6.
At 𝑡 = 0 𝑠, the interface is located at the right edge of the ROS sample (0.0508 m). Then, when the load is increased to 5kN at 𝑡 = 1 𝑠, the flow advances following a plug-flow profile and the velocity is maximum at the symmetry plane. The flow front velocity slowly reduces as the sample height decreases. At 𝑡 = 300 𝑠, the average position of the flow front has almost reached the right boundary and the out-of-plane strain is nearly 50%. The dashed line represents the average final X-position of the flow front that was measured
experimentally for the 5kN load case with small strands. Overall for the nine test cases, the final flow front position was consistent with experimental measurements, with less than 10% difference.
Figure 7 shows a comparison of the flow front position for the first two seconds of the simulation, for the three strand size used in this study, and the 5kN load case. The Y-position was normalized with respect to the initial sample height of each samples tested experimentally. The flow front progressed more quickly for smaller strands, since the viscosity and yield stress were lower. For small strands, after 1 second the flow front progressed more than large strands did after 2 seconds. Also, the shape of the plug flow profile in the first seconds is strongly influenced by the strand size. For medium and large strands, the flow profile is more uniform, while for small strands the deformation is much larger in the middle of the sample, especially after 2 seconds.
4.3 Strand size effect on viscosity and yield stress
Figure 8 shows a comparison of the sample experimental and predicted sample height as a function of time, for the three load levels, for small strands. Again, the average error was below 3% between the predicted and experimentally measured values. By comparing Figure 5 and 8, for medium and small strands respectively, it is clear that strand length has a significant effect on the material viscosity and yield stress behaviour. For a load level of 5kN, the slope, corresponding to the closure rate 𝑑ℎ(𝑡))/𝑑, is much higher in the first seconds for small strands than for medium strands. For small strands, 75% of the total deformation already occurred before 20 seconds, while for medium and large strands it takes around 40 and 60 seconds, respectively, to reach a similar level of deformation.
17
This behaviour is due to the equivalent viscosity 𝜂! that influences the initial closure rate 𝑑ℎ(𝑡))/𝑑𝑡. For a
given load level, an increase of 𝜂! led to a decrease of 𝑑ℎ(𝑡))/𝑑𝑡. As mentioned earlier, the value found for
the viscosity of medium and large strands was around 4 and 5 times higher compared to small strands. This shows the influence of the strand size on the viscosity and thus, the flow rate in the first seconds of the squeeze flow test.
4.4 Validation with experimental data
Finally, Figure 9 shows a summary of the final strain achieved for the three load levels tested in this study, and the three different strands size, based on equation (13). The experimental results were compared with the predicted values. Again, agreement was found for the final predicted strain values with a R2 of 99%. It is important to note that the strain was restricted to a maximum of 50% in this study, because of the cavity dimension. However, previous studies by the author showed that strains up to 80% could be obtained with higher load levels [30].
The strand size effect is shown on Figure 9: under a load of 5kN the final strain reached for large strands is around 0.26 while for small strands it is above 0.4. This shows that the strand size has a large effect on the yield stress and thus the final strain. This yield stress increased with strand size was observed on similar materials. Indeed, Servais et al. [12-14] showed that the yield stress of short fibre suspensions and fibre bundle suspensions was greatly affected by the fibre or bundle aspect ratios. They found that larger bundle suspensions have higher yield stress. It is also known that for fibre bundle suspensions, fibre-fibre
interactions, such as dry and lubricated friction mechanisms are affecting the composite melt viscosity and yield stress. So, it is believed that these mechanisms are likely to affect the yield stress behaviour of ROS composites as well. The aspect ratio and dimension increases between small, medium and large strands leads to larger contact areas between the strands and therefore higher friction components, which directly influences the yield stress.
18
Using the predictive model developed in this study, it was found that larger strands resulted directly in an increase of the viscosity and yield stress values. Finally, the viscoplastic behaviour proved accurate at predicting the experimental final strain in squeeze flow of ROS.
5. Conclusions
The macroscopic flow occurring during compression moulding of randomly oriented strands (ROS) of thermoplastic composite was modelled. In previous attempts at modelling such flow, the asymptotic plateau could not be recovered using viscous behaviour (Newtonian or Carreau shear thinning). The major
contributions of the present work are:
• The use of a viscoplastic law to model the macroscopic squeeze flow of ROS. This behaviour only calls for two physical material properties (yield stress and viscosity).
• A finite element implementation of this model, using specific numerical methods (mixed Lagrangian/Eulerian approach, modified Papanastasiou law, coupled boundary conditions). • Experimental isothermal squeeze flow tests using an instrumented hot press. These tests permitted:
o Identification of the material properties (yield stress and equivalent viscosity) for three types of ROS materials. The larger the strands the higher the yield stress and the equivalent viscosity.
o Experimental validation of the numerical predictions. A viscoplastic model proved efficient at reproducing the behaviour of such ROS materials.
The proposed numerical implementation could be integrated in existing industrial finite element codes, such as injection moulding codes. This would open the way to prediction of flows in more complex and industrial geometries.
19
Acknowledgements
The authors would like to greatly acknowledge financial support provided by McGill University and the industrial partners: Bell Helicopter Textron Canada Limited, Bombardier Inc., Pratt and Whitney Canada Corp., Hutchinson Aerospace-Industry, Delastek Inc. and Avior Integrated Products Inc. The authors would also like to acknowledge Steven Roy from National Research Council Canada, as well as Quentin Fabien, Benoit Landry and Dominic Leblanc from McGill University for their help in the design, manufacturing and calibration of the instrumented hot press. The authors would also like to acknowledge the funding provided by the Natural Sciences and Engineering Research Council (NSERC) and the Consortium for Research and Innovation in Aerospace in Quebec (CRIAQ). The authors would finally like to thank two of the anonymous reviewers for their constructive comments on this work.
References
1. Thomanny, U. I. and Ermanni, P. The Influence of Yarn Structure and Processing Conditions on the Laminate Quality of Stampformed Carbon and Thermoplastic Polymer Fiber Commingled Yarns, Journal of Thermoplastic Composites, 2004. 17 (3), 259-283.
2. Boisse, P., Hamila, N., Vidal-Sallé, E. and Dumont, F. Simulation of Wrinkling during textile composite reinforcement forming. Influence of tensile, in-plane shear and bending stiffnesses. Composites Science and Technology. 2011. 71(5): p. 683-692.
3. Greene, Tweed and Aerolia validate thermoplastic aerospace part, in Composites World. 2014. 4. Feraboli P., et al., Characterization of Prepreg-Based Discontinuous Carbon Fiber/Epoxy
Systems. Journal of Reinforced Plastics and Composites, 2008: 28(10) p. 1191-1214.
5. Feraboli, P., et al., Stochastic laminate analogy for simulating the variability in modulus of discontinuous composite materials. Composites Part A: Applied Science and Manufacturing, 2010. 41(4): p. 557-570.
6. van Wijngaarden J., Jongbloed A., and d.V. J. Thermoplastic Compound Compression Molding. in SAMPE Technical Conference. 2010. Seattle, USA.
7. Selezneva M., et al. Compression Moulding of Discontinous-fibre Carbon/PEEK composites: study of mechanical properties. in SAMPE Conference. 2012. Baltimore, USA.
8. Picher-Martel, G.-P. and P. Hubert. Squeeze flow behavior of Carbon/PEEK randomly oriented strands under transverse compaction. in American Society for Composites Conference. 2012. Arlington, TX, USA.
9. Picher-Martel, G.-P., A. Levy, and P. Hubert. Squeeze flow of Randomly-Oriented Strands thermoplastic composites. in 19th International Conference on Composite Materials 2013. Montréal, Canada.
10. Eguèmann N, et al. Compression Molding of Complex Parts for theAerospaceWith Discontinuous Novel And Recycled Thermoplastic Composite Materials. in 19th International Conference on Composite Materials. 2013. Montréal, Canada.
11. LeBlanc D., et al. Compression molding of complex parts using randomly-oriented strands thermoplastic composites. in SAMPE Technical Conference. 2014. Seattle, USA.
12. Servais, C., A. Luciani, and J.-A.E. Månson, Fiber–fiber interaction in concentrated suspensions: Dispersed fiber bundles. Journal of Rheology, 1999. 43(4): p. 1005-1018.
13. Servais, C., V. Michaud, and J.-A.E. Månson, The packing stress of impregnated fiber mats. Polymer Composites, 2001. 22(2): p. 298-311.
14. Servais, C., A. Luciani, and J.-A.E. Månson, Squeeze flow of concentrated long fibre suspensions: experiments and model. Journal of Non-Newtonian Fluid Mechanics, 2002. 104(2– 3): p. 165-184.
20
15. Sepehr, M., et al., Rheological properties of short fiber model suspensions. Journal of Rheology, 2004. 48(5): p. 1023-1048.
16. Luchoo R, et al. Macro-scale Modelling of Discontinuous Fiber Composites. in 18th International Conference on Composite Materials. 2011. Jeju Island, South Korea.
17. Levy Arthur and H. Pascal, Interstrand Void Content evolution in compression molding of Randomly Oriented Strands (ROS) of thermoplastic composites. Composites Part A: Applied Science and Manufacturing, 2015. 70: pp.121-131
18. Lee C., Folgar F. and Tucker C., Simulation of compression molding for fibre-reinforced thermosetting polymers. J. Eng. Ind, 1984. 106:114-25.
19. Lee C. and Tucker C. Flow and heat transfer in compression mold filling. Journal of Non-Newtonian Fluid Mechanics 1987. 24(3):245-64.
20. Osswald T. and Tucker C. Compression mold filling simulation for non-planar parts. International Journal of Polymer Process 1990. 5(2):79-87.
21. Barone M. and Caulk D. Kinematics of flow in sheet molding compound. Polymer composites, 1985. 6(2):105-9.
22. Barone M. and Caulk D. The effect of deformation and thermoset cure on heat conduction in a chopped-fiber reinforced polyester during compression molding. International Journal of Heat and Mass Transfer, 1979. 22(7):1021-31.
23. Barone M. and Caulk D. A model for the flow of a chopped fiber reinforced polymer compound in compression moulding. Journal of Applied Mechanics, 1986. 53(191):361-70.
24. Barone M. and Osswald T. Boundary integral equations for analyzing the flow of a chopped fiber reinforced polymer compound in compression molding. Journal of Non-Newtonian Fluid Mechanics, 1987. 26:185-206.
25. Sepehr, M., G. Ausias, and P.J. Carreau, Rheological properties of short fiber filled polypropylene in transient shear flow. Journal of Non-Newtonian Fluid Mechanics, 2004. 123(1): p. 19-32.
26. Dumont, P., et al., Compression moulding of SMC: In situ experiments, modellingand simulation. Composites : Part A, 2007. 38: p. 353-358.
27. Engmann, J., C. Servais, and A.S. Burbidge, Squeeze flow theory and applications to rheometry: A review. Journal of Non-Newtonian Fluid Mechanics, 2005. 132(1–3): p. 1-27.
28. Shuler, S.F. and S.G. Advani, Transverse squeeze flow of concentrated aligned fibers in viscous fluids. Journal of Non-Newtonian Fluid Mechanics, 1996. 65(1): p. 47-74.
29. Advani, S.G., T.S. Creasy, and S.F. Shuler, Chapter 8 Rheology of long fiber-reinforced composites in sheetforming, in Composite Materials Series, D. Bhattacharyya, Editor. 1997, Elsevier. p. 323-369.
30. Picher-Martel, G.P., A. Levy, and P. Hubert, Compression Molding of Carbon/PolyEther Ether Ketone Composites: Squeeze Flow Behavior of Unidirectional and Randomly-Oriented Strands. Polymer Composites, 2015. (in press).
31. Lipscomb, G.G. and M.M. Denn, Flow of bingham fluids in complex geometries. Journal of Non-Newtonian Fluid Mechanics, 1984. 14: p. 337-346.
32. Papanastasiou, T.C., Flows of Materials with Yield. Journal of Rheology1987. 31(5): p. 385-404.
33. Smyrnaios, D.N. and J.A. Tsamopoulos, Squeeze flow of Bingham plastics. Journal of Non-Newtonian Fluid Mechanics, 2001. 100(1–3): p. 165-189.
34. Papanastasiou, T.C. and A.G. Boudouvis, Flows of viscoplastic materials: Models and computations. Computers & Structures, 1997. 64(1–4): p. 677-694.
35. Mitsoulis, E., Flows of viscoplastic materials: models and computations. Rheology reviews, 2007: p. 135-178.
36. Karapetsas, G. and E. Mitsoulis, Some experiences with the slip boundary condition in viscous and viscoelastic flows. Journal of Non-Newtonian Fluid Mechanics, 2013. 198(0): p. 96-108. 37. Coussot, P., Yield stress fluid flows: A review of experimental data. Journal of Non-Newtonian
21
38. Bingham, E.C., Fluidity and Plasticity. 1922, New-York: McGraw-Hill.
39. Herschel, W.H. and R. Bulkley, Konsistenzmessungen von Gummi-Benzol-Loesungen. Kolloid Z., 1926. 39: p. 291-300.
22
Appendix : Validation of the simulation tool on a Newtonian case.
The numerical implementation was tested on a Newtonian case where the viscosity is constant. In that case, the lubrication assumption stands if ℎ << 𝐿 and the analytical solution writes
The test case is performed close to the conditions of section 4.2. A closing force F=5000N was used, a Newtonian viscosity 𝜂 = 5.10!𝑃𝑎. 𝑠 was considered. The initial sample length 𝐿
!= 50.8 𝑚𝑚, width
𝑊 = 101.6 𝑚𝑚, and height ℎ!= 6.7𝑚𝑚. The problem was solved between 𝑡 = 0𝑠 and 𝑡 = 60𝑠. Figure 10
presents the evolution of the sample height ℎ versus time computed using the presented finite element method, and the analytical prediction under lubrication assumption. The deviation is small, with a final error below 1%. This slight error is related to analytical model, which does consider a flat normal front advance. On the contrary, a fountain effect appears with the Poiseuille squeeze flow. This effect is taken into account in the FEM simulation thus leading to this slight deviation.
ℎ = 5𝐹 𝑊𝜂 2𝐿! !ℎ!! 𝑡 + ℎ!!! !! ! (15)
23
Figure 1: a) Top view of the sample placed in the mould. Three of the sample edges are restricted by the
picture frame. The model considers a 2D cross-section at the red center line. b) Geometrical domain for the 2D model. Red arrows represents the distributed load F imposed by the hot press. The bottom half is considered in the model.
24
Figure 2: Mesh and boundary conditions. Rollers represent the symmetry boundary condition on the top
edge. The left edge is fixed. A level-set is defined initially in the middle, at the interface between ROS and air. A no-slip boundary condition is imposed at the bottom edge corresponding to the platen interface.
Figure 3: a) Instrumented hot press. (1) MTS compressive fixture. (2) Ball-bearing die set to ensure
alignment. (3) H13 steel 100mm x 100mm platens (4) 500W Heating cartridges. (5) Cooling channels using compressed air. (6) A ceramic layer ensures thermal insulation. (7) A picture frame is used to restrict the flow to 1D (8) Material placed inside the mould. b) The 50mm x100mm sample covers half of the mould cavity.
25
Figure 4: Temperature distribution measured experimentally across the thickness of a sample during the
squeeze flow test
Figure 5: Comparison of sample height model prediction and experimental measurements for medium
strands. The model is accurate to predict the final sample height. 0 50 100 150 200 250 300 350 400 450 0 5 10 15 20 25 30 35 T em pe ra ture (° C)
Time (min)
Middle TC
Top TC
Bottom TC
26
Figure 6: Numerical prediction of the flow interface position at different times for a closing force of 5kN
with small strands. In this case, the mould cavity is almost filled with ROS after approximately 300s for the given case shown here.
Figure 7: Flow front position during the first two seconds for small, medium and large strands for the 5 kN
27
Figure 8: Comparison of sample height model prediction and experimental measurements for small strands.
The viscosity and the yield stress values are lower for small strands.
Figure 9: Load vs. final strain for experimental results and model prediction. A maximum of 50% strain was
28
Figure 10: Newtonian test case. Sample height versus time predicted using the finite element method
presented in this paper, and evaluated with the analytical model under the lubrication assumption. 4 4.5 5 5.5 6 6.5 7 0 10 20 30 40 50 60 S amp le H ei gh t (mm) Time (s) Analytical FEM
29
Table 1 - Experimental test matrix
Strand size Strand Length (mm) Strand Width (mm) Applied Load (kN) Large 25.4 6.35 2.5, 5, 10 Medium 12.7 3.18 2, 5, 10 Small 6.35 3.18 1, 2, 5
Table 2 – Material properties obtained for the three strand sizes.
Parameter Small Strands Medium Strands Large Strands
Viscosity 𝜂! (kPa-s) 8 30 42