Université de Montréal
Functional Neuroanatomy of Visual Pathways
Involving the Pulvinar
par Reza Abbas Farishta
École d'optométrie Faculté de Médecine
Thèse présentée
en vue de l’obtention du grade de Doctorat (PhD) en Science de la Vision
option Neurosciences de la Vision et Psychophysique
Cette thèse intitulée :
Functional Neuroanatomy of Visual Pathways Involving the Pulvinar
Présentée par: Reza Abbas Farishta
A été évaluée par un jury composé des personnes suivantes
Dr. Jean-François Bouchard Président-rapporteur Dr. Christian Casanova Directeur de recherche Dr. Stéphane Molotchnikoff Membre du jury Dr. Martha Bickford Examinateur externe
Résumé
Les neurones du cortex visuel primaire (V1) peuvent emprunter deux voies de communications afin d’atteindre les aires extrastriées : une voie cortico-corticale, et une voie cortico-thalamo-corticale à travers des noyaux thalamiques de haut niveau (HO) comme le pulvinar. Les fonctions respectives de ces deux voies restent toujours méconnues. Un pas vers une meilleure compréhension de celles-ci seraient d’investiguer la nature des signaux qu’elles transmettent. Dans ce contexte, deux grands types de projections cortico-thalamiques (CT) ont été identifiés dans le système visuel : les neurones de type I (modulator) et type II (driver) caractérisés respectivement par des axones minces dotés de petits boutons terminaux et par des axones plus épais et de plus grands boutons respectivement. Une proposition récente a aussi émis l'hypothèse que ces deux types pourraient également être distingués par leur expression de transporteur de glutamate vésiculaire. Cette hypothèse suggère que les projections de type II et de type I peuvent exprimer sélectivement VGLUT2 et VGLUT1, respectivement (Balaram, 2013; Rovo et al, 2012).
Chez le chat, les projections de V1 vers le pulvinar se composent principalement de terminaux de type II, tandis que celles de l’aire PMLS présentent une combinaison de terminaux de type I et II suggérant ainsi que, la proportion de terminaux de type I augmente avec le niveau hiérarchique cortical des zones visuelles. Afin de tester cette hypothèse, nous avons cartographié la distribution des terminaux CT du cortex AEV (article 1) ainsi que de l’aire 21a (article 2). Nous avons aussi étudié l’expression de VGLUT 1 et 2 dans le système visuel du chat afin de tester si leurs expressions corrèlent avec les sites de projections de neurones de
Nos résultats indiquent que la grande majorité des terminaux marqués dans le pulvinar provenant de l’AEV et de l’aire 21a sont de type I (Article 1 et 2) alors que ceux de V1 sont majoritairement de type II. Une comparaison de la proportion des projections de type I à travers les aires V1, PMLS, 21a et AEV révèlent une corrélation positive de sorte que celle-ci augmente avec le degré hiérarchique des aires visuelles. De plus, nos résultats indiquent que VGLUT 1 et 2 présentent une distribution complémentaire et que leur localisation dans des sites connus pour recevoir une projection de type ‘modulateur’ et ‘déclencheur’ proéminente suggère que leurs expressions peuvent montrer un biais pour celles-ci dans la voie géniculo-strié.
Les résultats de cette thèse ont permis de mieux connaitre la nature des projections CT des aires visuelles extrastriées. Ces résultats sont d’autant plus importants qu’ils établissent un lien entre la nature de ces projections et le degré hiérarchique des aires visuelles, suggérant ainsi l’existence une organisation anatomofonctionnelle des voies CT passant par le pulvinar. Enfin, les résultats de cette thèse ont aussi permis une meilleure compréhension des vésicules VGLUT 1 et 2 dans le système visuel du chat et leurs affinités respectives pour les sites de projections de neurones de type I et II.
Abstract
Visual signals from the primary visual cortex (V1), can take two main communication routes in order to reach higher visual areas: a corticocortical pathway and a cortico-thalamo-cortical (or transthalamic) pathway through high-order thalamic nuclei such as the pulvinar. While these pathways are receiving an increasing interest from the scientific community, their respective functions still remain largely unknown. An important step towards a better understanding of these pathways would be to investigate the nature of the signals they transmit. In this context, two main types of corticothalamic (CT) projections have been identified in the visual system: type I projections (modulators) and type II (drivers) characterized respectively by thin axons with small terminal and by thicker axons and larger terminals. A recent proposal has also hypothesized that these two types can also be distinguished by their expression of vesicular glutamate transporter (VGLUT) in their respective synaptic terminals such that type II (driver) and type I (modulator) projections can selectively express VGLUT 2 and VGLUT 1, respectively (Balaram, 2013; Rovo et al, 2012).
In cats, projections from V1 to the LP-pulvinar are mainly composed of type II terminals, while those from the Posteromedial lateral suprasylvian (PMLS) cortex present a combination of type I and II terminals. This observation suggests that, in higher-order (HO) thalamic nuclei, the proportion of type I terminals increases with the hierarchical level of the visual areas. To test this hypothesis, we charted the distribution of CT terminals originating from the Anterior EctoSylvian visual cortex (AEV) (article 1) and from area 21a (article 2). We also studied the expression of VGLUT 1 and 2 in the cat's visual system in order to test whether their expressions correlate with the projection sites of type I and II axon terminals (article 3).
Our results from article 1 and 2 indicate that the vast majority of terminals sampled in the pulvinar from the AEV and area 21a are of type I while projections from V1 projections to the pulvinar were mostly composed of type II terminals. A comparison of the proportion of type I projections across areas V1, PMLS, 21a and the AEV revealed a positive correlation such that its proportion increased with the hierarchical rank of visual areas.
Our results also indicate that VGLUT 1 and 2 have a complementary distribution pattern which matches prominent projection of type I and II respectively in ascending visual projections but does not in extra-geniculate pathways involving the pulvinar (Article 3).
Taken together, results from this thesis have allowed a better understanding of the nature of cortico-thalamic projections originating from extra-striate visual areas (21a and AEV). These results are all the more important in that they establish a link between the nature of these projections and the hierarchical degree of their cortical area of origin, thus suggesting that there is a functional organization of CT pathways passing through the pulvinar. Finally, results of this thesis also enabled a better understanding of the expression of VGLUT 1 and 2 in the visual system and their possible respective biases for type I and type II projections.
Table of contents
Résumé ... iii
Abstract ... v
Table of contents ... vii
Liste of Tables ... ix
Liste of Figures ... x
Abbreviations ... xii
Acknowledgements ... xiii
Introduction ... 1
1. The Corticocentric view of neural processing ... 1
1.1 An overview ... 1
1.2 Neural processing of visual information ... 2
1.2.1 Visual pathways en route to the cortex ... 3
1.2.2 Receptive field properties ... 6
1.2.3 Modular organization of visual the cortex ... 12
1.3 Processing beyond V1 ... 17
1.3.1 Cortical hierarchy ... 17
1.3.2 Visual Streams ... 19
2. The Thalamus, more than just a relay ... 24
2.1 Transthalamic pathways and Higher order Nuclei ... 26
2.2 Drivers and Modulators ... 28
2.2.1 Overview and definition ... 28
2.2.2 Differentiating criteria ... 29
2.2.3 Driver and Modulator in the visual system ... 33
2.2.4 Vesicular glutamate as a possible anatomical correlate ... 34
2.2.5 Beyond a strict driver/modulator framework ... 37
3. The Pulvinar ... 38
3.1 An overview of the pulvinar ... 38
3.2 The Cat pulvinar ... 39
3.2.1 Anatomical connectivity of cat pulvinar ... 40
3.2.2 Functional relationship between the visual cortex and the pulvinar ... 42
4.2 Thalamocortical circuits in cognition and cortical synchrony ... 47
4.3 The pulvinar: a facilitator and integrator of visual information ... 48
5. Objectives and hypothesis ... 49
3.1 Article 1: Distribution and Morphology of Cortical Terminals in the Cat Thalamus from the Anterior Ectosylvian Sulcus ... 51
3.2 Article 2 : Hierarchical Organization of Corticothalamic Projections to the Pulvinar .... 90
3.3 Article 3 : Distributions of Vesicular Glutamate Transporters 1 and 2 in the Visual System of The Cat ... 131
6. Discussion ... 163
6.1 Summary of results ... 163
6.2 Methodological and technical considerations ... 165
6.3 Function Implications ... 167
6.4 CT projections and visual hierarchy ... 171
6.4.1 Corticopulvinar projections: striate vs extra striate areas ... 171
6.4.2 Is there a hierarchy of CT projections in the pulvinar? ... 173
6.5 VGLUT 2 as a possible marker of ascending driver projections ... 175
6.6 Future directions ... 180
6.6.1 Functional impact of area 21a projections to the pulvinar ... 180
6.6.2 CT projections in other systems and corticotectal pathways ... 182
6.6.3 The role of tectopulvinar inputs and thalamic integration of sensory signals .. 184
6.6.4 VGLUT immunolocalization in extra-geniculate pathways ... 186
7. Conclusion ... 187
8. References ... 190
Liste of Tables
Table 1. Main properties of driver and modulator projections (Sherman, 2017). ... 30
ARTICLE #1
Article 1. Table 1. Stereological sampling data. ... 80 Article 1. Table 2. Percentage of thalamic terminal types according to their cortical origin. .. 82
ARTICLE #2
Article 2. Table 1. Stereological sampling parameters ... 128 Article 2. Table 2. Percentage of cortical terminal types ... 129 Article 2. Table 3. Percentage of cortical terminal types ... 130 ARTICLE #3
Liste of Figures
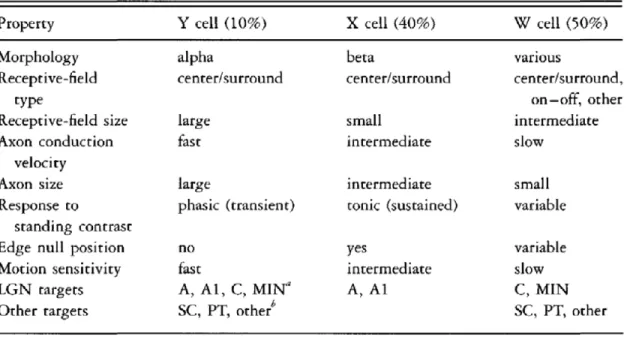
Figure 1. Classification of RGC’s from the cat retina based on anatomical and functional properties. From An introduction to the biology of vision, James T. McIlwain, 1996. ... 4 Figure 2. Center-surround organization of RGC’s where On- and Off-cells are seen to respond differently when stimulated in their preferred center/surround zones through distinct stimulus patterns; taken from Principles of Neural Science, fifth edition. ... 8 Figure 3. A representation showing the spatial organization and responses of a simple cell from area 17 of the cat bearing a rectangular shape with a middle excitatory subregion flanked by two inhibitory ones; from Visual Perception, a clinical orientation, Steven H. Schwartz, 2010. ... 9 Figure 4. Representation of different spatial organization of simple cells from area 17 of the cat with distinct excitatory and inhibitory flanks. (from Visual Perception, a clinical orientation, Steven H. Schwartz, 2010) ... 10 Figure 5. Drawing showing the emergence of area 17 simple cell RF properties from LGN cells, from (Payne and Peters 2002). ... 11 Figure 6. Spatial organization of complex cell compared to simple cell, where on and off responses are seen for each position in the RF taken from Principles of Neural Science, fifth edition, Kandel et al, 2013. ... 12 Figure 7. Representation of the retinotopic organization of area 17 and 18 for vertical and horizontal axis, from (Payne and Peters 2002). ... 13 Figure 8. Original figure from (Bonhoeffer and Grinvald 1991). Using optical imaging of intrinsic signals, this was the first study to describe the pinwheel like structure of orientation columns. ... 15 Figure 9. Original figure from (Hubel, Wiesel et al. 1978) showing alternate bands of ocular projection in layer IV of the macaque visual cortex following ocular injection of radioactive proline. ... 16 Figure 10. Hierarchical organization of visual areas based on laminar projection patterns of corticocortical connections in the cat; from (Scannell, Blakemore et al. 1995). ... 19 Figure 11. Diagram showing conventional view (corticocortical) and alternative view of cortical communication, C.Casanova. ... 28 Figure 12. Morphology of type II (left) and type (I) CT axon, Sherman and Guillery, MIT Press 2006. ... 31 Figure 13. Example of a coronal section stained with AChE used to identify thalamic subregions, adapted from Huppé-Gourgues et al, 2019. ... 40
ARTICLE #1
Article 1. Figure 1. Injection localization and pulvinar chemo architecture. ... 83 Article 1. Figure 2 Topographical representation of axon terminals in the thalamus (AES 1 and 3). ... 84
Article 1. Figure 3 Topographical representation of axon terminals in the thalamus (AES 5 and
6). ... 85
Article 1. Figure 4. Corticothalamic projection fields. ... 86
Article 1. Figure 5. Terminal fields in the thalamus following AES injections. ... 87
Article 1. Figure 6. Proportion (%) of terminal types according to their cortical origin and thalamic targets. ... 88
Article 1. Figure 7. Retrogradely labbeled cells in the AEV following injection in the pulvinar. ... 89
ARTICLE #2 Article 2. Figure 1. Injection site for cortical area 21a ... 121
Article 2. Figure 2. Projection sites in the LP-pulvinar from CT axons of area 21a ... 122
Article 2. Figure 3. Labelled terminals in the LP-pulvinar following injections in area 21a . 123 Article 2. Figure 4. Terminal morphology of CT axons from area 21a and 17 ... 124
Article 2. Figure 5. Distribution of bouton size of CT projections ... 125
Article 2. Figure 6. Percentage of terminal types from CT of area 17 and 21a ... 126
Article 2. Figure 7. The organization of CT terminals varies according as a function of cortical hierarchy ... 127
ARTICLE #3 Article 3. Figure 1. Visualization of the visual thalamus of the cat ... 158
Article 3. Figure 2. Expression of VGLUT 1 and 2 in the LGN ... 158
Article 3. Figure 3. Expression of VGLUT 1 and 2 in the LP-pulvinar ... 159
Article 3. Figure 4. Expression of VGLUT 1 and 2 in the superior colliculus ... 159
Article 3. Figure 5. Expression of VGLUT 1 and 2 in area 17 ... 160
Article 3. Figure 6. Summary of VGLUT 1 and 2 expression in the visual system of the cat ... 161
Abbreviations
AchE: Acethylcholinesterase AEV: Anterior ectosylvian area
AMPA: α-amino-3-hydroxy-5-methyl-4-isoxazolepropionic acid LGN: Lateral geniculate nucleus
LP: Lateral posterior nucleus LPl: Lateral part of LP LPm: Medial part of LP MT: Middle temporal area
NMDA: N-Methyl-D-aspartic acid
PMLS: Posteromedial lateral suprasylvian cortex RF: Receptive field
RGC : Retinal Ganglion Cell SEM: Standard error of the mean
TEO: Posterior part of the inferotemporal cortex
V1, V2, …: cortical visual areas (primary, secondary...) XC: Extra striate cortex
Acknowledgements
This may sound very cliché, but in these few years during which I completed this PhD thesis, there have been many moments (more like weeks and months…) when I thought about quitting. Those moments were at their peak when in 2013, after two and half years of continuously trying to replicate some preliminary results, Christian called me in his office to tell me that, despite how much he valued my talent and passion for vision sciences, he wouldn’t be able to let me continue without results for much longer. He gave me one last shot at a project, and should it fail, I would have to quit for my own sake. I carefully listened to the project and to his instructions and effectively started another PhD project, from scratch, almost three years after I had joined the PhD program.
You may now begin to understand how I feel writing these words of acknowledgements, words I never thought I would be able to write for the longer part of my PhD. And since we have to give credit where it is due, I would like to officially start by thanking my supervisor, Dr. Christian Casanova.
Christian has been so instrumental in shaping who I am today, both as a person and as a scientist that I cannot be grateful enough to have had him as a supervisor. He welcomed me in his lab when I had no credential to do graduate studies in fundamental sciences let alone to work on such a tricky subject as the pulvinar. He believed in my potential and nurtured it with trust and guidance. I have always admired his capacity to see in his students, a potential that they may themselves fail to see. I have found in him a great mentor who also guided me in my academic career choices and whose insight and vision I will always cherish. Thank you, Christian, for
everything, I owe you more than I can say. I would like to also thank Chantal Mclean, who always made sure I was able to meet Christian despite his busy schedule.
Next in line is Dr. Matthieu Vanni, who is now a professor at the School of Optometry but was a PhD student when I joined the lab. While Christian welcomed me, Matthieu is the one who trained me on the ground. I have hardly met someone as gentle and humble yet as brilliant as him. Unfortunately, in the academic world, success more often than not, brings about arrogance, but I have never witnessed even an ounce of such boasting in him and I am really grateful to have been trained by such a patient friend.
I also want to thank Dr. Sebastien Thomas, our former lab manager who always pushed for me to do more and motivated me in tougher times. Your rigour and discipline were instrumental in getting the best out of me.
I also want to specifically thank Dr. Denis Boire, who effectively, ‘co-supervised’ me for my anatomical work. Denis spent countless hours with me in the lab, showing me how to count boutons and maneuver the microscope. His detail-oriented personality has been instrumental in the quality of my results. I am truly grateful for the time he spent to train me and supervise me in my doctoral work.
I would like to thank Geneviève, for always making sure we had what we needed in the lab, Karine Minville for having introduced me to animal surgical techniques; my lab members and colleagues, Hadjer, Nawal, Bruno C, Bruno O, Laurent, Azadeh, Nelson, Visou, William, Marianne, Olivia, Alexandre, Samuel, Thomas, Robyn, Jun, Julie and Jeoren as well as other
summer interns. A special mention for my dear friend Umit, whom we all miss very much. I have truly enjoyed our conversations and lab meeting discussions. Thank you for having made work so pleasant.
I would like to also thank the faculty members of the school of optometry. In particular Jean-François Bouchard, who co-supervised me for my masters’ project, Olga Overbury, PhD program supervisor and Dr. De Guise associate dean for the O.D program. Your support during this O.D/PhD marathon has been really important to me.
Many thanks to all agencies who helped financially during my thesis, especially the Faculté des études supérieures et posdoctorales, Réseau de recherche en santé de la vision, and the American Academy of Optometry Foundation for the Ezell fellowship they awarded me in 2019. Special thanks to my work colleagues and friends at Newlook Vision Group, especially Caroline Rouleau and Ingrid Tremblay for having always accommodated my PhD commitments and teaching workload.
Finally, before I jump to personal acknowledgments, I would like to thank all my previous teachers, from elementary school to high-school, those from my university years in France and all other mentors who have helped become who I am. I cannot name you all, but if you ever happen to read this thesis, you very well know who you are!
On the personal side, I should start by thanking my parents for what they did for me. They left Pakistan in the 80’s to give me and my siblings a better future, struggled for years to become
seen him take holidays for himself, so that we could live a normal life. And my mom, always making sure we did well at school, struggling to talk to our teachers in a language so foreign to her. To my parents I want to say, this a gift for you. For all your selflessness and sacrifice, your love and dedication.
I want to thank my siblings, my father and mother in law and close friends for having believed in me throughout my journey, always coping with my busy schedule. Your support has been critical in making this journey a pleasant one.
I would like to single out one person, who has helped me in my personal life, more than I could ever imagine: Dr. Sheikh Mohammad Ali Shomali, professor of philosophy and Islamic studies. Dr. Shomali has been a father figure to me ever since I met him, answering my countless existential questions and has shown to me in action, the meaning of patience and grace. Thank you, professor, for seeing the best in me, always.
Last but not least, I would like to thank my wife and life companion, Butool, for sacrificing and giving up so much, especially from her own time that she wished we would spend together, for me to work on my PhD. Her love, dedication, and belief in myself have been so important during my PhD especially when writing my thesis that she deserves most of the credit for the work I was able to do. I cannot conclude this section of acknowledgements without mentioning my 8-week-old daughter, Amina Kawthar. She probably will never remember her father’s PhD struggle, but I do look forward for the day when we can read these lines together.
Asking those who know. What I learnt from a congregation of Greats1.
Should I pursue knowledge or the comfort of a wealthier lifestyle?
Ali : [I will answer this one.] “Knowledge. Knowledge is better than wealth for knowledge guards you while you guard wealth; wealth is reduced by spending whereas knowledge increases by sharing (teaching). The treasurers of wealth perish during their own lifetimes, whereas the knowledgeable ones remain alive for all time, their individual selves may pass away, but the likes of them continue to remain in the hearts.”2
Socrates : I agree with Ali, one should“Prefer knowledge to wealth, for the one is transitory, the other perpetual.” 3
Where does the journey of knowledge begin?
Muhammad: Seek it in yourself. “One [only] has to question. The question is half of knowledge4.
What is so unique about the pursuit of knowledge?
Ali: Knowledge has many benefits, but it suffices to say that ‘Every container becomes cramped by what is placed therein, except the container that holds knowledge, for verily it expands because of it.’1
And where shall I seek this knowledge from, How should I choose the right teacher?
Nikos: A true teacher does not need an introduction. “True teachers are those who use themselves as bridges over which they invite their students to cross; then, having facilitated their crossing, joyfully collapse, encouraging them to create their own.”5
Should I find such a teacher, how should I regard him in my life?
Ali: ‘It is [your] teacher’s right upon you that you greet people in general as a whole but single him out with your greeting, […] nor insist for him to continue if he is tired, nor show disinclination at the length of his speech, for verily it [i.e. his speech] is as a palm tree from which you [should] anxiously wait for something to fall from it for you.’2
1 It is customary to begin a thesis with a quote. I couldn’t pick only one that has truly inspired me. A collection seemed more appropriate.
Sadiq: ‘The right of the one who trains you in knowledge is to magnify him, to frequent his sessions, to listen to him attentively, and to attend to him with devotion. You should not raise your voice to him, nor answer a question that someone has asked him about something. […] You must defend him if anyone ever speaks ill of him in your presence, conceal his faults and publicise his virtues.6
What is the role of reason, in the pursuit of knowledge?
Gautama: “Do not believe in anything simply because you have heard it. Do not believe in anything simply because it is spoken and rumored by many. Do not believe in anything simply because it is found written in your religious books. Do not believe in anything merely on the authority of your teachers and elders. Do not believe in traditions because they have been handed down for many generations. But after observation and analysis, when you find that anything agrees with reason and is conducive to the good and benefit of one and all, then accept it and live up to it.”7
What if this (PhD) journey seems to become endless?
Leo: “A man on a thousand-mile walk has to forget his goal and say to himself every morning, 'Today I'm going to cover twenty-five miles and then rest up and sleep.”8
There are no cells I can find in the pulvinar, and it’s been a long day. Any thoughts? Fyodor: Step out, for ‘It is amazing what one ray of sunshine can do for a man!”9
Where does inspiration come from?
Leo: From everything that is around you. “If I were asked for the most
important advice I could give, that which I considered to be the most useful to the men of our century, I should simply say: in the name of God, stop a moment, cease your work, look around you.” 10
Any thought, Arhur?
Arthur. I agree with Leo. “For where did Dante get the material for his Hell, if not from this actual world of ours?”11
6 Jaʿfar ibn Muḥammad aṣ-Ṣādiq (700-765 CE), Treatise of rights. 7 Gautama Buddha (480-400 BCE), Kalama Sutta
8 Leo Tolstoy (1828-1910), War and Peace
9 Fyodor Dostoesky (1821-1881), Humiliated and Insulted 10 Leo Tolstoy, Essays (1828-1910, Letters and Miscellanies
What is the role of literature in life?
Socrates: Read, and ‘“Employ your time in improving yourself by other men's writings so that you shall come easily by what others have labored hard for.” 12 Is reading enough?
Epictetus: “Don't just say you have read books. Show that through them you have learned to think better, to be a more discriminating and reflective person. Books are the training weights of the mind. They are very helpful, but it would be a bad mistake to suppose that one has made progress simply by having internalized their contents.” 13
So, knowledge, is more than knowing facts?
Ibn Sina: Absolutely, for ‘The knowledge of anything, since all things have causes, is not acquired or complete unless it is known by its causes.’14 And about Ignorance, where does this path lead to?
Averroes: "Ignorance leads to fear, fear leads to hate, and hate leads to violence. This is the equation."15
And where does Yoda’s dark side fit16 in this equation? The congregation: Silent (in synchrony). What is the source of ultimate joy?
Anonymous voice: “There is no joy in the finite; there is joy only in the Infinite.”17”
You mean, my morning espresso shot is not real pleasure?
Vyasa: “Pleasures conceived in the world of the senses have a beginning and an end and give birth to misery.”18
12 Socrates (470-399 BCE)
13 Epictetus (50-135 CE), The Art of Living: The Classical Manual on Virtue, Happiness and Effectiveness 14 Avicenna (Ibn Sina) (980-1037), On Medicine
On est au Québec icite, un mot en Français?19
Antoine :“On ne voit qu’avec le cœur, l’essentiel est invisible pour les yeux.20
I need to start the actual thesis, any last word, about meeting The Beloved?
Saadi: When you meet the infinite being, you can always use my words: “I was planning to tell you my sorrows when we meet; But no sorrow would remain upon meeting with you.”21
Does the Beloved Himself want to add anything?
“O soul at peace! Return to your Lord, pleased, pleasing! Then enter among My servants! And enter My paradise!’22
19 English translation : We are in Quebec here, anything to say in French?
20 Antoine de Saint-Exupéry (1900-1944), Le Petit Prince. Translation : It is only with the heart that one can see rightly; what is essential is invisible to the eye”
Introduction
This introductory chapter will give the reader some background information about the cortex and the thalamus and will raise questions relevant to the subject of this thesis. It will review the anatomy and functional relationship of the visual cortex and the thalamus. The first part will mostly describe what we know about these two and their classically attributed role. The second part will put forth some pending questions on the organization of cortico-thalamic interactions. The third part will properly introduce research questions studied during this doctoral work.
1. The Corticocentric view of neural processing
1.1 An overview
Sensory systems are generally organized in a hierarchical manner from an anatomical and functional standpoint with a certain homogeneity observed across mammals (Kandel 2013). In the visual system for instance, the system on which this thesis is centered, it is conventionally considered that signals coming from the retina, after a brief relay at the level of the lateral geniculate nucleus (LGN) in the thalamus, are transmitted to the primary visual cortex where basic computations occur en route to higher areas where more complex features of the visual scenery is analysed (Casanova 2004).
In this classical understanding of visual (and more generally, sensory) processing, relevant neural information is transmitted across different hierarchically organized and distinct
characteristic of the visual scenery. In this cortico-centric view of neural processing, most, if not all neuronal analysis leading to perception and action are based on computations within and across cortical areas through direct cortico-cortical connections (Salin and Bullier 1995).
Applying this model to the cat visual system, which is the animal model studied in this thesis, the flow of visual information processing could be simplified as follows: the retina, lying in the fundus of the ocular globe transforms photons into an electrical signal, conveyed through retinal ganglion cells (RGCs) projecting to the LGN in the thalamus. Neurons from the LGN in turn project to the primary visual cortex (V1 or area 17) to layer 4 where preliminary computation for the analysis of contrast, orientation, spatial frequency occur. Information processed in V1 is then transferred through direct cortico-cortical connections to other areas, including V2 and V3 (area 18 and 19 in the cat) from where visual processing mainly follows two neural streams : the dorsal stream, also known as the where pathway and implicated in the processing of spatial information; and the ventral stream, more concerned with the processing of object recognition (Mishkin and Ungerleider 1982).
While this is a brief overview of the sequential manner in which visual processing occurs, it is important to highlight that in this understanding, the LGN in the thalamus where retinal signals first synapse when leaving the optic chiasma is seen a ‘simple’ relay and do not actively take part in the processing of visual information.
1.2.1 Visual pathways en route to the cortex
Effectively, visual processing begins at the retina, a multilayered sensory neural circuit whose main function is to absorb light and convert it into a neural signal, a process known as phototransduction.
After phototransduction happens at the level of photoreceptors, transduced signals are then passed synaptically to other vertically arranged cells forming the retina, namely the bipolar and the retinal ganglion cells (RGC); signals from the RGC’s are sent to subcortical structure, leaving the retina through the optic nerve. In addition to this vertical pathway, important lateral connections are also provided by horizontal cells and amacrine cells (Kandel 2013).
Even if the bulk of processing of visual signals is classically attributed to the cortex, some degree of analysis and segregation of signals happen in the retina. Indeed, the very existence of different functional types of RGC’s, each one of them bearing distinct RF properties and giving rise to distinct projecting pathways is a testament of this fact. In the cat, three types of RCC’s have been described: W, X and Y cells (Figure X).
Figure 1. Classification of RGC’s from the cat retina based on anatomical and functional properties. From An introduction to the biology of vision, James T. McIlwain, 1996.
As can be seen in the figure W, X, Y, cells types are differentiated based on their electrophysiological responses, morphology, and projecting layer in the LGN. For instance RGC’s from the Y pathway exhibit mainly a phasic response to standing contrast, while responses from the X pathway are tonic (Enroth-Cugell and Robson 1966). The functional segregation of these pathways can also be appreciated when comparing the RF size of their constituents RGC’s: X cells exhibit small RF’s, have slower axon conduction and are therefore involved in the processing of fine details. On the other hand, Y cells exhibit larger RF with faster responses making them more suitable for motion detection (Casanova 2004). W cells are the least studied of the three subtypes. They responses exhibit a greater variability
and project more heavily to the midbrain (Kaplan 1991). This functional segregation of RGC fibers have also been reported in the primate where M, P and K fibers differentiated based on their physiological responses and morphology are seen projecting in their respective layers of the LGN (Kaplan 2013).
From the retina, the majority of RGC’s will project to the LGN in the thalamus, before projecting to the visual cortex. In the cat, the LGN is located dorso-laterally and is divided in two main anatomically distinct regions, the smaller ventral lateral geniculate and a more prominent dorsal lateral geniculate. Both these regions are comprised of several layers and receive distinct projections from the retina: the dorsal part of the LGN is divided into three layers, A, A1 and Cm; layers A and A1 receive X and Y signals (Blake 1979); Cm only receives Y signals (Wilson, Rowe, &Stone, 1976). The ventral portion of the LGN is also comprised of three layers, C1, C2 and C3. The ventral portion of the LGN is mainly innervated by W cells (Spear, Smith et al. 1977).
The segregation of inputs in the LGN is not only restricted to distinct functional pathways. There is also a segregation based on ocular inputs in each laminae of the LGN such that layers A, C, and C2 receive projections from the contralateral nasal retina while layers laminae A1 and C1 are mainly innervated by the ipsilateral temporal retina (Sherman 1993).
A similar organization is also present in the primate visual system. The LGN of the macaque is also organised through multiple layers (six), each one of them receiving inputs from
parvocellular layers and receive visual input from the P-pathway, whereas the dorsal most two layers are known as the magnocellular layers which receive inputs from the M pathway. In the macaque, cells forming koniocellular pathway project to the interlaminar spaces of geniculate layers (Kaplan 2013).
Not all the RGC’s project to the LGN; a significant number of cells also project to the midbrain, towards the superior colliculus, a structure critically involved in oculomotor function. The proportion of the retinotectal projection differs across species (May 2006). They constitute approximately 70% of RGC’s in the mouse (Hofbauer and Drager 1985), 50% in the cat (Wassle and Illing 1980) and only 10% in monkeys (Perry and Cowey 1984).
1.2.2 Receptive field properties
In the visual system, the receptive field (RF) a neuron is a region of the visual space where light stimulation excites or inhibits the recorded cell (Kandel 2013). Visual neurons are not only concerned with the spatial location of a stimuli; they are also selective for other properties, such as color, motion, contrast, all of which define the properties of a given visual RF (Purves 2018).
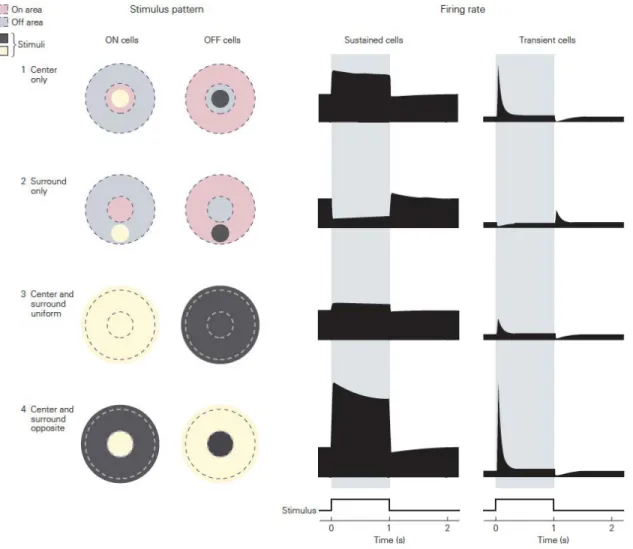
At the level of the retina, our knowledge of RF properties of RGC’s is largely attributed to pioneer work undertaken by Stephen Kuffler who characterized the responses of single ganglion cells in the cat retina (Kuffler 1953). Based on electrophysiological recordings, he distinguished two classes of ganglion cells whose RF were organized in two concentric regions bearing opposite responses to light described as the center-surround organization: the
ON and OFF-center; RF with ON-centers respond to light increment on the central part of their RF, but when light is projected in their surrounding region, their firing activity is reduced. For OFF-centered RGC’s the exact opposite is true in that, they are excited with increment of light in their surround, and inhibited if the same light is shown on the center of their RF (see Figure 2).
RF properties in the LGN closely resemble those from their projecting RGC’s. They are also concentrically organized, with both ON-center and OFF-center types (Hubel and Wiesel 1961). A notable difference between RF properties of ganglion cells and the LGN is that a greater inhibitory surround mechanism has been observed at the thalamic level, contributing to a greater sensitivity for LGN neurons to increment of luminance gradients exerts a greater (Hammond 1973).
Figure 2. Center-surround organization of RGC’s where On- and Off-cells are seen to respond differently when stimulated in their preferred center/surround zones through
distinct stimulus patterns; taken from Principles of Neural Science, fifth edition. .
RF properties undergo a major change from the LGN to the cortex, where cortical cells do not display a concentric organization, but a more rectangular one, making them more sensitive to lines and orientations (Figure 3). Cells from the primary visual cortex differ from those of the LGN in many ways: their RF are sensitive to orientation and can also encode the
true direction of a moving stimuli; they can be binocular and be sensitive to retinal disparity (Hubel 1988).
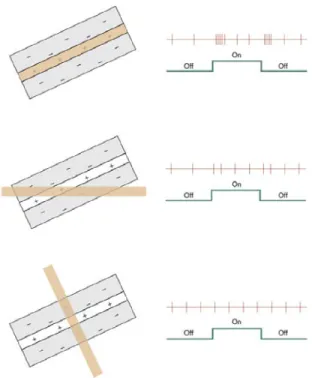
Figure 3. A representation showing the spatial organization and responses of a simple cell from area 17 of the cat bearing a rectangular shape with a middle excitatory subregion flanked by two inhibitory ones; from Visual Perception, a clinical orientation, Steven H.
Schwartz, 2010.
Two main types of cortical cells have been classically described by Hubel and Wiesel, simple and complex, both of them bearing distinct RF properties. Simple cells have been described as below in the authors original article (Hubel and Wiesel 1962):
“[The receptive fields of simple cells] were termed “simple” because like retinal and geniculate receptive fields (1) they were subdivided into distinct excitatory and inhibitory regions; (2) there was summation within the separate excitatory and inhibitory parts; (3) there was antagonism between excitatory
or moving spots of various shapes from a map of the excitatory and inhibitory areas.
As mentioned above, an important feature of the spatial organization of simple cells is that they are composed with relatively clear ON and OFF subregions located next to the other as can be seen in Figure 4.
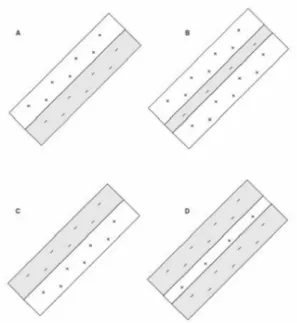
Figure 4. Representation of different spatial organization of simple cells from area 17 of the cat with distinct excitatory and inhibitory flanks. (from Visual Perception, a clinical
orientation, Steven H. Schwartz, 2010)
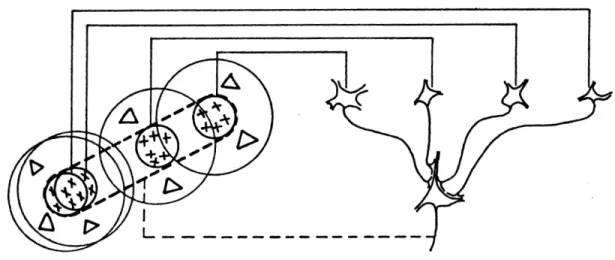
In their 1962 paper on RF properties of area 17 neurons, Hubel and Wiesel first proposed that the RF properties of simple cells of cat area 17 could be explained through an orderly organized set of projection from multiples thalamic afferents. According to their paper, the elongated subregions of cortical cells are built from the convergence of multiple geniculate cells whose receptive-field centers are aligned in a row conferring the rectangular shape of
the newly computed cortical RF (as shown in Fig X). Simple cells are mainly found in layer III, IV and VI (Payne and Peters 2002).
Figure 5. Drawing showing the emergence of area 17 simple cell RF properties from LGN cells, from (Payne and Peters 2002).
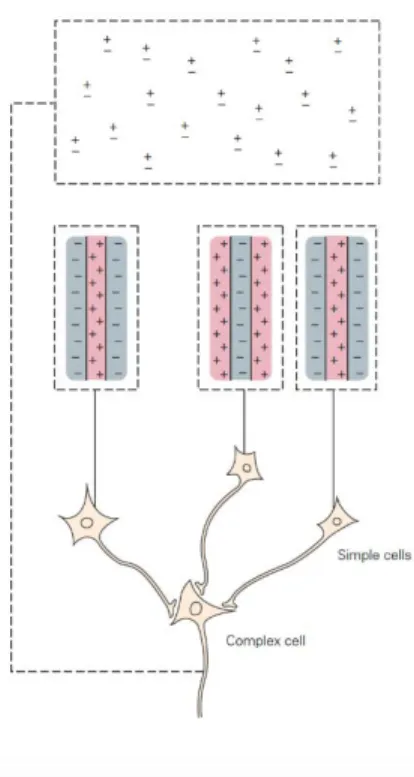
The other group of cells described by the authors were called complex. Complex cells are also tuned to orientation, most them to direction as well, but unlike simple cells, they have On and Off responses at each position making them less sensitive to the position of a stimulus within their RF (Figure 6). Complex cells are located in layer II, III and V.
Figure 6. Spatial organization of complex cell compared to simple cell, where on and off responses are seen for each position in the RF taken from Principles of Neural Science, fifth
edition, Kandel et al, 2013.
1.2.3 Modular organization of visual the cortex
Generally speaking, sensory cortices are organized in modality specific modules in which neighbouring neurons share common properties and are clustered together in order to facilitate sensory processing. In the visual system, this is translated into a precise modular organization of visual areas.
Like in the LGN for instance, the visual cortex is also organized in a retinotopic manner, defined as the two-dimensional representation of the visual field and is present in all mammals (Kaas 1997).
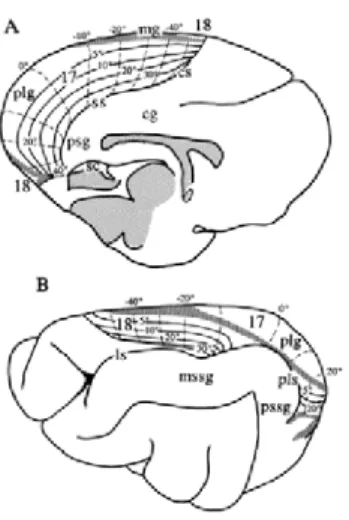
Earlier single cell recording studies (Palmer, Rosenquist et al. 1978, Tusa, Palmer et al. 1978, Albus and Beckmann 1980, Tusa and Palmer 1980) and more contemporary imaging techniques (Grinvald, Lieke et al. 1986, Schuett, Bonhoeffer et al. 2002, Kalatsky and Stryker 2003) have shown that, in the visual cortex, elevation is mostly represented in the antero-posterior axis, while the azimuth axis is represented in the medio-lateral one. Like in the LGN, the representation of the central visual field is amplified in that it occupies a greater cortical surface than the peripheral visual field (Figure 7).
Figure 7. Representation of the retinotopic organization of area 17 and 18 for vertical and horizontal axis, from (Payne and Peters 2002).
neurons had greater functional connections in vertical columns than they had through horizontal connections (De Lorente 1949). In their earlier observations, Hubel and Wiesel also reached similar conclusion when they realized that neighboring cells recorded within a single perpendicular descent shared the same orientation (Hubel and Wiesel 1962):
“Cells with common axis orientation were therefore not scattered at random through the cortex, but tended to be grouped together. The size and shape of the regions containing these cell groups were investigated by comparing the fields of cells mapped in sequence. It was at once apparent that successively recorded cells also tended to have identical axis orientations and that each penetration consisted of several sequences of cells, each sequence having a common axis orientation.”
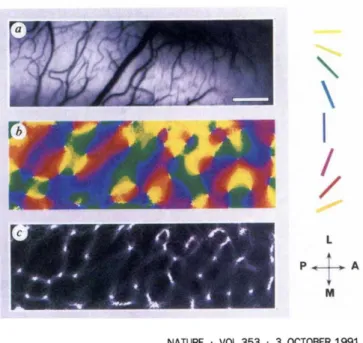
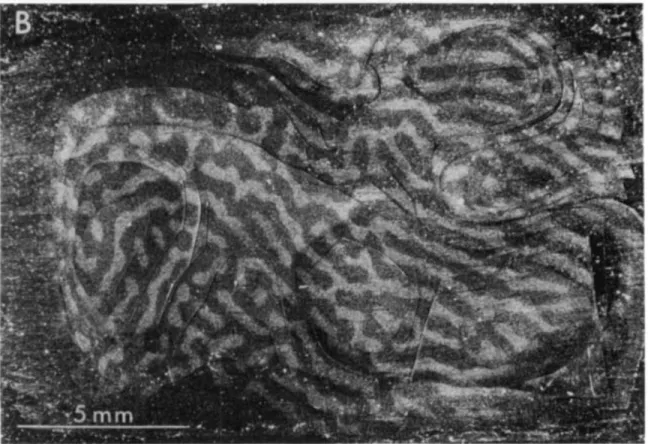
The organization of the visual cortex in orientation domain was further demonstrated using mesoscale imaging techniques (Grinvald, Lieke et al. 1986). These imaging techniques have greatly helped to further characterize the columnar organization of the visual cortex revealing for the first time that these iso-orientation columns are organized around 'orientation centers', producing pinwheel-like patterns (Figure 8) (Bonhoeffer and Grinvald 1991). This pin-wheel like organization of iso-orientation columns has also been describe for other extra-striate areas of the cat such as area 21a (Huang, Shou et al. 2006, Villeneuve, Vanni et al. 2009).
Figure 8. Original figure from (Bonhoeffer and Grinvald 1991). Using optical imaging of intrinsic signals, this was the first study to describe the pinwheel like structure of
orientation columns.
Another important feature of the visual cortex is its organization into columns of ocular dominance, a feature only present in cortical layer IV which receives direct geniculate afferents. Like orientation columns, this organization was first revealed through electrophysiological recordings (Hubel and Wiesel 1968, Hubel and Wiesel 1972) and confirmed with anatomical studies (Hubel, Wiesel et al. 1978) using radioactive deoxyglucose (Figure 9).
Figure 9. Original figure from (Hubel, Wiesel et al. 1978) showing alternate bands of ocular projection in layer IV of the macaque visual cortex following ocular injection of
radioactive proline.
A similar organization was also found in the cat visual system using electrophysical and anatomical (LeVay, Stryker et al. 1978, Cynader, Swindale et al. 1987) as well as optical imaging techniques (Bonhoeffer, Kim et al. 1995).
1.3 Processing beyond V1 1.3.1 Cortical hierarchy
There is more to vision than computations observed in the primary visual cortex, which is mainly involved in basic encoding while further processing takes place in more specialized extra striate areas. Indeed, the cat visual cortex is comprised by more than twenty hierarchically organized visual areas each one specialized in analysing a specific feature of the visual scenery. The prevailing view of cortical communication is that information transfer from lower visual areas to higher ones is carried through feedforward connections, while neurons from higher areas project back to areas of lower rank through feedback pathways (Salin and Bullier 1995, Casanova 2004).
This hierarchical understanding of neural processing was built upon anatomical observations that cortical projections in visual areas mostly follow a similar pattern (Felleman and Van Essen 1991, Markov, Vezoli et al. 2014) : projections from lower areas to extra striate (XC) areas originate from supragranular layers and project to their target areas in layer IV, on the other hand, projections from XC areas towards the primary visual cortex or more caudal areas mostly originate from infragranular layers and terminate outside of layer IV. Taking into account the laminar organization of geniculo-striate pathways, these observations suggest that ascending pathways from striate to XC areas are feedforward (FF) whereas, those from XC to lower areas are feedback (FB) (Salin and Bullier 1995, Markov and Kennedy 2013).
The analysis of these projection pattern enabled Felleman and Van Essen to propose a hierarchical model of visual areas in the primate brain (Felleman and Van Essen 1991), an exercise followed by (Scannell, Blakemore et al. 1995) who applied the same methodology to hierarchically ranked visual areas of the cat (Figure 10)
Figure 10. Hierarchical organization of visual areas based on laminar projection patterns of corticocortical connections in the cat; from (Scannell, Blakemore et al. 1995).
At the functional level, evidence suggest that there is also a hierarchical organization of the visual cortical area. The best evidence in support of this hierarchical processing comes from the observation that visual cells, from lower to higher visual areas, respond progressively to an increasing complexity of visual image properties such that higher ranked XC areas may exhibit sensitivity for complex stimuli that may be absent in lower areas (Felleman and Van Essen 1991, Ungerleider and Haxby 1994).
On the other hand, there is also evidence that in some instances, processing in the visual system follows a more parallel scheme in which areas located at a different hierarchical rank from an anatomical standpoint may exhibit at a functional level, an overlapping sensitivity for complex visual features (Hegde and Van Essen 2007). These results suggest that, at the functional level, visual processing does not always follow a hierarchical scheme and therefore, that it does not strictly follow the anatomical hierarchy flowchart of visual information (Hegde and Felleman 2007).
1.3.2 Visual Streams
As mentioned above, visual information flows from striate to extra-striate areas in a hierarchical and parallel manner along with a feedback pathway from higher to lower visual areas.
An important feature of the visual cortex in the context of cortical hierarchy and extra- striate processing is the presence of two functionally and relatively independent visual streams: the ventral pathway, also known as the ‘what’ pathway, associated with face, object and pattern recognition; and the dorsal pathway, also known as the “where” pathway, mainly associated with the processing of motion and spatial location of visual stimuli (Goodale and Milner 1992, Grill-Spector and Malach 2004, Schwartz 2010)
An important study providing critical evidence for the existence of these relatively independent functional pathways was undertaken by (Mishkin and Ungerleider 1982) where they observed that confined lesions to visual areas of the primate temporal cortex caused deficits in object recognition while lesions in the parietal cortex impaired spatial tasks. Similar conclusions were also reached in human studies where subjects were asked to selectively attend to the shape , color or speed of stimulus, a task which led to the activation of visual areas from functionally different pathways (Corbetta, Miezin et al. 1991).
Building on the two streams hypothesis by (Mishkin and Ungerleider 1982), Goodale and Milner (Goodale and Milner 1992) proposed that the ventral and dorsal stream theory may be better understood as different functional pathway each more concerned by perception or action. This understanding was based on evidence of a patient (patient DFF) presenting brain damage in the occipito-parietal region associated with object recognition or the ‘what’ pathway proposed by (Mishkin and Ungerleider 1982) who as expected, had difficulties recognize the shape and orientation of geometric shapes (in this case, the orientation of a slot). However, when the task was to insert a card inside the slot, patient DF performed it
adequately, placing the card in the correct orientation of the slot therefore suggesting that the neural substrates for the recognition of object stand in contrast to those that generate visually guided behavior (Goodale, Milner et al. 1991).
The existence of these two pathways has been recognized in primates but also in cat models. In the primate model, pathways located in the dorsal stream are mainly located in the occipito-parietal cortex. The main motion sensitive area involved in spatial localization of objects in the primate brain is MT, also known as the motion-sensitive area of the of the superior temporal sulcus (STS). From area MT, visual signals are sent forward for further processing to several other motion-sensitive areas within the STS, including area MST (Andersen 1997).
On the other hand, areas of the ventral stream are located in the occipito-temporal cortex and are implicated in the analysis of visual features including color, shape and more complex computations such as face and body recognition (Mishkin and Ungerleider 1982, Kravitz, Saleem et al. 2011). The gateway cortical area for object and form recognition in the primate brain is considered to be area V4 which sends visual signals to higher areas of the ventral streams including, area TEO (posterior, inferior temporal cortex). From V4 and TEO, visual information carrying cues critical for the analysis of object form, color, and texture is sent forward to area TE (anterior, inferior temporal cortex) and TEO which comprise the inferior temporal (IT) cortex (Ungerleider. 2013).
The functional segregation of visual areas into distinct streams has been also shown in the cat (Lomber, Payne et al. 1996, Lomber 2001). The dorsal stream of the cat is also involved in motion and visuo-motor function. Its motion sensitive are mainly located in the middle suprasylvian sulcus in the visuoparietal cortex and include area PMLS, identified as a possible homolog for primate area MT (Payne 1993). A deactivation of these areas leads to an inability of cats to detect motion and/or to orient themselves towards new stimuli (Lomber, Payne et al. 1996).
Areas of the ventral streams of the cat are located in the posterior suprasylvian (PS) cortex in temporal cortex. The gateway area involved in the ventral pathway of the cat is area 21a in the dorsal part of the posterior suprasylvian gyrus, and has been considered as an homologue of area V4 of the primate (Payne 1993). Its adjacent areas are areas 19 (medially and caudally), PMLS, VLS and 21b (Shipp and Grant 1991). Area 21a maintains cortico-cortical connections with most visual areas of the cat visual cortex, but receives its strongest input from area 17 and 18 which originate from supragranular layer III (Tusa and Palmer 1980, Shipp and Grant 1991, Scannell, Burns et al. 1999). Indeed, projections from area 17 are critical for response properties of area 21a cells as its cooling is known to significantly decrease its visual responses (Michalski, Wimborne et al. 1993).
Area 21 also maintains reciprocal projections with the LP-Pulvinar. Area 21a sends projections to both subdivisions of the LP (Abramson and Chalupa 1985, Abbas Farishta, Boire et al. 2020) while both subdivisions projects back to area 21a (Ratzlaff and Grinvald 1991). The retinotopic organization of area 21a only represent the central most part of the
visual field, covering about 20 degrees of visual axis (Tusa and Palmer 1980). Its receptive field are complex like, tuned for low spatial frequency, exhibit binocular summation and show selectivity for orientation with poor responses to specific direction (Mizobe, Itoi et al. 1988, Toyama, Mizobe et al. 1994, Vickery and Morley 1999) and are organized in functional modules (Villeneuve, Vanni et al. 2009). In line with roles attributed to areas for the ventral pathway, the deactivation of area 21a is known to disturb complex pattern and object recognition without affecting tasks requiring motion detection (Lomber, Payne et al. 1996).
Besides visual areas of the lateral suprasylvian cortex mentioned above like the PMLS and area 21a, areas of the anterior ectosylvian (AES) cortex also represent an important stage of visual processing, particularly for complex motion and oculo-motor integration. The visual area of the AES (AEV) is considered to be one of the highest in the hierarchy of the cat visual cortex (Scannell, Blakemore et al. 1995). Interestingly, despite its relatively well defined anatomical connectivity pattern, and visual response properties, no other area in the mammal visual system can be considered its homologue (Olson and Graybiel 1987, Payne 1993).The AES is a multisensory associative cortex located in the ectosylvian sulcus and comprises three modality-specific subregions: the somatosensory SIV (Clemo and Stein 1982), the auditory FAES, (Clarey and Irvine 1986) and the visual AEV (Olson and Graybiel 1987). Multisensory neurons are present in each subregion but are mainly situated at their common borders (Stein, Meredith et al. 1993, Jiang, Lepore et al. 1994, Jiang, Lepore et al. 1994).
receiving afferents from the AEV are the AMLS, ALLS, and the PMLS, most of which are involved in motion processing (Ouellette, Minville et al. 2004, Villeneuve, Ptito et al. 2006, Ouellette, Minville et al. 2007). These projections may explain visual response properties of its neurons. Neurons of the AEV are relatively large, show binocular summation, are highly sensitive to the direction and velocity of moving objects and respond to complex motion (Scannell, Sengpiel et al. 1996, Nagy, Eordegh et al. 2003, Zabouri, Ptito et al. 2008). These response properties are in line with the role played by the AEV in spatial orientation (Wilkinson, Meredith et al. 1996, Jiang, Jiang et al. 2002).
The AES cortex also maintains reciprocal connection with several subcortical structures, including the LP-pulvinar complex and the LM-Sg (Mucke, Norita et al. 1982). Projections from the AEV mostly target the LPm. Significant projections from the AEV have also been reported to target the intermediate and deep layers of the SC (Fuentes-Santamaria, Alvarado et al. 2009).
2. The Thalamus, more than just a relay
In the previous chapters, we have presented an overview of the classical understanding of sensory processing taking the visual system as a model. In this corticocentric view, most processes necessary for the interpretation of relevant stimuli happen in the cortex, and the thalamus is seen as a relay whose main role is to transfer information from lower centers to the neocortex.
While this corticocentric view is partially correct and has greatly helped our general understanding of the visual system, it has also been (rightly) challenged by a growing number of studies pointing out its limitations in at least two significant ways.
First, there is a growing evidence that cortical areas do not communicate only through direct cortico-cortical connections, but also through lesser known transthalamic pathways, allowing for a cortico-thalamo-cortical transfer of information through higher order thalamic nuclei, such as the pulvinar (Sherman and Guillery 2011). The importance of these pathways has been recognized by several authors in the recent past (Shipp 2003, Casanova 2004, de Souza, Cortes et al. 2019) and while our understanding of these transthalamic routes has significantly expanded in the last decade, we still have very little information as to how they differ from their direct cortico-cortical counterpart (Sherman 2016).
Second, the very existence of these transthalamic pathways has come to question to validity of confining the bulk of neural integration, processing and interpretation of relevant stimuli to the cortex. There is a growing evidence that these transthalamic loops are not just relaying information from one area to another, but that they may be actively involved in the integration of stimuli and play a critical role in processes leading to cognition (Halassa and Kastner 2017).
Thus, the emergence of studies involving the thalamus as an active player capable of modulating cortical function brings several considerations for research in neurosciences, one
the entire cortex without studying how these areas connect to and are modulated by thalamic centers (Sherman and Guillery, 2013).
2.1 Transthalamic pathways and Higher order Nuclei
The classical view of the thalamus defines this structure as a collection of nuclei primarily composed of excitatory neurons, each concerned with transmitting a specific type of afference signal (visual, auditory…) to a functionally distinct area of the neocortex. The significance of the thalamus can be better understood through this quote from Sherman and Guillery, two pioneer researchers in the field of neurosciences, particularly in studies involving the thalamus, which says:
‘Almost everything we can know about the outside world or about ourselves is based on messages that have had to pass through the thalamus’ (Sherman, Guillery et al. 2006).
Even though there is a unanimous consensus in the field of brain studies on the fact that cortical processing critically relies on information sent by the thalamus, the overwhelming majority of models of neural processing view the thalamus and its nuclei as mere relays. In the context of the visual system, this would mean that the LGN ‘simply’ transfers what is sent by the retina to the cortex, without altering, modifying, modulating let alone integrating signals for further processing. This view was largely based on the fact that many of the
thalamic nuclei studied were in fact ‘First Order’ (FO) relays, defined as those nuclei that send messages to the cortex about events in subcortical parts of the brain.
While this simple, almost machine-like relay role of transferring information from lower centers to the cortex attributed to thalamic nuclei may very well account for subcortical inputs relayed to cortical areas through FO nuclei such as the LGN, they do not take into account the existence of massive feedback projections from the cortex to the thalamus. Even in the case of a FO nuclei like the LGN, feedback CT projections from the cortex significantly outnumber its subcortical retinal inputs, thus making it possible to dynamically modulate its output to the primary visual cortex (Kawamura et al., 1974; Updyke, 1977). Furthermore, while limiting the thalamus to a role of transferring subcortical inputs to the cortex explains only part of the function of FO nuclei, they do not tell us anything about higher order (HO) nuclei whose main input and output are cortical areas providing monosynaptic trans-thalamic pathways between areas of the neocortex (Shipp 2003, Sherman and Guillery 2011, de Souza, Cortes et al. 2019).
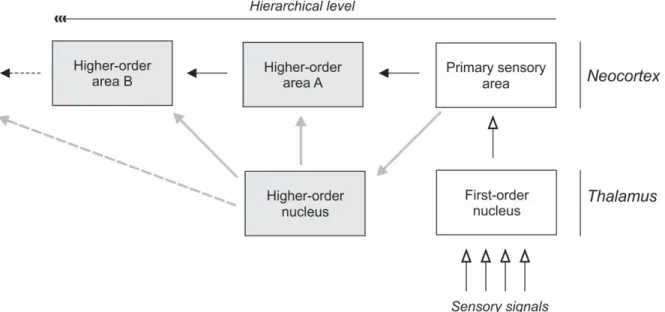
As can be seen in Figure 11, cortical signals from a given area that need to be transferred to higher order areas can either be conveyed through direct cortico-cortical connections, or through transthalamic projections via HO thalamic nuclei. In the context of the visual system, this means that the primary visual cortex can project to higher visual areas such as V4 through the cortico-cortical connections, or through transthalamic pathways involving the pulvinar (HO nuclei in the visual thalamus). In primates, nuclei that contain higher-order circuits
Therefore, confining the thalamus to a station where signals from the periphery are relayed en route to cortical areas doesn’t account for a significant number of thalamic areas which do not receive critical subocortical drive.
Figure 11. Diagram showing conventional view (corticocortical) and alternative view of cortical communication, C.Casanova.
2.2 Drivers and Modulators 2.2.1 Overview and definition
Even though the existence of transthalamic pathways has been increasingly acknowledged in the scientific community, little information is available about its functional significance and how it differs from direct cortico-cortical pathways. One way towards a better understanding of these transthalamic pathways and more generally, interactions between the cortex and the
thalamus, is to determine the nature of the signals they reciprocately convey. In this context, two types of connections have been described between the cortex and the thalamus (Rockland 1994, Rockland 1996). The type II projections are defined as drivers; they are the main carrier of sensory information and are therefore critical for the establishment of classical receptive field properties on the other hand, type I projections are known as modulators as they fine-tune ongoing activity of the recipient neurons. This modulation can happen in several ways : through a modulation of RF properties (tuning orientation, or center surround suppression could be such examples), through short and long term synaptic plasticity, or modulation of synchrony between connected networks of neurons. This modulation however, would not be enough to totally abolish visual responses in the recipient cell.
2.2.2 Differentiating criteria
Several functional and anatomical criteria have been listed in order to differentiate between these two types (Table 1). As mentioned above, they can primarily be distinguished on the basis of their axon morphology. As can be seen in Figure 12, type I (modulator) projections are characterised by long and thin axons giving rise to small boutons on short stalks or small swellings on the axon itself (en passant). Type II terminals are characterized by large caliber axons and clustered endings. The grouping of terminals range between lone singletons and more complex flowery forms of rosettes (Guillery, Feig et al. 2001).
Table 1. Main properties of driver and modulator projections (Sherman, 2017).
Besides terminal morphology observed with regular light microscopy, other criteria can help differentiating between these two distinct types of CT inputs. Ultrastructure analysis of CT cells using electron microcopy also reveal two major types of synaptic arrangements. RL (Round Large) profile present large synaptic terminals that contain round vesicles and contact proximal dendrites of thalamocortical relay cells. In the LGN, RL profiles have been identified to originate from the retina. They correspond to type II axons described at the light microscopy level. Another type of profile, more characteristic of striate projections to the LGN are called RS profile. They contain round synaptic vesicles, are relatively small and contact more distal portions of relay cell dendrites. RS profile are equivalent of type I axons observed in light microscopy (Sherman and Guillery, 2006).
Figure 12. Morphology of type II (left) and type (I) CT axon, Sherman and Guillery, MIT Press 2006.
Another important differentiating criteria has been highlighted in a thorough review by Rouiller and Welker which compared the organization of cortico-thalamic projections of a variety of mammals in sensory and motor systems (Rouiller and Welker 2000). In this review, not only did the author mention that these two types of CT projection have been observed in sensory and motor systems of all mammals studies, they also mention an important observation : across all studies which investigated the anatomical origin of CT projections, it
is the laminar origin of these CT axons which dictates their terminal morphology such that projections originating from layer VI give rise to type I axons, where as those emanating from layer V give rise to thicker type II (Gilbert and Kelly 1975, Ojima 1994, Bourassa and Deschênes 1995, Ojima, Murakami et al. 1996).
Besides laminar origin and terminal morphology, both driver and modulators can also be differentiated on the basis of the postsynaptic glutamatergic receptor they activate or express. A relevant study shedding light on the different putative functional roles of these projections reveals that the postsynaptic elements of type I and II axons express different types of metabotropic glutamate receptors (Vidnyanszky, Gorcs et al. 1996). This study not only confirmed the existence of two distinct types of CT axons in the thalamus, they also observed that thinner type I terminals established a synaptic contact with a dendritic profile that was immune-positive for mGluR1 at the level of the postsynaptic membrane, while thicker type II axons in the pulvinar where immune-negative for this receptor, an observation which suggests that these two morphologically distinct types of projections may very well have different functional roles. This study is also in line with other reports revealing that CT projections from layer VI can activate metabotropic receptors (Godwin, Van Horn et al. 1996), while projections from layer V to HO thalamic nuclei only rely on ‘faster’ ionotropic, AMPA and NMDA, receptors (McCormick and von Krosigk 1992, Salt 2002, Reichova and Sherman 2004, Sherman, Guillery et al. 2006).
These differences in latencies can actually be recorded at the electrophysiological level where both types of inputs have different functional signatures at the relay neuron they contact and
can be measured through their respective excitatory post synaptic potentials (EPSPs). Indeed, driver projection elicit large EPSP with paired pulse depression while modulatory one’s are characterised with smaller amplitudes and paired pulse facilitation (Li, Guido et al. 2003, Reichova and Sherman 2004). These differences can be attributed to the distinct kinetics and probability of synaptic vesicle release of both types of CT projections. Overall, fast acting driving inputs are the ideal candidate allowing for a reliable transfer of information necessary for the establishment of RF properties of a target cell. These types of projection require a high temporal resolution, a characteristic which is line with the electrophysiological features of type II CT projections. On the other hand, slower type I inputs are ideally placed to modulate the ongoing firing of the recipient cell.
2.2.3 Driver and Modulator in the visual system
In the context of the visual system, the presence of both these inputs has been well documented for retino-geniculo-striate pathways (Sherman and Guillery 1998; Sherman and Guillery 1996): retinal projections terminating in the LGN comprise large caliber axons with clustered boutons bearing type II morphology. At the ultrastructural level, they contact relatively large dendritic stems and bear an RL profile (Szentagothai 1963, Guillery 1969). Retinal projections to the LGN are considered driver, because they pass their receptive field properties to geniculate cells (Cleland, Dubin et al. 1971, Shapley and Lennie 1985, Usrey, Reppas et al. 1998, Sherman, Guillery et al. 2006). Similarly, RF properties of layer IV