HAL Id: hal-01299564
https://hal.univ-grenoble-alpes.fr/hal-01299564
Submitted on 7 Apr 2016
HAL is a multi-disciplinary open access
archive for the deposit and dissemination of
sci-entific research documents, whether they are
pub-lished or not. The documents may come from
teaching and research institutions in France or
abroad, or from public or private research centers.
L’archive ouverte pluridisciplinaire HAL, est
destinée au dépôt et à la diffusion de documents
scientifiques de niveau recherche, publiés ou non,
émanant des établissements d’enseignement et de
recherche français ou étrangers, des laboratoires
publics ou privés.
Granular plasticity, a contribution from discrete mechanics
Sibille Luca,∗, Hadda Nejibb, Nicot Fran¸coisb, Tordesillas Antoinettec, Darve F´elixd
aLUNAM University, GeM Institute, CNRS, Nantes / Saint-Nazaire, France bIRSTEA, Center of Grenoble, France
cDepartment of Mathematics and Statistics, University of Melbourne, Victoria, Australia dUniversit´e Grenoble Alpes, CNRS, 3SR, Grenoble, France
Abstract
Failures by divergence instabilities in rate-independent non-associated material, such as granular matter, can occur from mechanical states described by the plastic stress limit surface, but also from stress states strictly included within this surface. Besides, the failure mode may be localized, with for instance the formation of shear bands, or diffuse with a strain field remaining homogeneous. All these failures can be described in a unique framework where plastic limit stress states appear as particular cases of generalized limit states; and where the effective development of failure is characterized by the unbounded increase of response parameters linked by a failure rule (i.e. a generalized plastic flow rule), together with a bifurcation of the mechanical response from a quasi-static pre-failure response to a dynamic post-failure one. All these features are discussed and highlighted from direct numerical simulations performed with a discrete element model. Moreover, the second order work criterion directly related at the macroscopic scale to divergence instabilities, is shown to be also relevant at the scale of inter-particle contacts.
Keywords: limit state, failure, bifurcation, granular matter, plastic flow, strain localization
1. Introduction
Failure is a physical phenomenon, leading to large material deformations and ultimately to the ruin of the sample or the structure. Usually in solid mechanics, failure involves plastic strains and/or damage, and a first limitation of this paper is to restrict the discussion to rate-independent materials. In this framework, failure happens when the applied load can no longer be sustained by the sample or the structure. Thus the notion of limit stress states and limit criteria (defined as the set of these limit stresses) has been introduced to describe these material limitations. According to the usual experiments, these rather simple tools have allowed to take into account the failures by material divergence instabilities in the case of associated elasto-plastic materials. Failures by geometric instabilities or by flutter instabilities are not described by these limit stress
∗IUT de Saint-Nazaire 58, rue Michel-Ange – BP 420 – 44606 Saint-Nazaire Cedex, France
Email address: [email protected]; [email protected] (Sibille Luc)
Author-produced version of the article published in Journal of the Mechanics and Physics of Solids, 75:119-139. doi: 10.1016/j.jmps.2014.09.010
for instance the metal forming (Stoughton and Yoon, 2009; Taherizadeh et al., 2011), and high strength steels (Mohr et al., 2010). Granular media, considered in this paper and involving a Coulombian friction at the inter-particle scale, can be considered as a typical case of non-associated materials, characterized by a non-symmetric constitutive matrix.
For such for non-associated materials, it is well known from a theoretical point of view (Rice, 1976) and from the experiments (see for example Desrues 1990) that localized failure by shear bands can appear before the plastic limit surface. The localization criterion (vanishing of the determinant of the acoustic tensor, Rice 1976) can thus be fulfilled in the plastic hardening regime. Another classical paradox is the failure of loose granular media for isochoric ( the so-called undrained) triaxial loading, which can appear largely before the Mohr-Coulomb plastic limit criterion and can lead to a liquefied state of sand without any shear band formation (see for example Daouadji et al. 2011, or Sladen et al. 1985). In this last case, the limit state appears as defined in a generalized way by both some linear combinations of strains (the isochoric condition as given by the vanishing trace of the strain tensor) and of stresses (the difference between the axial stress and the lateral one as given by a constant rate, if this isochoric axisymmetric loading is axially force controlled). Thus the first purpose of this paper is to show that there is no difference in the interpretation and the characterization of failure occurring either from the plastic limit surface or strictly within the plastic limit surface. This includes both the conditions for failure initiation and its development for a short time period after initiation. This interpretation requires to consider generalized limit states as defined in section 3 of the article.
Generalized limit states are closely related to the second order work criterion (loss of positive definite condition of the elasto-plastic matrix) constituting a general criterion for all divergence instabilities (Lerbet et al., 2012, 2013). This classical criterion in solid mechanics has been widely discussed, taking into account the incremental piece-wise linearity or incremental non-linearity of elasto-plastic constitutive relations (e.g. Rice and Rudnicki 1980; Petryk 1992; Brannon and Drugan 1993; Bigoni 2012). In the restricted framework of granular mechanics (like in the present paper), second order work criterion has been also extensively analyzed and applied, in both continuum and discrete mechanical descriptions of granular media (Daouadji et al. 2011; Darve et al. 2004, 2007; Nicot et al. 2007, 2012b; Borja 2006; ...). Therefore this paper is not coming back to the thorough analytical developments related to this notion, which fully explain how
it is possible to obtain failure of non-associated materials strictly inside the plastic stress limit surface by adding kinematical constraints (like the isochoric condition, for example). Besides, the destabilizing effect of some loading directions, included inside the isotropic cone (as defined in linear algebra) of the elasto-plastic matrix, which are inducing negative values of the second order work, for non-symmetric stiffness matrices, has been recently confirmed from a mathematical point of view (Lerbet et al., 2012, 2013). In the same perspective, classical plastic strain flow rule has to be generalized to failure rule. Generalized limit states and generalized failure rule appear as linked to singularities of the generalized elasto-plastic matrices, relating the generalized loading and response parameters (Darve et al., 2004). These singularities correspond precisely to the loss of positive definite condition of the constitutive matrix (or equivalently of its symmetric part). Both these notions of generalized limit states and generalized failure rule are checked and analyzed in this paper by simulating two-dimensional strain proportional loading paths, either strain or stress controlled, with a discrete element model (DEM) allowing to characterize failure of granular assemblies in a detailed manner.
Experiments (Daouadji et al., 2011), direct simulations (Tordesillas et al., 2012), and application of second order work to failure of granular media (Nicot and Darve, 2011) suggest that two different modes of failure seem to exist, which can be localized and structured into shear bands, compaction or dilation bands; or diffuse with a rather homogeneous not-structured displacement field, which can be more or less chaotic according to the boundary conditions. Influence of initial density on the occurrence of localized mode of failure has been deeply analyzed (e.g. Han and Vardoulakis 1991; Alshibli and Sture 2000; Desrues and Viggiani 2004). It is an important discriminating parameter since experiments are telling us that dense sands with softening effects are promoting localized failure, while loose sands with possible liquefaction states can fail in a diffuse mode. Nevertheless, the localization criterion corresponds to the vanishing of the determinant of the acoustic tensor (Rice, 1976), thus it partially depends on the path directions for all the loading plastic directions, while obviously it is not fulfilled for all unloading elastic directions. Since the behaviour of a granular medium described by DEM is incrementally non-linear (as also observed experimentally), this rough discussion has to be refined. Therefore the purpose of the second part of the paper is to investigate the influence of the loading path directions on the occurrence of localized versus diffuse failure modes.
As in the first part of this paper, these discussions are essentially based on discrete element modelling results. In this perspective, an expression of second order work in discrete mechanics (Nicot et al., 2012a; Hadda et al., 2013) is considered in a third part of the paper. This discrete form of second order work is directly related to the usual macroscopic second order work (expressed in the framework of continuum mechanics) used as a criterion to identify generalized limit states. Consequently, the discrete form of second order work should give an indication about the micro-structural elements contributing to the existence of a limit state at the macroscopic scale. In addition one can wonder whether these micro-structural elements are also related to the failure mode (diffuse or localized). Then the third part of the paper is dedicated to
Author-produced version of the article published in Journal of the Mechanics and Physics of Solids, 75:119-139.
The model consists in a rectangular assembly of 20,150 circular particles, with a ratio of maximum particle diameter to minimum diameter of 7.7. The inter-particle contact law is elasto-frictional and characterized by three mechanical parameters, normal and tangential stiffnesses kn and ks, and a friction angle ϕc. Hence
the normal force to the tangent contact plane Fn is linearly related to the overlap of contacting particles
through kn. Only compressive normal forces are modeled, and contact is lost as soon as the overlap vanishes
(i.e. the compressive normal force vanishes). In the tangential contact direction, the tangential contact force Ftis linearly related to the relative tangential displacement of particles through ksand obeys the Coulomb’s
friction law such that |Ft| ≤ Fntan ϕc.
The stress-strain state of the granular assembly is controlled thanks to four rigid and frictionless walls enclosing the sample as shown in Figure 1. Since there are no tangential force in wall-particle contacts, the principal stress and strain directions coincide with the normals to the walls. Consequently, each of the principal values of the stresses (σ1 and σ2) and strains (ε1 and ε2) can be controlled, directly for strains
by adjusting the wall displacements, or indirectly for stresses with a closed-loop control (since only wall positions or displacements are directly controlled). Finally, the strain state is determined from the wall positions, whereas the stress state is determined from the wall-particle contact forces. The control of a principal value of stress or strain for each direction (i.e. for each wall) is a straightforward way to impose a loading programme to the granular assembly. Nevertheless, more complex loading programmes will be considered in this paper involving the control of the sample through linear combinations of principal values of stresses, or strains (as it is the case for instance when an isochoric constraint characterised by the relation εV = ε1+ ε2= cst., is imposed); more information about numerical aspects of such controls can be found
in Sibille et al. (2009).
Simulation results presented in this paper were all obtained from two initial granular assemblies differing with respect to their initial densities. There is a dense sample called “D sample”, and a medium dense one called “MD sample”. These granular assemblies have been generated from the compaction of a cloud of particles. The target density of samples has been reached by tuning the inter-particle friction angle during the compaction phase (density increases for decreasing values of friction angle). Samples have been
20,150 circular particles
x1
x2 Rigid frictionless
walls
Figure 1: The two-dimensional discrete element model
Sample kn/ds kt/kn ϕc Porosity Coordination number
(N/m2) (deg) n z D 356 106 0.42 35 0.148 4.20
MD 356 106 0.42 35 0.178 3.36
Table 1: Characteristics of the numerical samples under an isotropic confining pressure of 300 kPa.
finally isotropically compressed up to a confining pressure σ1= σ2 = 300 kPa. This initial isotropic stress
state on samples D and MD constitutes the starting point for all the simulations discussed in this paper. Characteristics of samples at their initial states are given in Table 1 together with the values of mechanical parameters.
3. Generalized limit states and effective failure 3.1. Limit stress states
It is experimentally observed that, for a considered material, some stress states cannot be reached whatever the loading programme chosen. Stress states constituting the limit between the domain of accessible and non-accessible stress states are named limit stress states, and constitute in the stress space a limit surface. In the classical elasto-plastic framework this limit surface corresponds to the plastic limit condition expressed formally for non-viscous media by det M = 0 (Darve, 1990), where M is the tensor defining the incremental constitutive relation dσ = M dε between the incremental stress and strain tensors. The plastic limit condition expresses the fact that finite deformations can develop without any change in the stress state (dσ = 0 whatever dε).
Such a limit stress state can be observed with the two-dimensional model presented in the previous section by performing a classical drained biaxial compression, where the radial (or lateral) stress is kept constant σ2 = 300 kPa, while the granular assembly is axially compressed by imposing a positive axial strain rate
Author-produced version of the article published in Journal of the Mechanics and Physics of Solids, 75:119-139.
Figure 2: Drained biaxial compressions axially strain controlled performed on the dense sample D, and the medium dense sample MD
˙
ε1 = 0.01 s−1. Simulated responses with samples D and MD are displayed in Figure 2 where axial stress
σ1 and volumetric strain εV are plotted in terms of the loading parameter ε1. Incidentally, sample D
presents a strong dilatant behaviour and a well marked σ1peak, justifying its “dense” qualification; whereas
the contractant phase is more important for the MD (medium dense) sample, followed by only a slight dilatancy. In addition, the axial stress σ1for sample MD reaches a plateau without passing through a peak.
Stress paths in σ1-σ2plane, and q-p plane (where q = σ1− σ2and p = (σ1+ σ2)/2) are shown in Figure 3.
We clearly see in this latter figure that a limit stress state has been reached at the extreme point of the stress path for each sample respectively. In Figure 2 limit stress states correspond to the peak of σ1 for
sample D, and the plateau of σ1 for sample MD. As the granular assembly is cohesionless the limit surface
can be drawn from this single limit stress state (as presented in Figure 3) and corresponds, in this case of frictional granular material, to the Mohr-Coulomb limit condition.
However, the plastic failure as described earlier with finite deformations developing under a constant stress state is not observable in Figure 2, because failure is not effective (the sample is not collapsing). As the limit state reached is a limit stress state, effective failure will occur only for a full stress loading of the granular assembly.
For the biaxial drained compression considered here, there are several ways to follow the loading path fixed by the first loading parameter σ2= cst. and defining a vertical line in the σ1-σ2 plane or a line with
a slope of 2 in the q-p plane (Fig. 3). Then, the operator is free to choose the nature of the second loading parameter. It can be the axial strain ε1or the axial stress σ1, and whatever this second loading parameter,
the stress path followed by the sample will be unchanged. The second loading parameter is used to control the mechanical state of the material along the loading path. This second loading parameter is called the control parameter. A control through the axial strain has already been considered. Hence we consider now
Figure 3: Stress paths followed by D and MD samples during the drained biaxial compressions
the axial stress σ1 as the control parameter instead of the axial strain. A positive axial stress rate ˙σ1> 0
is imposed to the sample such that the simulated response in terms of axial strain rate is similar to the one imposed when the sample is axially strain controlled (at least at the vicinity of the initial isotropic state). Simulated results with sample D are presented in Figure 4 and compared with the previous simulation of biaxial compression axially strain controlled. Simulated responses are identical for both modes of control (axial strain or stress control) until the limit stress state (characterized by σ1= 848 kPa or q = 548 kPa) is
reached. Then, when the sample is axially stress controlled, an additional load (i.e. an additional increase of σ1) cannot be applied beyond the load bearing capacity of the granular assembly resulting in its effective
failure. During this effective failure, Figure 4a shows that σ1 reaches a plateau meaning that stress state
stays quasi unchanged close to the limit stress state, while axial (and radial) strain grows continuously as displayed in Figures 4a,b. Consequently, sample is typically experiencing a plastic failure. Actually, a small increase of σ1 is observable beyond its limit value due to inertial effects no more negligible at failure
initiation, as presented here after.
Figures 4b,d show a sharp increase of deformation rate while the limit stress is passed with the axial stress control, logically accompanied by a well marked burst of kinetic energy. Consequently, effective failure can be seen as a bifurcation of the response mode of the granular assembly, characterized by the sudden transition from a quasi-static pre-failure response to a dynamic post-failure response for a constant control parameter (in this case ˙σ1= cst.). Such effective failure, with a true collapse of the sample, is the physical
manifestation of the loss of controllability introduced by Nova (1994) and Imposimato and Nova (1998), or loss of sustainability defined by Nicot et al. (2007).
Author-produced version of the article published in Journal of the Mechanics and Physics of Solids, 75:119-139.
(a) (b)
(c) (d)
Figure 4: Drained biaxial compression axially stress controlled on sample D (results are superimposed on those previously simulated for the axially strain controlled compression, Fig. 2); axial strain and kinetic energy are plotted in (b) and (d) in terms of dimensionless time t/tpeak, where tpeak corresponds to the time when limit value of axial stress σ1 is reached.
3.2. Generalized limit states
The classical view of failure for rate-independent materials, briefly recalled in the previous section can be generalized. In the previous section we considered the occurrence of effective failure when the loading of the granular assembly is defined only from stress components. However more general loading conditions can be considered by substituting the stress tensor σ by a loading tensor l. In this perspective we first review the notions of loading path, loading parameter, and control parameter. Let n (with 2 ≤ n ≤ 6) be the dimension of the loading space (for example, n = 2 in usual axisymmetric conditions with no rotation of the principal stress and strain directions). The loading is defined by a set of n components li of the loading
tensor. These variables are linear combinations of either strain components (for instance, if the sample volume is controlled it means that the volumetric strain εv = tr(ε) is one of the components li), or stress
components (it could be for instance q = σ1− σ2). They shall verify the energy conjugation equation2: n X i=1 liri= n X i=1 σiεi, (1)
where the n variables riare the response parameters (Nova, 1994; Runesson and Mroz, 1989; Klisinski et al.,
1992). Likewise, these variables are linear combinations of either stress or strain components. At a given loading point, the loading path direction is defined by both the n − 1 relations ˙li = 0 (i = 1, . . . , n = 1) and
the relation ˙ln = const.3 (an example is given in Figure 5). Because the parameter ln makes the system
evolve over time, it is denoted control parameter. The n − 1 other parameters liare the loading parameters.
A limit state is reached when the response parameter rn, conjugated to ln, passes through an extremum
(local maximum or minimum). The limit state is defined by the n − 1 values of li at this extremum together
with the value of rn (Figure 5b). When the n − 1 loading parameters li and the response parameter rn
include both stress and strain components (and not only stress components as in the plastic limit state), this limit state is named a generalized limit state.
With the numerical discrete model, generalized limit states can be identified, for instance, with propor-tional strain loading paths. Proporpropor-tional strain loading paths are a generalization of isochoric (or undrained) paths. In 2D it implies that one of the loading parameter is defined as l1 = ε1+ Rε2 = cst. The value of
R is fixed for a given loading programme, for R = 1 we retrieve the isochoric condition, whereas for R > 1 the loading path is contractant, and it is dilatant for R < 1. In a first step, we define the second loading
2If the loading and the response cannot be defined in the principal stress and strain directions, the six-dimensional space
associated to the three-dimensional physical space is then used to express the components liand riof the loading tensor l and
response tensor r respectively.
3This relation can be more generally extended to ˙l n= f (t).
Author-produced version of the article published in Journal of the Mechanics and Physics of Solids, 75:119-139.
(a) (b)
Figure 5: (a) Sketch of the loading path in a three-dimensional loading space (n = 3), the loading direction is defined by two conditions, ˙l1 = 0 and ˙l2 = 0, imposed on the loading parameters; (b) a constant rate of change imposed to the control
parameter, ˙l3= const., makes the mechanical state evolving along the loading path. A generalized limit state is reached if the
response parameter r3conjugated (with respect to energy) with the control parameter l3passes through an extremum.
parameter, i.e. the control parameter, as l2 = ε1. To impose a displacement of the mechanical state of
the sample along the loading path defined by l1 = ε1+ Rε2 = cst. we impose ˙l2 = ˙ε1 = 0.01 s−1. The
conjugated response parameters are r1= σ2/R and r2= σ1− σ2/R because: n=2 X i=1 liri= (ε1+ Rε2) σ2/R + ε1(σ1− σ2/R) = n=2 X i=1 σiεi (2)
This loading programme was simulated with sample D for R = 0.46 (Figure 6), and with sample MD for R = 0.80; 0.90; 1.00 and 1.10 (Figure 7). Loading programmes with R = 0.46; 0.80 and 0.90 correspond to dilatant paths, as displayed in figures 6a and 7a, where the volume change ∆V /V0 is plotted in terms
of the control parameter ε1. For R = 1.00 and R = 1.10 the loading paths are isochoric and contractant
respectively as represented in Figure 7a.
Figures 6c and 7c show that for some of these loading paths (for R = 0.46; 0.80 and 0.90), the response parameter r2= σ1− σ2/R is passing through a maximum, while the maximum is only local for R = 1.00 and
does not exist for R = 1.10 (Figure 7c). The first loading parameter ˙l1 = ˙ε1+ R ˙ε2 = 0 can equivalently
be represented by the relation − ˙ε1/ ˙ε2 = R. Hence simulated results can also be represented in the plane
(σ1− σ2/R) versus (− ˙ε1/ ˙ε2) as shown in Figure 8 for MD sample. According to the value of R different
loading paths are followed, all represented in this plane by vertical lines. For some paths a maximum value of the parameter σ1− σ2/R is reached and never exceeded. These maxima depend on the value of R. In
other words, for a given loading parameter l1 = ε1+ Rε2 (characterized by a particular R value) it may
correspond a limit value of σ1− σ2/R, defining a generalized limit state involving a mixed couple of loading
(a) (b)
(c)
Figure 6: Proportional strain loading path fully strain controlled for sample D with R = 0.46
Author-produced version of the article published in Journal of the Mechanics and Physics of Solids, 75:119-139. doi: 10.1016/j.jmps.2014.09.010
(a) (b)
(c)
Figure 7: Proportional strain loading path fully strain controlled for sample MD with R = 0.80; 0.90; 1.00 and 1.10
state is not encountered, as for R = 1.10 with the MD sample, and the first limit state reached will be the limit stress state as defined in the previous section and discernible in Figure 7b.
The generalized limit states discussed above constitute limit states because values of the response param-eter rn(conjugated with the control parameter ln) beyond the limit state are not accessible for the granular
assembly. To check this point, the response parameter rn and the control parameter ln can be switched (in
accordance with the energy conjugation equation), such that the control parameter is now the one that was passing through an extremum. For a such loading programme the incremental constitutive relation between l and r writes dl = Ndr, and det N = 0 at the generalized limit state (Darve et al., 2004). This last relation means that undefined finite changes of the response parameters rican develop under constant values of the
loading parameters li which are effectively all stationary at the limit state (dl = 0 whatever dr).
The definition of the generalized limit state is checked below on the example of a proportional strain loading path. The control parameter ε1considered so far is switched for the conjugated parameter σ1−σ2/R
by imposing to the sample ˙σ1− ˙σ2/R > 0 to attempt to break the limit value of σ1− σ2/R identified in
Figure 8: Loading path in the plane (σ1− σ2/R) versus (− ˙ε1/ ˙ε2) for the MD sample
path characterized by R = 0.8 on sample MD. The simulated response is displayed in Figure 9 and compared with the loading axially strain controlled. We remark that the maximum value of σ1− σ2/R reached for the
axial strain control is only temporarily slightly exceeded (Fig 9a). Finally the generalized stress deviator σ1− σ2/R stabilizes, from 1.8 % of axial strain, at a value very close to the limit value of σ1− σ2/R (while
the condition ˙σ1− ˙σ2/R > 0 is still imposed), constituting a proper generalized limit state. Besides, at
the generalized limit state effective failure is triggered in a fashion qualitatively identical to the effective plastic failure described along the drained compression path in Figure 4. The sharp increase of the axial strain rate and of the kinetic energy (Fig. 9b,d) when the generalized limit state is passed are evidence of the bifurcation of the response mode of the granular assembly.
We emphasize that the limit stress state briefly reviewed in Section 3.1 is actually a particular case of the generalized limit state for which the loading tensor triggering the failure is equivalent to the stress tensor (l ≡ σ). The loading space is two-dimensional and defined by the loading parameter ˙l1 = ˙σ2 = 0
and the control parameter ˙l2 = ˙ε1 > 0. The limit state is reached when the response parameter r2 = σ1
(conjugated with l2) reaches a peak or a plateau. Then failure is effectively triggered at the limit state if
control parameter and its conjugated response parameter are switched (i.e. ˙l2= ˙σ1> 0), or in other words
when the loading is fully defined from stress components.
To complete this general characterization of failure, at limit states the loading parameters are stationary, implying that dl = 0, and Ndr = 0 (Darve et al., 2004). In 2D (but it can be also extended to 3D cases) this last relation implies that response parameters involved in response tensor r are linearly related. This is true for a limit stress state (when l ≡ σ), where Ndε = 0 is the material flow rule giving the direction of ε; but also for generalized limit states where, by extension, the relation Ndr = 0 is called the failure
Author-produced version of the article published in Journal of the Mechanics and Physics of Solids, 75:119-139.
(a) (b)
(c) (d)
Figure 9: Proportional strain loading path on sample MD for R = 0.8 controlled with parameter σ1− σ2/R (results are
superimposed on those previously simulated for the axially strain controlled path, Fig. 7); axial strain and kinetic energy are plotted in (b) and (d) in terms of a time t/tpeak, where tpeak corresponds to the time when the limit value of σ1− σ2/R,
represented in (a), is reached
rule (Darve et al., 2004). In this last case, unlike limit stress states, the response parameters do not belong to the strain space, but to a generalized space (defined with both strain and stress components.) As a result, the relation Ndr = 0 specifies the direction of the incremental response within this generalized space. Such a linear dependency of response parameters at failure is observable in Figure 4c (which is a representation of the 2D strain space) for the limit stress state, and in Figure 9c (which is a mixed “stress-strain” plane, σ2/R vs ε1) for a generalized limit state.
3.3. Detection of limit states with the second-order work criterion
Possible limit states (generalized limit states or limit stress states), can be more conveniently detected thanks to the order work, than by looking for extrema of possible control parameters. The second-order work has been first introduced by Hill (1958). Its definition has been discussed in previous papers (see for instance Darve et al., 2004, 2007; Nicot et al., 2007, 2012b,a; di Prisco and Nova, 1994; Daouadji et al., 2011; Osinov and Wu, 2005; Bigoni and Hueckel, 1991; Raniecki and Bruhns, 1981; Valanis, 1985; Chambon and Caillerie, 1999) and we do not get back here about it. The second order work is expressed as the product between the stress increment tensor and the strain increment tensor experienced by the material during an incremental loading (hence stress and strain tensor are here related by the constitutive relation of the material). Second order work can also be indifferently expressed in terms of loading and response parameters (conjugated with respect to energy). Assuming small strains and negligible changes in geometry (Nicot et al., 2007), it writes:
W2= dσ : dε = dl : dr (3)
If along a loading path the second order work vanishes or even takes negative values, W2 ≤ 0, then the
corresponding mechanical states constitute limit states. The advantage of expressing the second order work with loading and response parameters is that the parameter related to the vanishing of the second order work can be identified (i.e. the parameter passing through an extremum and leading to effective failure if it is used as the control parameter). For instance, for the biaxial drained compression the second order work writes:
W2= dl1dr1+ dl2dr2= dσ2dε2+ dσ1dε1 (4)
as dσ2= 0, W2reduces to:
W2= dσ1dε1 (5)
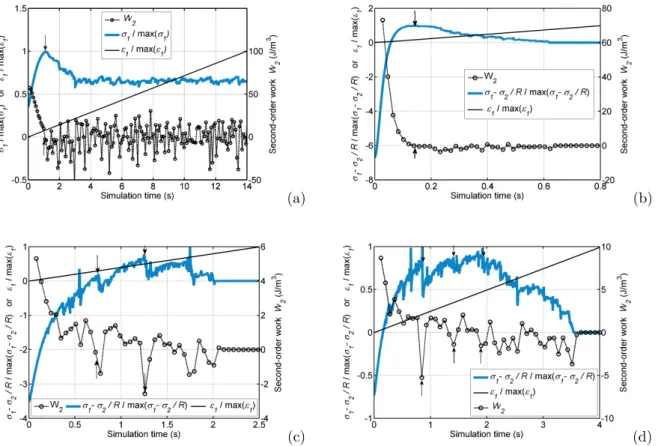
During a drained compression, only σ1 presents a peak or a plateau at which dσ1 vanishes (dε1 is always
positive) together with W2. This can be summarized in Figure 10a where second order work, and σ1 and
ε1(which can be either response or control parameters) are plotted with respect to time during the drained
compression of sample D. As expected W2vanishes at the peak of σ1and takes negative values beyond. The
same approach can be carried out for the proportional strain loading paths. The second order work writes: W2= dl1dr1+ dl2dr2= (dε1+ R dε2) σ2 R + dε1(dσ1− dσ2 R ) (6) as dε1+ R dε2= 0, then: W2= dε1(dσ1− dσ2 R ) (7)
Author-produced version of the article published in Journal of the Mechanics and Physics of Solids, 75:119-139.
(a) (b)
(c) (d)
Figure 10: Time series of second order work and the two possible control parameters computed along the drained compression path with sample D (a), and along proportional strain loading paths with sample D for R = 0.46 (b), and sample MD for R = 0.80 (c) and R = 0.90 (d); arrows highlight some times when second order work vanishes
As displayed in figures 10b-d, vanishing of second order work corresponds to peaks of (σ1− σ2/R) (if any)
while dε1does not present extremum for such loading paths.
Consequently, there is macroscopically no difference between the condition of occurrence of effective failure along the drained compression path (associated to a limit stress state) and along proportional strain paths (associated to generalized limit states): effective failure occurs from a limit state if the control pa-rameter is the one associated with the vanishing of the second order work and if it is imposed such that it corresponds to a loading with respect to this limit state (if at the limit state along a proportional strain path we impose for instance dσ1− dσ2/R < 0 effective failure is not triggered, as it is not triggered if dσ1< 0 is
imposed at the limit stress state reached along a drained compression path). Hence, the limit stress state (i.e. the plastic limit condition) can be seen as a particular case of the generalized limit states where l ≡ σ and r ≡ ε. This generalized failure description is also in agreement with the classical elasto-plastic framework where plastic failure occurs if the stress state belong to the plastic limit condition expressed by f (σ) = 0, and if the loading parameters are all stress components defined such that ∂σ∂f : σ > 0 (if ∂f∂σ : σ < 0 then there is an unloading and no failure).
4. Failure mode
The general description of failure presented in previous sections does not give any indication about the localization (or not) of deformation during failure development, and in particular about the formation of shear band. The two main questions we want to deal with are: firstly, what can be the influence of the loading path on the development of shear bands? In other words, are there some loading paths along which strain localization occurs whereas it can be avoided for other paths? Secondly, for a given loading path are shear bands (or lack of shear bands) affected by the choice of the control parameter?
Incipience of a shear band of normal ~n is analytically described by the Rice’s criterion (Rice, 1976) corresponding to the vanishing of the determinant of the acoustic tensor det(~ntM ~n) = 0 (where M is the constitutive tensor). Hence, Rice’s criterion should be considered in addition to second order work criterion to assess the failure mode (localized or diffuse). If both second-order work and Rice criteria are verified then localization of deformation to form a shear band is expected with the occurrence of failure inside the shear band. On the other hand, if only the second-order work criterion holds whereas Rice’s criterion is not verified, there is a lack of shear band, and failure is expected to be diffuse within the whole sample (subjected to an homogeneous stress-strain state). It is worth noting that Rice’s criterion implies second order work criterion (Bigoni and Hueckel, 1991; Bigoni, 2000; Nicot and Darve, 2011), and Rice’s criterion cannot hold if second order work criterion is not fulfilled.
Rice’s criterion depends on the constitutive tensor M. For granular materials, the incremental con-stitutive relation is incrementally piecewise linear (or even incrementally non-linear). This means that the expression of M depends, among other, on the loading direction. For incrementally piecewise linear relations the tensor M differs from one tensorial zone4 to the next (whereas M is continuously changing with the stress loading direction for incrementally non-linear relations). This means that Rice’s criterion depends indirectly on the loading direction. Since expression of M is identical in a whole tensorial zone, acoustic tensor is itself identical in each tensorial zone. Consequently, when Rice’s criterion is verified, it is for at least a whole (or several) tensorial zone, but it may be not verified for other tensorial zones. Then for a given material, we can imagine loading paths included in a given tensorial zone, along which shear bands develop; whereas they are inexistent for other paths belonging to another tensorial zone.
Influence of the loading path is discussed in the following by investigating the strain fields computed for the drained compression path and the proportional strain loading paths.
4A tensorial zone is a hypercone of the incremental loading space where the constitutive relation is linear. Consequently,
the constitutive tensor is independent of the loading direction inside a tensorial zone.
Author-produced version of the article published in Journal of the Mechanics and Physics of Solids, 75:119-139.
∆ε. This latter is deduced from the discrete incremental displacement field of circular particles (Calvetti et al., 1997; Sibille and Froiio, 2007). Particle centres are connected by performing a Delaunay triangulation, and a linear continuum displacement field ∆χ is defined over each triangle k such that it equates, at the vertices m of triangle k, the incremental displacements of particle centres ∆xm (with m spanning the 3 particles defining the triangle k). Hence ∆χ writes:
∆χ = Akx + Bk (8)
where Ak and Bk are respectively the matrix and the vector that solve the system of three vectorial
equations:
Akxm+ Bk = ∆xm (9)
Finally, the infinitesimal strain tensor ∆ε associated with the continuum displacement field ∆χ is computed as:
∆ε = 1 2 h
grad ∆χ + (grad ∆χ)ti (10)
Note that in such approach, the computed strain tensor does not take into account the rotations of particles.
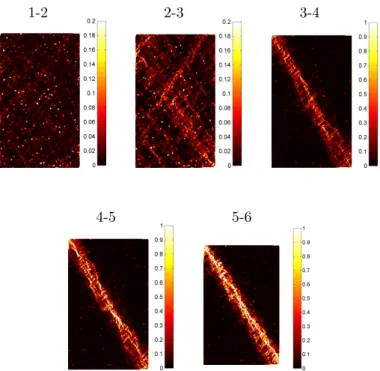
In Figure 11 are displayed, for the drained compression axially strain controlled on sample D, the incre-mental deviatoric strain fields computed between two successive snapshots represented with circular symbols in Figure 2. The strain field is initially homogeneous (snapshots 1-2). Localization of shear deformation develops before reaching the peak of the axial stress (snapshots 2-3) and several incipient shear bands are observable. After the peak, localized shear deformation concentrates in a unique shear band while others disappear (snapshots 3-6). These results are quite common for a dense granular assembly subjected to a biaxial (or triaxial in 3D) drained compression, and we remark that shear band may develop before reaching the limit stress state (i.e. before the peak of σ1) as observed experimentally (Desrues, 1990). In other words,
Rice’s criterion is here fulfilled before reaching the limit stress state and the failure at the sample scale.
We consider now the case of the biaxial drained compression with sample D where the control parameter is no more the axial strain but the axial stress. In this case, effective failure is triggered at the limit stress
1-2 2-3 3-4
4-5 5-6
Figure 11: Incremental deviatoric strain fields for the biaxial drained compression performed on sample D, axially strain controlled; incremental fields are computed between numbered snapshots identified in Fig. 2.
state. Incremental deviatoric strain fields computed between snapshots represented with triangle symbols in Figure 4a are shown in Figure 12. As for the axial strain control, strain field is initially homogeneous (snapshots 1-4) and localization of shear deformation initiates when the limit stress state is approached (snapshots 5-7), i.e. when values of σ1are approaching the peak of σ1for the axial strain control (Fig. 4a).
After effective failure initiation (i.e. at the occurrence of the burst of kinetic energy, Fig. 4d) shear bands strongly develop (snapshots 7-9). Consequently, initiation and development of localization of shear defor-mation are very similar for both modes of control, with the parameter ε1 where effective failure does not
occur, or with σ1 where it does. The unique difference concerns the localization pattern since two main
shear bands are observed for the axial stress control, whereas there is only a single one for the axial strain control.
Theoretically, since the loading paths followed during the drained compression when it is axially strain or stress controlled are similar (see Fig. 4a & c), at least until the limit stress state, the constitutive responses are identical for both modes of control. It means that the expression of the constitutive tensor is identical for both modes of control at each point of the loading path, until reaching the limit stress state. Consequently, expression of Rice’s criterion is identical in both cases and there is no reason for observing different conditions of shear band incipience for an axial stress control with respect to a strain one, as exemplified with the numerical results.
Author-produced version of the article published in Journal of the Mechanics and Physics of Solids, 75:119-139.
6-7 7-8 8-9
Figure 12: Incremental deviatoric strain fields for the biaxial drained compression axially stress controlled and performed on sample D, incremental fields are computed between numbered snapshots identified in Fig. 4a
The shear band formation is a bifurcation phenomenon from an homogeneous strain response to a local-ized one. Bifurcation phenomena are very sensitive to heterogeneities or imperfections in the constitution of the samples or in their boundary conditions, influencing greatly the shear band patterns. However, the same initial sample (rigorously identical) was used for both simulations, strain or stress controlled. Consequently the development of a second shear band when the sample is stress controlled can be attributed to differences in the loading “device”. In the present case, when the sample is stress controlled, the imposed axial stress rate has been chosen such that the simulated axial strain rate response is similar to the one imposed for a strain control, close to the initial isotropic state. Such a correspondence is no longer verified when the mechanical state approaches the limit stress state as shown in Figure 4b. The difference in the shear band patterns can thus be attributed to this difference in the strain rate.
Concerning sample MD, the incremental deviatoric strain field is shown in Figure 13 for the drained compression path axially strain controlled. Numbered snapshots are defined with square symbols in Figure 2. As sample MD is initially less dense than sample D, the localization of shear deformation is less important. Shear bands are however observable between snapshots 5 to 10 when σ1 reaches and follows a plateau
(Fig. 2). An important difference by comparison with sample D, is that shear bands seem here to not be perennial at large deformation since directions of main shear planes completely change from snapshots 7-8 to snapshots 9-10.
1-2 3-4 5-6
7-8 9-10
Figure 13: Incremental deviatoric strain fields for the biaxial drained compression performed on sample MD, axially strain controlled; incremental fields are computed between numbered snapshots identified in Fig. 2.
4.2. Failure mode along the proportional strain loading paths
Proportional strain loading paths constitute another way to bring granular assemblies to failure. Since the strain direction (or the stress direction) followed by the sample along such loading paths (volumetric strain rate fixed) may be different from the one followed during the drained compression path, we can expect the constitutive tensor to be different and then to observe different qualitative sample responses, among others with respect to the shear strain localization.
Incremental deviatoric strain fields for the proportional strain path fully strain controlled are plotted in Figure 14 for sample D and R = 0.46. Shear bands develop quite rapidly and are already well visible between snapshots 3 and 4. Then as for the drained compression path, shear deformations concentrate in a main shear band (snapshots 5-8). Simulations were performed for other R values (not shown here) allowing to investigate other loading directions. However, results were in all cases very similar with those presented in Figure 14, even for very low R values representing very dilatant loading paths. In all cases strain localization appears very early for sample D and is not influenced by the loading direction (at least for directions corresponding to proportional strain paths).
For MD sample, incremental deviatoric strain fields are displayed in Figure 15 for R values from 0.8 to 1.1. For the lowest R value (R = 0.8), some very slight heterogeneities in the strain field appear from time to time but do not draw shear bands and are very ephemeral. The strain field stays quite well homogeneous until the total vanishing of stresses (snapshots 7-8), and thus until the total lost of shear strength of the sample. In this case we can speak about a diffuse failure developing in the whole sample and not localized within a shear band.
Author-produced version of the article published in Journal of the Mechanics and Physics of Solids, 75:119-139.
Figure 14: Incremental deviatoric strain fields for the proportional strain loading paths performed on sample D with R = 0.46, incremental fields are computed between numbered snapshots identified in Fig. 6.
For higher R values (R = 0.9; 1.0 and 1.1), heterogeneities in the strain field are slightly more important and seem sometimes to draw very softly marked shear bands; as for snapshots 3-4 for R = 0.9 and 1.0, where heterogeneities in the strain field seem to depict very incipient shear bands. However, such patterns are very ephemeral, and fade in the following snapshots (5-8). Such heterogeneities are less marked in the strain fields displayed for R = 1.1. It doesn’t mean that they do not exist for R = 1.1, but as these heterogeneities in the strain field are not at all perennial, they can be visible in some snapshots and not in others, as those displayed in Figure 15.
Figure 16 presents the deviatoric strain fields for the proportional strain path with R = 0.8 controlled with the parameter σ1− σ2/R. Similarly to the loading path fully strain controlled (Fig. 15), no particular
localization in the strain field is discernable. Hence the choice of the control parameter does not influence the failure mode (here diffuse), as concluded from the drained compression path.
Deviatoric strain fields presented in Figure 15 and 16 for MD sample along proportional strain paths should be compared with those plotted for the drained compression path in Figure 13, where shear bands completely develops. Consequently, it appears for sample MD that shear band development is importantly frustrated along proportional strain paths (at least for the values of R tested), even when the granular assembly reaches stress states located on the Mohr-Coulomb limit condition (i.e. when reaching limit stress states), as it is the case for instance in snapshots 7-8 for R = 1.1 (to be compared with snapshots 7-10, in Fig 13, along the drained compression path). This frustration seems to increase with the imposed dilatancy (i.e. with decreasing values of R). For sample D, the densest sample, results are in contrast with these latter and density of the medium seems to be a predominant factor over the loading direction. In other words, it would mean that for a very dense granular medium vanishing of the acoustic tensor, inside the plastic tensorial zones, is very little dependent (or maybe even not dependent) on the loading direction.
R = 0.8 1-2 3-4 5-6 7-8 R = 0.9 1-2 3-4 5-6 7-8 R = 1.0 1-2 3-4 5-6 7-8 R = 1.1 1-2 3-4 5-6 7-8
Figure 15: Incremental deviatoric strain fields for the proportional strain loading paths performed on sample MD with R = 0.80; 0.90; 1.00; 1.10, incremental fields are computed between numbered snapshots identified in Fig. 7.
Author-produced version of the article published in Journal of the Mechanics and Physics of Solids, 75:119-139.
5. Micro-structural elements involved in the definition of limit states
As explained in Section 3.3, limit states can be identified by using the second order work criterion. This is valid for an homogeneous problem, but also in heterogeneous cases (in boundary value problems, or when strain localization and failure occur in an uniformly loaded sample) where the second order work can be computed locally, leading then to heterogeneous fields of second order work (Laouafa and Darve, 2002; Lignon et al., 2009). The computation of local values of second order work for the simulations presented in this paper and performed from discrete element models would require to compute homogenized stress fields in addition to strain field (with the tricky point that homogenized stress and strain are generally not expressed at the same material point). Consequently, we take advantage here of the micro-mechanical expression of the second order work proposed by Nicot et al. (2012a) for granular media:
W2= 1 V X contacts d ~fc. d~lc + X particles d ~fp. d~xp (11)
where d ~fc and d~lc are the increments of the contact force and of the branch vector (joining the centres of particles in contact) respectively experienced by each contact during an external loading increment. In the same way, d ~fp and d~xp are the increments of the unbalanced force on the particle and of its position
respectively experienced by each particle during the loading increment.
The development of this micro-mechanical expression of the second order work is based on the second time derivative of the average stress tensor over a grain assembly:
σij= 1 V X contacts ficlcj + X particles fipxpj (12)
Equation 12 stems from the classical Love-Weber formula (Love 1927; Weber 1966; see details of the deriva-tion in Nicot et al. 2012a). Inertial effects on the average stress are taken into account through the second term of Equation 12. This term vanishes if all particles are in static equilibrium. The discrete form of the
second order work is presented here in the general case where such inertial effects are taken into account. This leads to the second summation in Equation 11 involving the unbalance force ~fpacting on each particle.
Here again this latter term is nil for an ideally static loading. Although the deformation regime is only quasi-static for the numerical discrete simulations considered in this paper, the second summation involving the unbalance force ~fp is still negligible with respect to the first summation involving contact variables, as
shown in Hadda et al. (2013). Consequently, as displayed in Figure 17, the term 1/V P d ~fc. d~lcconstitutes for granular assemblies a rather good estimation of the second order work W2 for quasi-static deformation
regimes; and local values of W2 are in these conditions directly given by the product wc2= d ~fc. d~lc at each
contact.
From one hand limit states at the macroscopic scale are described by the second order work criterion W2≤ 0 (Figure 10). On the other hand the second order work depends on the value of w2c at each contact
(Figure 17). Therefore, contacts characterized by wc
2 ≤ 0 are those contributing to the fulfillment of the
second order work criterion and to the existence of a limit state at the macroscopic scale. We denotes c− the contacts for which wc
2 ≤ 0 (Hadda et al., 2013). Consequently, while a limit state is approaching and
eventually reached, it is expected that either the spatial density of c− contacts is increasing, or the intensity of wc2 (i.e. absolute magnitude |wc2|) for c− contacts is growing (or even both density and intensity are
increasing). Furthermore, Nicot et al. (2012b) have shown that the sharp increase in kinetic energy at the initiation time of effective failure from a limit state (i.e. under constant loading and control parameters) is quantitatively related to negative values of second order work. Hence, besides being related to the definition of limit state, c− contacts (and intensity of wc
2 for c− contacts) should be also involved in the bifurcation
towards the post-failure dynamic response regime when the failure is effectively triggered.
On the other hand, the failure mode may be either localized or diffuse, and the spatial distribution of c− is also expected to be in relation with the failure mode and thus with the incremental strain fields presented in Section 4. This point is analysed in this last section by investigating two kinds of field:
1. the spatial distribution of c− contacts, an example is given in Figure 18a where each dot represents a c− contact;
2. the field of intensity of wc
2 for c− contacts, i.e. we represent the absolute value of w2c when w2c ≤ 0
(positive values of wc
2 are discarded) as displayed in Figure 18b.
Figure 18 presents the distribution of c− contacts and the intensity fields of negative values of wc 2 for
the biaxial drained compression simulated with sample D. These diagrams should be compared with the incremental deviatoric strain fields displayed in Figure 11. Concerning the distribution of c− contacts, there is a densification from snapshots 1 − 2 to snapshots 2 − 3 (the limit state is reached at snapshot 3), without the multiple fine shear bands displayed in the strain field for snapshots 2 − 3 being visible here to
Author-produced version of the article published in Journal of the Mechanics and Physics of Solids, 75:119-139.
Figure 17: Comparison of the second order work W2with the term 1/VP d ~fc. d~lc, for the drained biaxial compression axially
strain controlled performed on sample D. The agreement is rather good up to an axial strain value about 0.013 (i.e. beyond the limit stress state). Then, at larger strains, particle rearrangements are more important and accompanied with the release of some inertial effects; the term involving the unbalance force d ~fpin Equation 11 is no more negligible and values of second
order work computed with 1/VP d ~fc. d~lcslightly differ from W 2.
the naked eye. Then from snapshots 3 to 6 distribution of c− contacts become heterogeneous with a denser concentration within a band corresponding to the shear band in the strain field. The band of high density of c− contacts is thicker than the shear band identifiable from the plot of the deviatoric strain field. However, in this last diagram the thickness of the band of light color (i.e. the thickness of the shear band) depends on the color scale chosen. By decreasing the maximum value of the color scale, high intensities of shear strain at the centre of the band will saturate but the width of the band will increase to reach the width of the band visible in the spatial distribution of c− contacts. Concerning the fields of intensity of negative values of w2c, these are in good agreement with the deviatoric strain fields, even for snapshots 2 − 3 where fine and multiple shear bands are present. Localization of negative values of second order work means that material points constituting the sample do not reach homogeneously a limit state, but some points located within the shear band reach such a limit state and may consequently enter into failure, whereas those located outside the shear band, move away from limit states as described by the lower density of c− contacts.
Similar results are obtained for the biaxial drained compression axially stress controlled on sample D (Figure 19) and for the classical drained compression on sample MD (Figure 20) and can be compared with the deviatoric strain fields displayed in Figures 12 and Figures 13 respectively. However, in these cases where more complicated patterns of shear strain localization develop, covering a wider zone of the sample surface, localization in the spatial distribution of c− contacts is not visible, and only a densification of c− contacts covering the whole granular assembly is observable (not shown for the biaxial compression on sample MD). Loss of homogeneity in the failure development is only visible when intensity of negative values of w2c is
1-2 2-3 3-4 4-5 5-6
(a)
2-3 4-5 5-6
(b)
Figure 18: Spatial distribution of c− contacts represented with dots (a), and field of intensity of wc2for c− contacts with a color
scale proportional to |wc
2|, these computations were made for the biaxial drained compression on sample D between numbered
snapshots identified in Fig. 2.
Consequently, there is clearly a densification of c− contacts when the limit stress state is approached and reached. This densification may be localized as the deviatoric strain field in the cases of highly contrasted shear band. The densification of c− contacts is accompanied with increasing intensities of negative values of wc
2, these latter presenting localization patterns in all the cases of localized failure investigated in this
paper. These results confirm, that the most important contribution in the fulfillment of the second order work criterion at the macroscopic scale comes from contacts involved in the shear bands, when a localized failure mode prevails.
Figure 21 presents the results for the proportional strain loading for R = 0.8 simulated with sample MD, they can be compared with the deviatoric strain fields displayed in Figure 15 and considered as staying quasi homogeneous. The distribution of c− contacts shows a slight densification while the generalized limit state is approaching, i.e. around snapshots 3 − 4 and 5 − 6. Note that the last snapshots (7 − 8) are characterized by an important loss of contacts in relation with the static liquefaction of sample. Hence the very low number of c− contacts in Figure 21 is essentially due to this loss of contacts, and not to a switch of contacts from negative to positive values of wc
2. Similarly, strongest negative values wc2 are increasing from 0.002 J for
snapshots 1 − 2 to about 0.01 J for snapshots 3 to 6. Consequently, here again the limit state is characterized by a densification and higher intensities of c− contacts. Concerning the failure mode, a slight localization of
Author-produced version of the article published in Journal of the Mechanics and Physics of Solids, 75:119-139.
(a)
1-2 5-6 6-7 8-9
(b)
Figure 19: Spatial distribution of c− contacts (a), and field of intensity of wc
2for c− contacts, for the biaxial drained compression
axially stress controlled on sample D; numbered snapshots are identified in Fig. 4a.
1-2 3-4 5-6
7-8 9-10
Figure 20: Field of intensity of wc
2 for c− contacts, for the biaxial drained compression on sample MD; numbered snapshots
1-2 3-4 5-6 7-8
(a)
1-2 3-4 5-6 7-8
(b)
Figure 21: Spatial distribution of c− contacts (a), and field of intensity of wc
2 for c− contacts, for the proportional strain
loading path applied on sample MD for R = 0.8; numbered snapshots are identified in Fig. 7c.
strongest negative values of wc2is distinguishable for the first loading increments in Figure 21. For snapshots 1 − 2 a double cross pattern (the second over the first cross) is slightly marked, and for snapshots 3 − 4 only the left part of this pattern is clearly visible (in agreement with some slightly higher deviatoric strains in the same zone for this increment). However, for further snapshots (from 5 to 8) strong negative values of wc
2 are more homogeneously distributed within the sample and no particular structure is visible. As for the
deviatoric strain field, the initial tendency to localization of negative values of second order work seems to be frustrated by the imposed loading conditions. To resume, contrary to the case of localized failure mode, c− contacts and strong negative values of wc
2 are here both spread rather homogeneously in the granular
assembly at the limit state. Hence, the whole granular assembly seems to be involved in the vanishing of the second order work and in the occurrence of the limit state, in agreement with a diffuse mode of failure.
6. Conclusion
Failure may develop from stress states either described by the plastic limit condition or strictly within this latter. We attempt to give a common and unified description and interpretation of conditions of failure occurrence and of its initial effective development, for both cases. Failure may occur from generalized limit states, and limit stress states (described by the plastic limit condition) are a particular case of generalized limit states where loading and control parameters are all stress components. Conditions for the effective triggering of failure from limit stress states and generalized limit states are identical: from a limit state, failure will effectively develop if the mechanical state of the granular assembly is controlled by the parameter
Author-produced version of the article published in Journal of the Mechanics and Physics of Solids, 75:119-139.
loading leads to a sudden change of a part of this external work into kinetic energy, corresponding to the bifurcation of the mechanical response from a pre-failure quasi-static one to a post-failure dynamic one. Besides, it has been shown in Nicot et al. (2012b) that second order work can be directly related to this burst of kinetic energy at the neighborhood of initiation time of effective failure.
Both modes of failure, either localized within the granular assembly forming then a system with failing bands and unloading zones; or diffuse within the whole granular assembly (as thoroughly investigated in Tordesillas et al. (2012)) are observable for failures initiated from generalized limit states. Failure mode seems to be independent of the choice of the control parameter, since this latter does not influence the loading path (i.e. the loading direction) and thus the mechanical constitutive relation. On the other hand, as the mechanical constitutive relation is generally dependent on the loading direction, localization of failure may be partially conditioned by the imposed loading path, even if the initial density of the granular assembly is a strongly determinant factor.
For quasi-static deformation regimes, the second order work can be expressed under a discrete form involving the inter-granular contact forces and branch vectors. Then, each contact can be characterized according to its contribution to the second order work at the scale of the granular assembly. c− contacts are defined as contacts contributing to the fulfillment of the second order work criterion in the sense that the local values of second order work associated with such contacts are nil or negative. Consequently, c− contacts can be seen from one hand as micro-structural elements involved in the definition of a limit state at the macroscopic scale. On the other hand, investigation of the spatial distribution of c− contacts, and more particularly of the field of intensity of second order work associated with c− contacts, showed that these contacts are also related to the failure mode (localized or diffuse). Local values of second order work strongly negative are homogeneously spread in the granular assembly when the failure is diffuse while they aggregate to form bands in agreement with the deviatoric strain field when the failure is localized. The agreement between shear strain localization patterns and local values of second order work have been shown previously in the framework of continuum mechanics, since Rice’s localization criterion implies the second order work criterion (Bigoni and Hueckel, 1991; Bigoni, 2000; Nicot and Darve, 2011). However it is the first time that this relation is recovered from a micro-mechanical expression of second order work. c− contacts does not suffice to describe and understand the mechanisms, at the mesoscale of force chains for instance,
involved in the loss of the load bearing capacity of a granular assembly (i.e. its failure). However they present the advantage to be defined at the lowest scale, the contact scale, and to be directly related to the notion of limit state defined at the macroscopic scale.
References
Alshibli, K., Sture, S., 2000. Shear band formation in plane strain experiments of sand. J. Geotech. Geoenviron. Eng. 126, 495–503.
Bigoni, D., 1996. On smooth bifurcations in non-associative elastoplasticity. J. Mech. Phys. Solids 44, 1337–1351.
Bigoni, D., 2000. Bifurcation and instability of non-associative elastopastic solids, in: Petryk, H. (Ed.), Material instabilities in elastic and plastic solids. Springer-Verlag, Wien New York. volume 414 of CISM courses and lectures, pp. 1–52. Bigoni, D., 2012. Nonlinear Solid Mechanics: Bifurcation Theory and Material Instability. Cambridge University Press. Bigoni, D., Hueckel, T., 1991. Uniqueness and localization- I. Associative and nonassociative elastoplasticity. Int. J. Solids
Structures 28, 197–213.
Borja, R., 2006. Condition for liquefaction instability in fluid-saturated granular soils. Acta Geotechnica 1, 211–224. Brannon, R., Drugan, W., 1993. Influence of non-classical elastic-plastic constitutive features on shock wave existence and
spectral solutions. Journal of the Mechanics and Physics of Solids 41, 297–330. doi:http://dx.doi.org/10.1016/0022-5096(93)90010-D.
Calvetti, F., Combe, G., Lanier, J., 1997. Experimental micromechanical analysis of a 2D granular material: relation between structure evolution and loading path. Mechanics of Cohesive-Frictional Materials 2, 121–163.
Chambon, R., Caillerie, D., 1999. Existence and uniqueness theorems for boundary value problems involving incrementally non-linear models. Int. J. Solids Structures , 5089–5099.
Cundall, P., Strack, O., 1979. A discrete numerical model for granular assemblies. Geotechnique 29, 47–65.
Daouadji, A., Darve, F., Al Gali1, H., Hicher, P., Laouafa, F., Lignon, S., Nicot, F., Nova, R., Pinheiro, M., Prunier, F., Sibille, L., Wan, R., 2011. Diffuse failure in geomaterials: Experiments, theory and modelling. Int. J. Numer. Anal. Meth. Geomech. 35, 1731–1773.
Darve, F., 1990. Geomaterials Constitutive Equations and Modelling. Taylor and Francis books. chapter Incrementally non-linear relationships. pp. 213–238.
Darve, F., Servant, G., Laouafa, F., Khoa, H., 2004. Failure in geomaterials : continuous and discrete analyses. Computer Meth. Appl. Mech. Eng. 193, 3057–3085.
Darve, F., Sibille, L., Daouadji, A., Nicot, F., 2007. Bifurcations in granular media : macro- and micro-mechanics approaches. Comptes Rendus M´ecanique 335, 496–515.
Desrues, J., 1990. Shear band initiation in granular materials : experimentation and theory, in: Darve (Ed.), Geomaterials Constitutive Equations and Modelling, Elsevier. Taylor and Fancis Books. pp. 283–310.
Desrues, J., Viggiani, G., 2004. Strain localization in sand: an overview of the experimental results obtained in grenoble using stereophotogrammetry. Int. J. Numer. Anal. Meth. Geomech. 28, 279–321.
Hadda, N., Nicot, F., Bourrier, F., Sibille, L., Radjai, F., Darve, F., 2013. Micromechanical analysis of second order work in granular media. Granular matter 15, 221–235.
Han, C., Vardoulakis, I., 1991. Plane strain compression experiments on water-saturated fine-grained sand. G´eotechnique 41, 49–78.
Hill, R., 1958. A general theory of uniqueness and stability in elastic-plastic solids. J. of the Mech. and Phys. of Solids 6, 239–249.
Author-produced version of the article published in Journal of the Mechanics and Physics of Solids, 75:119-139.
conservative structural system: buckling and vibration analysis. Int. J. Solids Structures 50, 363–370.
Lignon, S., Laouafa, F., Prunier, F., Khoa, H., F., D., 2009. Hydro-mechanical modelling of landslides with a material instability criterion. G´eotechnique 59, 513–524.
Love, A., 1927. A treatise on the mathematical theory of elasticity. Cambridge University Press, Cambridge.
Mohr, D., Dunand, M., Kim, K.H., 2010. Evaluation of associated and non-associated quadratic plasticity models for advanced high strength steel sheets under multi-axial loading. International Journal of Plasticity 26, 939 – 956. doi:http://dx.doi.org/10.1016/j.ijplas.2009.11.006.
Nicot, F., Darve, F., 2011. Diffuse and localized failure modes: two competing mechanisms. Int. J. Numer. Anal. Meth. Geomech. 35, 586–601.
Nicot, F., Darve, F., Khoa, H., 2007. Bifurcation and second order-work in granular materials. Int. J. Numer. Anal. Meth. Geomech. 31, 1007–1032.
Nicot, F., Hadda, N., Bourrier, F., Sibille, L., Wan, R., Darve, F., 2012a. Inertia effects as a possible missing link between micro and macro second-order work in granular media. Int. J. of Solids and Structures 49, 1252–1258.
Nicot, F., Sibille, L., Darve, F., 2012b. Failure as a bifurcation toward a dynamic regime. Int. J. of Plasticity 29, 136–154. Nova, R., 1994. Controllability of the incremental response of soil specimens subjected to arbitrary loading programmes. J.
Mech. behav. Mater. 5, 193–201.
Osinov, V., Wu, W., 2005. Instability and ill-posedness in the deformation of plastic solids: some correlations through simple examples, in: Wang, Y., Hutter, K. (Eds.), Trends in Applications of Mathematics to Mechanics, Shaker Verlag, Aachen. pp. 361–370.
Petryk, H., 1992. Material instability and strain-rate discontinuities in incrementally nonlinear continua. Journal of the Mechanics and Physics of Solids 40, 1227–1250. doi:http://dx.doi.org/10.1016/0022-5096(92)90014-S.
di Prisco, C., Nova, R., 1994. Stability problems related to static liquefaction of loose sand. Localisation and Bifurcation Theory for Soils and Rocks Chambon, Desrues, Vardoulakis (eds), Balkema, 59–70.
Raniecki, B., Bruhns, O., 1981. Bounds to bifurcation stresses in solids with non-associated plastic flow law at finite strain. J. Mech. Phys. Solids 29, 153.
Rice, J., 1976. The localization of plastic deformation, in: Koiter, W. (Ed.), Theoretical and Applied Mechanics, North-Holland Publishing Compagny, Delft. pp. 207–220.
Rice, J., Rudnicki, J., 1980. A note on some features of the theory of localization of deformations. Int. J. Solids Structures 16, 597–605.
Runesson, K., Mroz, Z., 1989. A note on nonassociated plastic flow rules. International Journal of Plasticity 5, 639–658. doi:http://dx.doi.org/10.1016/0749-6419(89)90005-3.
Sibille, L., Froiio, F., 2007. A numerical photogrammetry technique for measuring microscale kinematics and fabric in schneebeli materials. Granular Matter 9, 183–193.
Environmental and Civil Engineering 13, 187–201.
Sladen, J., D’Hollander, R., Krahn, J., 1985. The liquefaction of sands, a collapse surface approach. Can. Geotech. J. 22, 564–578.
Stoughton, T., Yoon, J., 2009. Anisotropic hardening and non-associated flow in proportional loading of sheet metals. Inter-national Journal of Plasticity 25, 1777–1817. doi:http://dx.doi.org/10.1016/j.ijplas.2009.02.003.
Taherizadeh, A., Green, D., Yoon, J., 2011. Evaluation of advanced anisotropic models with mixed hardening for general associated and non-associated flow metal plasticity. International Journal of Plasticity 27, 1781 – 1802. doi:http://dx.doi.org/10.1016/j.ijplas.2011.05.001.
Tordesillas, A., Pucilowski, S., Sibille, L., Nicot, F., Darve, F., 2012. Multiscale characterisation of diffuse granular failure. Philosophical Magazine 92, 4547–4587.
Valanis, K., 1985. On the uniqueness of solution of the initial value problem in softening materials. J. Applied Mechanics 52, 649–653.
Weber, J., 1966. Recherches concernant les contraintes intergranulaires dans les milieux pulv´erulents. Bulletin de Liaison des Ponts-et-Chauss´ees 20, 1–20.
Author-produced version of the article published in Journal of the Mechanics and Physics of Solids, 75:119-139.