an author's https://oatao.univ-toulouse.fr/27040
https://doi.org/10.2514/6.2016-2929
Gojon, Romain and Bogey, Christophe Azimuthal organisation of turbulent structures in underexpanded impinging round jets. (2016) In: 22nd AIAA/CEAS Aeroacoustics Conference, 30 May 2016 - 1 June 2016 (Lyon, France).
Azimuthal organisation of turbulent structures
in underexpanded impinging round jets
Romain Gojon
1,2,∗and Christophe Bogey
1,†1. Laboratoire de M´ecanique des Fluides et d’Acoustique UMR CNRS 5506, Ecole Centrale de Lyon
69134 Ecully, France
2. Department of Mechanics, Royal Institute of Technology (KTH) Linn´e FLOW Centre
Stockholm, Sweden
The azimuthal organisation of the turbulent structures in underexpanded round jets impinging on a flat plate have been investigated using compressible large eddy simulation. The jet shear-layer region, as well as the region of the wall jets created on the plate after the impact are considered. The jets are characterized by a Nozzle Pressure Ratio of 4.03, a fully expanded Mach number of 1.56, and a Reynolds number of 6 × 10⁴
. The distance between the nozzle and the plate varies from 4.16r0 to 9.32r0. The jets generate acoustic
tones due to a feedback mechanism. In this paper, the near pressure and density fields of the jets are analysed using Fast Fourier Transform on the nozzle exit plane, the plate, and an azimuthal plane. The amplitude and the phase fields on these sections at the tone frequencies are represented. Similar organisations of the turbulent structures are found in the jet shear layers and the wall jets. Thus, axisymmetric and helical arrangements of the structures in the shear layers lead to concentric and spiral distributions of the structures on the plate, respectively. In particular, for one of the jets, a spiral shape and concentric rings, associated with two tone frequencies generated simultaneously, are observed on the flat plate in the pressure and density phase fields. Moreover, the convection velocity of the turbulent structures on the plate is evaluated from the phase fields. Several diameters away from the jet axis, the velocities found for the present jets compare well with those found experimentally in the phase-averaged distributions of fluctuating pressure for impinging ideally expanded jets using fast-response Pressure-Sensitive Paint. Near the jet axis, given that the present jets are underexpanded, differences are observed, due to the presence of shock cell structures in the jets. Finally, the convection velocity of the turbulent structures on the wall are estimated from cross-correlations of radial velocity. The values obtained compare well with those determined from the phase fields.
I.
Introduction
Very intense tones have been observed experimentally by Powell1 and Wagner2, among others, in the
acoustic field of high subsonic and supersonic jets impinging on a flat plate. Powell1 suggested that such
tones are generated by an aeroacoustic feedback mechanism between the turbulent structures propagating downstream from the nozzle to the plate and the acoustic waves propagating upstream from the plate to the nozzle.
For subsonic impinging round jets, the tone frequencies can be predicted by the model proposed by Ho & Nosseir3and Nosseir & Ho4. Round supersonic jets impinging on a flat plate normally have been investigated
experimentally by Henderson & Powell5, Krothapalli et al.6and Henderson et al.7 In some cases, a feedback
mechanism is observed as in subsonic jets. This is very often the case when the jet is ideally expanded, but this ∗PhD, now PostDoc at KTH Mechanics, [email protected]
happens only for some nozzle-to-plate distances when the jet is imperfectly expanded. Henderson & Powell5
suggested that, in the latter case, the feedback loop establishes only when a Mach disk forms just upstream from the plate. Recirculation zones were also observed between this Mach disk and the flat plate for some nozzle-to-plate distances by Krothapalli et al.6. More recently, for underexpanded impinging jets, Risbord
& Soria8 explored the instability modes of the jets using ultra-high-speed Schlieren and shadowgraphy
techniques. Axial and helical modes were visualised and the Mach disk located just upstream from the plate was found to oscillate. For similar jets, Buchmann et al.9 pointed out the periodic formation of large-scale
structures in the jet shear layers using a high spatial resolution Schlieren imaging. The complete feedback mechanism was visible, namely large-scale structures in the shear layers propagating downstream from the nozzle to the plate and acoustic waves propagating upstream from the plate to the nozzle. Mitchell et al.10 studied the periodic oscillation of the shear layer of underexpanded impinging jets using time-resolved
Schlieren image sequences. Finally, Davis et al.11 studied the wall pressure oscillations in ideally expanded
impinging jets using a fast-response Pressure-Sensitive Paint on the plate. They identified tone frequencies associated with axisymmetrical and helical oscillation modes of the jets thanks to phase-conditioned Schlieren images. For such modes, they presented the phase-averaged distributions of the fluctuating pressure on the flat plate. The turbulent structures organized axisymmetrically or helically in the jet shear layers were shown to persist after the impact, as they propagate radially in the wall jets, even several diameters away from the jet axis.
In the present study, the azimuthal organisation of turbulent structures in the jet shear-layers and on the flat plate, in the wall jet created after the impact, are studied from data provided by large eddy simulations. The jets are defined by a Nozzle Pressure Ratio of 4.03, a fully expanded Mach number of 1.56, an exit Mach number of 1, and a Reynolds number of 6 × 10⁴. Their aerodynamics and acoustic properties have
been analysed previously in detail in Gojon et al.12 The near pressure and density fields of the jets are
explored in the present paper using Fast Fourier Transform. In particular, the spatial organisation and the convection velocity of the turbulent structures located in the wall jet created on the plate after the impact are examined. The results are compared with the experimental phase-averaged distributions of the fluctuating pressure of Davis et al.11 for ideally expanded supersonic impinging round jets. For the present
underexpanded jets, the presence of shock-cell structures is expected to affect the radial propagation of the structures on the plate. The paper is organised as follows. The numerical methods and the jet properties are presented in section II. An analysis of the turbulent structures in the jet shear-layers and in the wall jets is performed in section III by plotting the amplitude and phase fields of the pressure and density fields at the tone frequencies. Concluding remarks are finally given in section IV.
II.
Parameters
II.A. Numerical parameters
In the LES, the unsteady compressible Navier-Stokes equations are solved using cylindrical coordinates (r, θ, z) with an explicit six-stage Runge-Kutta algorithm for time integration, and low-dissipation and low-dispersion explicit eleven-point finite differences for spatial derivation13,14. At the end of each time step, a high-order
filtering is applied to the flow variables in order to remove grid-to-grid oscillations and to dissipate subgrid-scale turbulent energy15,16. The radiation conditions of Tam & Dong17are implemented at the boundaries
of the computational domain, in combination with a sponge zone at the outflow boundaries combining grid stretching and Laplacian filtering to damp turbulent fluctuations before they reach the boundaries. Adia-batic conditions are imposed at the nozzle walls and at the flat plate. Finally, a shock-capturing filtering is applied in order to avoid Gibbs oscillations near shocks18. The axis singularity is treated with the method
proposed by Mohseni & Colonius19. A reduction of the effective resolution near the origin of the polar
coordinates is also implemented20. Finally, a forcing21is added in the boundary layer in the nozzle in order
to generate velocity fluctuations at the nozzle exit.
The simulations are carried out using an OpenMP-based in-house solver, and a total of 180, 000 iterations are performed in each case after the transient period. The simulation time is thus equal to 1000r0/uj. The
cylindrical meshes contain between 171 and 217 million points, as reported in Table 1. They have been designed in order to allow acoustic waves with Strouhal numbers up to St = f Dj/uj = 6.4 to be well
nr nθ nz number of points
JetL4 500 512 668 171 × 106
JetL5 500 512 764 195 × 106
JetL7 500 512 780 200 × 106
JetL9 500 512 847 217 × 106
Table 1. Mesh parameters: number of points nr, nθ and nz in the radial, azimuthal and axial direction, and total
number of points.
II.B. Jets properties
In this section, the main jet properties are provided. More informations can be found in Gojon et al.12
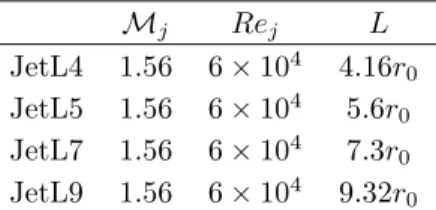
The jets originate from a pipe nozzle of radius r0, whose lip is 0.1r0 thick. The nozzle-to-plate distances L
are respectively equal to 4.16r0, 5.6r0, 7.3r0 and 9.32r0, as shown in table 2. The jets are thus referred to
as JetL4, JetL5, JetL7 and JetL9. They have an ideally expanded Mach number of Mj = uj/aj = 1.56,
where uj and aj are the exit velocity and the speed of sound in the ideally expanded equivalent jet. Their
Reynolds number is Rej = ujDj/ν = 6 × 10⁴, where Dj is the nozzle diameter of the ideally expanded
equivalent jet and ν is the kinematic molecular viscosity. The exit Mach number is Me= ue/ae= 1, where
ueand aeare the exit velocity and the speed of sound in the jet. At the nozzle exit, a Blasius mean velocity
profile is imposed with a boundary-layer thickness of 0.15r0. The ejection conditions of the jets and the
nozzle-to-plate distances are similar to those in the experimental study of Henderson et al.7
Mj Rej L JetL4 1.56 6 × 10⁴ 4.16r 0 JetL5 1.56 6 × 10⁴ 5.6r 0 JetL7 1.56 6 × 10⁴ 7.3r 0 JetL9 1.56 6 × 10⁴ 9.32r 0
Table 2. Jet parameters: ideally expanded Mach number Mj, Reynolds number Rej, and nozzle-to-plate distance L.
III.
Results
III.A. Snapshots
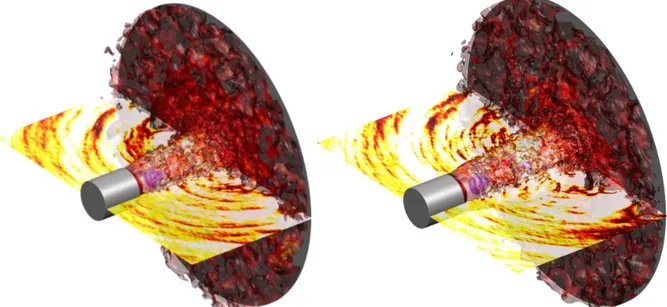
In order to illustrate the flow fields of the present impinging jets, isosurfaces of density obtained for JetL5 and JetL7 are displayed in figure 1. Shock-cell structures can be seen in the two jets between the nozzle exit and the flat plate. The jet mixing layers and the wall jets developing on the flat plate in the radial direction are well visible. Moreover, both large-scale structures and small-scale vortical structures appear in the mixing layers, in agreement with the Reynolds number Rej of 6 × 10⁴. The pressure fields in the plane
θ = 0 are also represented in figure 1 in order to show the near acoustic field of the jets. The acoustic waves seem to come mainly from the region of jet impact on the flat plate.
III.B. Tone frequencies
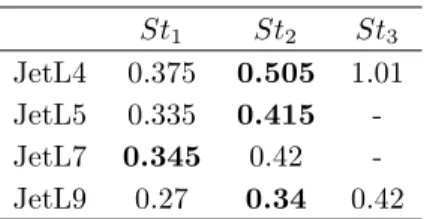
The sound pressure levels obtained in the vicinity of the nozzle at r = 2r0 and z = 0 are plotted in figure 2
as functions of the Strouhal number St = f Dj/uj. They reveal several tone frequencies. The Strouhal
numbers of the tones whose levels are 5 dB higher than the broadband noise are reported in table 3. As detailed in Gojon et al.12, these tones are generated by an aeroacoustic feedback mechanism occurring
between the nozzle and the plate, consisting of two steps. First, in the jet shear layers, a turbulent structure is convected in the downstream direction from the nozzle exit to the flat plate. The structure impinges on the plate, and generates an acoustic wave propagating upstream. This wave is reflected back by the nozzle lip, which excites the shear layer, and leads to the formation of a new turbulent structure. The time period of this loop can thus be determined from the convection speed of the shear-layer structures, the speed of the upstream-propagating acoustic waves and the nozzle-to-plate distance. Ho & Nosseir3 proposed, for
Figure 1. Isosurfaces of density for (a) JetL5 and (b) JetL7. The blue and red isosurfaces are obtained for the values of 0.8 and 2.5 kg.m−3, respectively. The isosurfaces of 1.25 kg.m−3are also represented, colored by the Mach number.
The pressure field in the plane θ = 0 is shown. The nozzle and the plate are in grey.
10−1 100 120 140 160 180 (a) St = fDj/uj S P L (dB / S t) 10−1 100 120 140 160 180 (b) St = fDj/uj S P L (dB / S t) 10−1 100 120 140 160 180 (c) St = fDj/uj S P L (dB / S t) 10−1 100 120 140 160 180 (d) St = fDj/uj S P L (dB / S t)
Figure 2. Sound pressure levels at r = 2r0 and z = 0 as functions of the Strouhal number for (a) JetL4, (b) JetL5,
N f = L < uc> + L a0 (1) where < uc > is the mean convection velocity of the turbulent structures in the shear layers between the
nozzle and the plate, a0is the speed of sound in the ambient medium, and N is the mode number indicating
the number of times the feedback mechanism occurs during the fundamental period. St1 St2 St3
JetL4 0.375 0.505 1.01 JetL5 0.335 0.415 -JetL7 0.345 0.42 -JetL9 0.27 0.34 0.42
Table 3. Strouhal numbers emerging in the pressure spectra of figure 2. The Strouhal numbers of the dominant tones are in bold.
A very good agreement has been found between the tone frequencies of the present simulated jet, those found in the experimental study of Henderson et al.7, and the frequencies predicted by the relation (1).
More details can be found in Gojon et al.12.
III.C. Properties of the near pressure and density fields
In the LES, pressure has been recorded every 50thtime step in the planes z = 0, z = L and θ = 0. Moreover,
density has also been stored every 50thtime step in the plane z = L. For each plane, the results are arranged
in M × N matrices: Pall= P1 1 P12 . P1N P1 2 P22 . P2N . . . . P1 M PM2 . PMN (2)
where N is the number of samplings, and M is the total number of points in the plane. The pressure or density field obtained at a given time is thus provided by one column of the corresponding matrix. A Fast Fourier Transform is applied to each row of the matrices Pall. In this way, for a given frequency, the
amplitude fields and the phase fields can be displayed. Informations on the oscillation modes of the jet are given by the phase field, and informations on the sound sources are provided by the amplitude and phase fields.
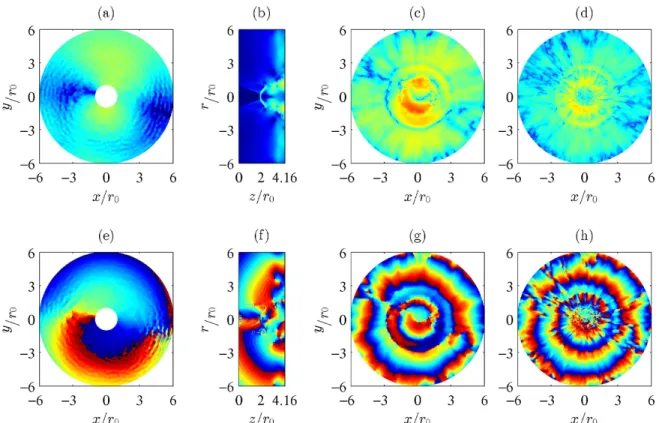
For JetL4, the properties obtained at the two main tone frequencies at St1= 0.375 and St2= 0.505 are
examined in figures 3 and 4, respectively. For St1= 0.375, the amplitude and phase fields of the fluctuating
pressure at z = 0 are given in figures 3(a,e). The amplitude field do not exhibit a clear pattern. On the contrary, the phase field shows two opposite regions out of phase near the jet axis followed by a spiral shape of isophase surfaces. This indicates an helical organisation of the acoustic waves. In the plane θ = 0, in the phase field in figure 3(f), a 180-degree phase shift is visible with respect to the jet axis, suggesting a sinuous or helical oscillation mode of the jet. More precisely, using a Fourier decomposition of the fluctuating pressure on 32 sensors regularly spaced in the azimuthal direction at z = 0 and r = 2r0, the mode is found
to be helical. Therefore, the feedback mechanism is organised helically at the frequency St1= 0.375. The
amplitude and phase fields of the fluctuating pressure obtained on the plate, at z = 4.16r0 are reported in
figures 3(c,g). The amplitude field exhibits a region of high intensity for r < 2.6r0, in the region located
inside the jet, under the Mach disk and the annular oblique shock. The phase field, in figure 3(g), shows a spiral shape which extends over the entire domain. At z = 4.16r0, the amplitude and phase fields of the
fluctuating density on the plate are presented in figures 3(d,h). They exhibit the same behaviour as that of the pressure fluctuations. The turbulent structures organized helically in the jet shear layers at the tone frequency St1= 0.375 impinge on the plate and this organisation seems to persist as they propagate radially
on the plate.
For St2 = 0.505, the amplitude and phase fields of the fluctuating pressure and fluctuating density are
represented in figure 4. The amplitude and phase fields of the fluctuating pressure obtained on the plane z = 0 are given in figures 4(a,e). The acoustic waves appear to be organized in a axisymmetric manner.
Figure 3. Amplitude (top) and phase (bottom) fields obtained for JetL4 at the tone frequency St1 = 0.375; from
pressure (a,e) at z = 0, (b,f ) at θ = 0 and (c,g) at z = L; from density (d,h) at z = L.
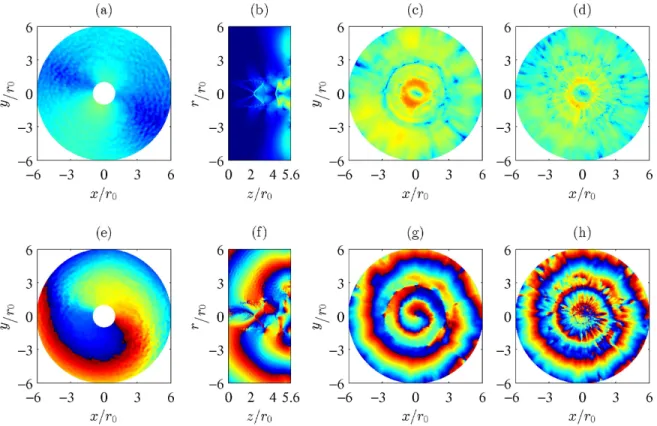
Figure 4. Amplitude (top) and phase (bottom) fields obtained for JetL4 at the dominant tone frequency St2= 0.505;
The amplitude field in the plane θ = 0 of figure 4(b) reveals a cell structure between the nozzle and the plate, containing three cells. This structure has been described in Gojon et al.22. It is due to the generation
of an hydrodynamic-acoustic standing wave by the aeroacoustic feedback mechanism. The number of cells correspond to the mode number of the feedback mechanism in the model of Ho & Nosseir3. The phase
field, in figure 4(b), exhibits a symmetric organisation with respect to the jet axis, corresponding to an axisymmetric oscillation mode of the jet. Thus, the feedback mechanism is organised axisymmetrically at the frequency St2 = 0.505. In figures 4(g) and 4(h), in the phase fields of the fluctuating pressure and of
the fluctuating density on the plate, concentric rings are observed. These rings may be associated with the radial propagation, on the plate, of the coherent structures organised axisymmetrically in the jet shear layers at St2= 0.505.
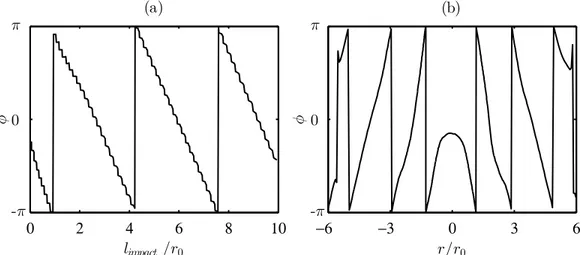
In order to confirm the two hypotheses above, phase profiles are represented in figure 5. The first profile considered is the phase profile obtained in the θ = 0 plane, along the black line visible in the phase field of figure 4(f). It is represented in figure 5(a) as a function of the distance limpact from the point located on
the wall at z = 3r0. This point was chosen as it corresponds to the location of the source of the acoustic
component radiating in the far field, see in Gojon et al.12 The maxima in the phase profile in figure 5(a)
are located at limpact= 1.0r0, 4.25r0 and 7.6r0, giving wavelengths of 3.25r0and 3.35r0. The corresponding
phase speeds are 327 m.s−1 and 338 m.s−1, respectively. They correspond to the ambient sound speed, as
expected for acoustic waves. In figure 5(b), the phase profile obtained in the z = L plane along the black line shown in the phase field of figure 4(g) is plotted as a function of the radial coordinate. The wavelength of the concentric rings visible in figures 4(g,h) can thus be measured. The wavelength between the first and the second maxima is 1.75r0 and the wavelength between the second and the third maxima is 2.15r0. The
corresponding phase speeds are equal to 0.40uj and 0.49uj, respectively. Given those values, the oscillations
obtained at the wall cannot be acoustic waves, but are associated with the radial convection of turbulent structures in the wall jet.
0 2 4 6 8 10 limpact /r0 φ (a) -π 0 π −6 −3 0 3 6 r/r0 φ (b) -π 0 π
Figure 5. Profiles obtained for JetL4 at St2 = 0.505, (a) in the plane θ = 0 along the black line represented in the
phase field of figure 4(f ), and (b) in the plane z = L along the black line represented in the phase field of figure 4(g).
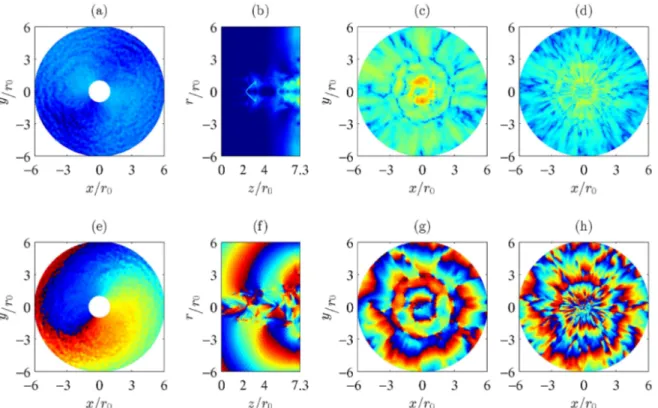
For JetL5, the amplitude and phase fields obtained for the two main tone frequencies at St1= 0.335 and
St2 = 0.415 are showed in figures 6 and 7, respectively. Given the pattern of the phase fields at z = 0 and
θ = 0 in figures 6(e,f) and 7(e,f), these two tones appear to be associated with helical oscillation modes. Moreover, in the phase fields of figures 6(g,h) calculated on the plate for St1 = 0.335 and in figures 7(g,h)
for St1 = 0.415, spiral shapes are visible over the entire domain. As for the tone frequency St1 = 0.375
of JetL4, these shapes are due to the radial propagation on the plate of the turbulent structures organized helically in the jet shear layers.
For JetL7, the amplitude and phase fields obtained for the main tone frequency at St1= 0.345 are given
in figure 8. It can be seen from the phase fields in the planes z = 0 and θ = 0 in figures 8(e,f) that this tone is linked to an helical jet oscillation mode. The results on the plane z = L show spurious noise because the amplitude of the tone is low compared to the level of tones reported for JetL4 and JetL5 in figure 2. Nevertheless, a spiral shape can be seen in the two phase fields in figures 8(g,h), especially in the phase field of the density field. This shape results from the radial propagation on the plate of the turbulent structures
Figure 6. Amplitude (top) and phase (bottom) fields obtained for JetL5 at the tone frequency St1 = 0.335; from
pressure (a,e) at z = 0, (b,f ) at θ = 0 and (c,g) at z = L; from density (d,h) at z = L.
Figure 7. Amplitude (top) and phase (bottom) fields obtained for JetL5 at the dominant tone frequency St2= 0.415;
organized helically in the jet shear layers.
Figure 8. Amplitude (top) and phase (bottom) fields obtained for JetL7 at the dominant tone frequency St1= 0.345;
from pressure (a,e) at z = 0, (b,f ) at θ = 0 and (c,g) at z = L; from density (d,h) at z = L.
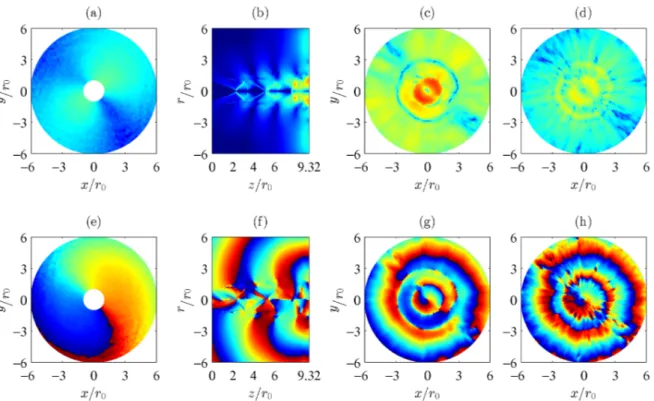
For JetL9, the amplitude and phase fields for the main tone frequency at St2 = 0.34 are represented
in figure 9. Given the phase fields in the planes z = 0 and θ = 0 in figures 9(e,f), the tone appears to be associated with an helical oscillation mode of the jet. On the plane z = L, spiral shapes are visible in the phase fields, in figures 9(g,h). This indicates a radial propagation on the plate of the turbulent structures organized helically in the jet shear layers.
In order to give further insight into the convection velocity of the structures organised helically in the wall jets for all the jets, the density phase fields on the plate are investigated in the same way as for JetL4 in figure 5. First, let us consider two regions of interest. The first on is near the jet axis over 0 < r < 3r0, and
the second one is several diameter away over 3r0< r < 6r0. The mean wavelengths are extracted from the
phase fields in each of the two regions. The results for the tone frequencies of JetL4, JetL5 and JetL9 are given in table 4. However, the phase fields of the density fields for the dominant tone frequency of JetL7 at St1= 0.345 and for the tone frequency of JetL5 at St1= 0.335 are too noisy, and do not provide converged
results. The results found in figure 5 for the dominant tone frequencies of JetL4 at St2= 0.505 are added.
Jet St uc for 0 < r < 3r0 uc for 3r0< r < 6r0
JetL4 St1= 0.375 uc = 0.27uj uc= 0.40uj
JetL4 St2= 0.505 uc = 0.40uj uc= 0.49uj
JetL5 St2= 0.415 uc = 0.35uj uc= 0.47uj
JetL9 St2= 0.34 uc = 0.34uj uc= 0.46uj
Table 4. Mean convection velocities of the turbulent structures in the wall jets for different main tone frequencies.
Over 3r0< r < 6r0, the convection velocity of the turbulent structures on the wall varies between 0.40uj
and 0.49uj for the present jets. Those results are in agreement with the experimental measurements of
Davis et al.11 for impinging supersonic ideally expanded round jets. In the phase averaged distributions
of the fluctuating pressure, these authors found a convection velocity of the turbulent structures on the wall equals to 0.47uj several diameters away from the jet axis by using Pressure-Sensitive Paint on the flat
Figure 9. Amplitude (top) and phase (bottom) fields obtained for JetL9 at the dominant tone frequency St2= 0.34;
from pressure (a,e) at z = 0, (b,f ) at θ = 0 and (c,g) at z = L; from density (d,h) at z = L.
turbulent structures in the jet shear layer. Indeed, the velocity < uc> was found to be between 0.54uj and
0.59uj for the present jets. Over 0 < r < 3r0, the convection velocity of the turbulent structures on the
wall varies between 0.27uj and 0.40uj in the four jets. These values are lower than the value 0.56uj found
experimentally by Davis et al.11 in this region of the plate. This difference can be due to the fact that the
present jets are non-ideally expanded, leading to the formation of a Mach disk or to the presence of oblique shocks upstream from the plate, see in Gojon et al.12 Thus, the jet shear layers are deviated and impinge
on the plate at r ≃ 2r0. Consequently, the mean convection velocities computed near the jet axis do not
correspond to the convection velocity of the turbulent structures, as the motion of these structures is not only radial in this region. On the contrary, in an ideally expanded jet, the turbulent structures in the jet shear layers impinge near the jet axis as observed by Krothapalli et al.6and Davis et al.11Finally, for JetL4,
in the region 3r0< r < 6r0, the convection velocity of the turbulent structures organised axisymmetrically
at the tone frequency St2= 0.505 is 18% higher than the the convection velocity of the turbulent structures
organised helically at St1= 0.375.
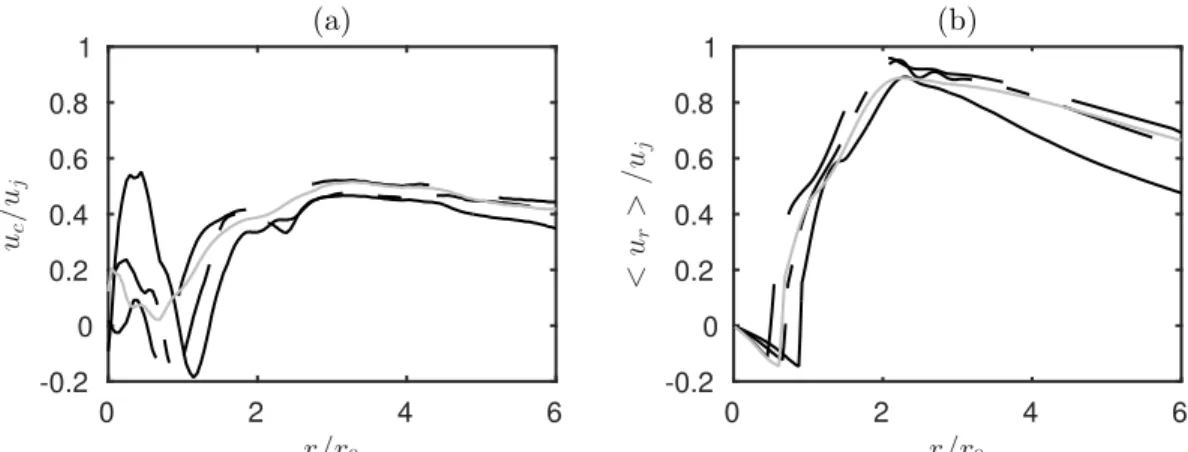
The convection velocity in the wall jets is now computed from radial velocity cross-correlations at one mesh upstream from the plate. The results are represented in figure 10(a) as a function of the radial position between r = 0 and r = 6r0. The maximal mean radial velocity in the wall jets is also provided in figure 10(b).
In figure 10(a), the mean convection velocity for r ≥ 3r0 is of about 0.45uj in the four jets. This result is
in good agreement with the convection velocities found from the phase fields for the structures organized axisymmetrically or helically, which are given in table 4. In the region r ≤ 3r0, for JetL4, JetL5 and JetL7, a
region of negative convection velocity appears around r = r0. In this region, the turbulent structures travel
toward the jet axis. This is due to the presence of a recirculation zone near the region of impact, observed experimentally for similar jets by Krothapalli et al.6 This recirculation zone is visible in figure 10(b) with a
negative mean radial velocity for r < r0. It is responsible for the difference in the region 0 < r < 3r0between
the convection velocities found from the phase fields of the present underexpanded jets and those measured in the phase averaged distributions of the fluctuating pressure of the ideally expanded jets of Davis et al.11
r/r0 0 2 4 6 uc / uj -0.2 0 0.2 0.4 0.6 0.8 1 (a) r/r0 0 2 4 6 < ur > / uj -0.2 0 0.2 0.4 0.6 0.8 1 (b)
Figure 10. (a) Convection velocity computed from the cross-correlations of radial velocity fluctuations and (b) maximal radial velocity in the wall jet as functions of the radial coordinate for JetL4, . JetL5, JetL7,
and JetL9.
IV.
Conclusion
In this paper, the azimuthal organisation of the turbulent structures in underexpanded impinging round jets has been studied using compressible large eddy simulation. This organisation is studied in the jet shear-layers but also on the flat plate, in the wall jet created after the impact. The jets are characterized by a Nozzle Pressure Ratio of 4.03, a fully expanded Mach number of 1.56, and a Reynolds number of 6 × 10⁴.
The distance between the nozzle and the plate varies from 4.16r0 to 9.32r0. Shock cell structures and
acoustic waves coming from the region of jet impact on the flat plate are observed in the flow snapshots. The spectra in the near pressure fields revealed several tone frequencies due to a feedback mechanism occurring between the nozzle lips and the flat plate. The near pressure and density fields of the jets are then analysed using Fast Fourier Transform on the nozzle exit plane, the plate plane and an azimuthal plane. It has been found found that the helical or axisymmetric organisation of the turbulent structures in the jet shear layers, specific to each tone frequency, persists after the jet impact on the plate. The radial propagation of these structures in the wall jets leads to a spiral shape or to concentric rings in the phase fields, respectively. In particular, for one of the jets, a spiral shape and concentric rings associated with two tone frequencies generated simultaneously have been observed. Finally, the convection velocity of the turbulent structures in the wall jets was evaluated from the phase fields and cross-correlations of radial velocity. Over 3r0< r < 6r0,
the convection velocity of the structures on the wall varies between 0.40uj and 0.49uj in the present jets.
These results are in agreement with measurements for ideally expanded impinging supersonic round jets performed using Pressure-Sensitive Paint on the flat plate. Near the jet axis, differences are observed. They are due to the fact that the present jets are non-ideally expanded, leading to the formation of a Mach disk or to the presence of oblique shocks upstream from the plate.
Acknowledgments
This work was performed using HPC resources of P2CHPD (Pˆole de Calcul Hautes Performances D´edi´es) and IDRIS (Institut du D´eveloppement et des Ressources en Informatique Scientifique) under the allocation 2015-2a0204 made by GENCI (Grand Equipement National de Calcul Intensif). This work was performed within the framework of the Labex CeLyA of Universit´e de Lyon, within the program ”Investissements d’Avenir” (ANR-10-LABX-0060/ ANR-11-IDEX-0007) operated by the French National Research Agency (ANR).
References
1 A. Powell. On edge tones and associated phenomena. Acta Acust. United Ac., 3:233–243, 1953.
2 F.R. Wagner. The sound and flow field of an axially symmetric free jet upon impact on a wall. NASA,
NASA TT F-13942, 1971.
3 C.M. Ho and N.S. Nosseir. Dynamics of an impinging jet. part 1. The feedback phenomenon. J. Fluid
Mech., 105:119–142, 1981.
4 N.S. Nosseir and C.M. Ho. Dynamics of an impinging jet. part 2. The noise generation. J. Fluid Mech.,
116:379–391, 1982.
5 B. Henderson and A. Powell. Experiments concerning tones produced by an axisymmetric choked jet
impinging on flat plates. J. Sound Vib., 168(2):307–326, 1993.
6 A. Krothapalli, E. Rajkuperan, F. Alvi, and L. Lourenco. Flow field and noise characteristics of a
supersonic impinging jet. J. Fluid Mech., 392:155–181, 1999.
7 B. Henderson, J. Bridges, and M. Wernet. An experimental study of the oscillatory flow structure of
tone-producing supersonic impinging jets. J. Fluid Mech., 542:115–137, 2005.
8 A. Risborg and J. Soria. High-speed optical measurements of an underexpanded supersonic jet impinging
on an inclined plate. 28th International Congress on High-Speed Imaging and Photonics, 7126(F), 2009.
9 N.A. Buchmann, D.M. Mitchell, K.M. Ingvorsen, D.R. Honnery, and J. Soria. High spatial resolution
imaging of a supersonic underexpanded jet impinging on a flat plate. 6th Australian Conference on Laser Diagnostics in Fluid Mechanics and Combustion, 2011.
10 D.M. Mitchell, D.R. Honnery, and J. Soria. The visualization of the acoustic feedback loop in impinging
underexpanded supersonic jet flows using ultra-high frame rate schlieren. J. of visualization, 15(4):333– 341, 2012.
11 T. Davis, A. Edstrand, F. Alvi, L. Cattafesta, D. Yorita, and K. Asai. Investigation of impinging jet
resonant modes using unsteady pressure-sensitive paint measurements. Exp. in Fluids, 56(5):1–13, 2015.
12 R. Gojon, C. Bogey, and O. Marsden. Large-eddy simulation of underexpanded round jets impinging on
a flat plate 4 to 9 radii downstream from the nozzle. AIAA Paper 2015-2210, 2015.
13 C. Bogey and C. Bailly. A family of low dispersive and low dissipative explicit schemes for flow and noise
computations. J. Comput. Phys., 194(1):194–214, 2004.
14 J. Berland, C. Bogey, O. Marsden, and C. Bailly. High-order, low dispersive and low dissipative explicit
schemes for multiple-scale and boundary problems. J. Comput. Phys., 224(2):637–662, 2007.
15 C. Bogey and C. Bailly. Large eddy simulations of transitional round jets: influence of the Reynolds
number on flow development and energy dissipation. Phys. Fluids, 18:065101, 2006.
16 C. Bogey and C. Bailly. Turbulence and energy budget in a self-preserving round jet: direct evaluation
using large eddy simulation. J. Fluid Mech., 627:129–160, 2009.
17 C.K.W. Tam and Z. Dong. Wall boundary conditions for high-order finite-difference schemes in
compu-tational aeroacoustics. Theor. Comput. Fluid Dyn, 6:303–322, 1994.
18 C. Bogey, N. de Cacqueray, and C. Bailly. A shock-capturing methodology based on adaptative spatial
filtering for high-order non-linear computations. J. Comput. Phys., 228(5):1447–1465, 2009.
19 K. Mohseni and T. Colonius. Numerical treatment of polar coordinate singularities. J. Comput. Phys.,
157(2):787–795, 2000.
20 C. Bogey, N. de Cacqueray, and C. Bailly. Finite differences for coarse azimuthal discretization and
for reduction of effective resolution near origin of cylindrical flow equations. J. Comput. Phys., 230(4): 1134–1146, 2011.
21 C. Bogey, O. Marsden, and C. Bailly. Large-eddy simulation of the flow and acoustic fields of a Reynolds
number 105subsonic jet with tripped exit boundary layers. Phys. Fluids, 23:035104, 2011.
22 R. Gojon, C. Bogey, and O. Marsden. Large-eddy simulation of supersonic planar jets impinging on a