is an open access repository that collects the work of Arts et Métiers Institute of
Technology researchers and makes it freely available over the web where possible.
This is an author-deposited version published in: https://sam.ensam.eu Handle ID: .http://hdl.handle.net/10985/7777
To cite this version :
Chiara STEFANI, Livio DE LUCA, Philippe VERON - Time indeterminacy and spatio-temporal building transformations: an approach for architectural heritage understanding - International Journal of Interactive Design Manufacturing - Vol. 4, p.61-74 - 2009
Any correspondence concerning this service should be sent to the repository Administrator : [email protected]
Time indeterminacy and spatio-temporal building
transformations: an approach for architectural
heritage understanding
Chiara Stefani · Livio De Luca · Philippe Véron · Michel Florenzano
Abstract Nowadays most digital reconstructions in
archi-tecture and archeology describe buildings heritage as a whole of static and unchangeable entities. However, historical sites can have a rich and complex history, sometimes full of evo-lutions, sometimes only partially known by means of docu-mentary sources. Various aspects condition the analysis and the interpretation of cultural heritage. First of all, buildings are not inexorably constant in time: creation, destruction, union, division, annexation, partial demolition and change of function are the transformations that buildings can undergo over time. Moreover, other factors sometimes contradictory can condition the knowledge about an historical site, such as historical sources and uncertainty. On one hand, historical documentation concerning past states can be heterogeneous, dubious, incomplete and even contradictory. On the other hand, uncertainty is prevalent in cultural heritage in vari-ous forms: sometimes it is impossible to define the dating period, sometimes the building original shape or yet its spa-tial position. This paper proposes a modeling approach of the geometrical representation of buildings, taking into account
C. Stefani (
B
)· L. De Luca · M. FlorenzanoUMR CNRS/MCC 694 MAP, Modèles et simulations pour l’Architecture, l’Urbanisme et le Paysage, ENSA Marseille, 184, Av. de Luminy, 13288 Marseille Cedex 9, France e-mail: [email protected] L. De Luca e-mail: [email protected] M. Florenzano e-mail: [email protected] P. Véron
UMR CNRS 6168 LSIS, Laboratoire des Sciences de l’Information et des Systèmes, CER ENSAM, 2, cours des Arts et Métiers, 13617 Aix-en-Provence Cedex 1, France
e-mail: [email protected]
the kind of transformations and the notion of temporal indetermination.
Keywords Building transformations·
Spatio-temporal modeling· Temporal uncertainty · Historic graphs· Cultural heritage
1 Introduction
Nowadays data-processing technologies transform data acquisition and data management methods in architecture and archaeology. These technologies become increasingly necessary in order to describe, to comprehend and to support historical heritage.
For instance, among various techniques, laser scanner combined with a photogrammetric approach and topography concepts allows a precise and detailed acquisition of spatial data [23,24]. Such data is subsequently interpreted to gen-erate relevant spatial representations. These ones enable to show architectural objects at various levels of detail in accor-dance to the different purposes of the morphological analy-sis [11]. In addition, today new approaches resulting from the field of direct and reverse engineering lead people to a new way of thinking objects: an object can be represented in different ways according to the goal of the application [13].
In this rather promising panorama, however, it is important to highlight a fallacy: restitutions in archaeology and archi-tecture are generally connected only to one historical state that usually is the period of higher luster of a building and not his state of corruption. As shown by a lot of researches, buildings are too often considered as static and unchangeable entities [7]. As a matter of fact, buildings are not inexorably
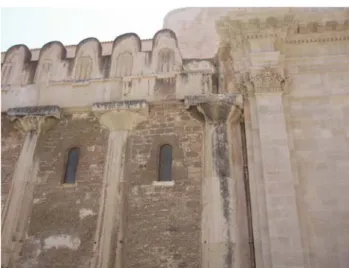
Fig. 1 Left side of the Syracuse dome (Italy). Columns of the Doric
temple of V century AC were included in the wall
Fig. 2 Church of Santa Catalina in Valencia, Spain. Old stones,
frag-ments and decorations used to wall up a niche of the facade
constant in time, but, rather, in continuous change. As a con-sequence, they must be considered as dynamics entities.
Two images might help clarify this concept. Figure 1 shows the dome of the Italian city Syracuse. The cathedral of the 7th century rises on the site of a Greek temple of the 5th century AC consecrated to the divinity Athena. Traces of Doric columns drowned in the wall are still distinguish-able on its left side. This example highlights how an ancient building can be re-used and how it can consist of architectural elements very distant in time.
Figure2represents the Spanish church of Santa Catalina in Valencia. One of the niches of this church from the 14th century was walled up with remains, stones and fragments of statues and decorations from past time. In this example, not only fragments belong to different periods of time, but some of them were also moved from their original site.
1.1 State of the art
Past works urge us to look for new ways to resolve the prob-lem of buildings heritage display. Current researches some-times offer historic restitutions of sites in their best state, without giving information neither on their physical position nor on what has been really preserved [7,12]. Relevance of information is not precisely stated: restitutions do not seem to be related to a specific stage of the morphological evolution of buildings.
In other recent works, historic restitutions are well inte-grated into their geographical context. However, the funda-mental problem of temporal modeling is not resolved: in the rendered images it is not possible to distinguish the digital model from vestiges because any difference is remarkable between them [2,25,26].
Moreover, when analyzing the past states of buildings, historians often attempt to formulate assumptions. However, if assumptions are represented with the same visual crite-ria used for elements that existed for sure, knowledge about buildings will be distorted: the public will not be able to dis-tinguish what is dubious from what really existed.
Conscious of this bias in the scientific community, we try to solve the following aspects: on one hand, the fundamen-tal problem of representation that should be coherent with its geographical context, on the other one, the difficulty of modeling buildings considering their temporality and their transformations.
1.2 The context
This research derives from the necessity of studying the relation between a site morphology and its spatio-temporal transformations. This study focuses particularly on the anal-ysis and description of space-time transformations referring to the building scale. Place rich of historical transforma-tions that proceeded across ten centuries, Comtal Castle in Carcassonne [18] is a site of research rather keen to reveal the problems of representing change. Events like creation, demolition, rebuilding, annexation, division and change of function have deeply modified this castle from the beginning of the 10th century until today.
So far, the understanding of Comtal Castle is difficult because information on this site is complex and sometimes fuzzy. The inaccuracy and the loss of information on the events occurred during the historical periods of Comtal Cas-tle led two historians to formulate two different restitution assumptions. The project treated in this paper will offer a solid ground of analysis and will allow us to validate our methodological approach regarding the description of build-ings and their transformations.
Time indeterminacy and spatio-temporal building transformations
1.3 The purpose
The aim of this work is to provide knowledge about a ing complex: the analysis is going to take into account build-ing morphology as well as their transformations. In order to achieve this goal, the 3D-model will be transformed into a representation tool. Such kind of restitution provides several advantages. Firstly, architectural evolutions are visualized more clearly: current and past states account for disappeared and transformed elements. Secondly, this kind of restitution allows assumptions or hypotheses to be displayed for what they are, avoiding information distortion. Thirdly, the 3D model is able to maintain a link to additional information such as sources. Finally, the kind of representation is cali-brated on the objective of restitution, meaning that historical complexes have a variety of representations according to the restitution purpose.
This article is structured in the following way. Section2 deals with the temporal issue, which is fundamental for the 3D model organization. Section3is dedicated to the problem of spatial and temporal representation of uncertain events. Section4explores the spatial structuring of the digital model in order to allow multiple restitutions. Section5 describes the research setting and the subsequent implementation. At last, Sect.6 introduces the methodological orientation, the research perspectives and the existing limits of the applica-tion.
2 Temporal modeling for building changes
2.1 Fundamental problem
For long time, in the field of cultural heritage and GIS, researchers have only worried about manipulation of spatial geometries, describing them in term of position and form. Interactive processes managing spatial queries have been developed; whereas temporal aspects have often been disre-garded as less important attributes [1,28,29]. However, any change in space implies also the passage from the instant of time T0 to T1. Therefore, temporal notion plays an
essen-tial role in the description of transformations. Mainly within the context of historical heritage, buildings may modify their mutual relations over time. Lately researchers [9,16,17] in similar fields have started considering spatial and temporal transformations as jointed concepts. Particularly, in dealing with buildings, the following aspects strongly affect their transformations and their mutual relations.
2.1.1 Typologies of transformations
Potential transformations of a building throughout its exis-tence are abundant. In fact buildings are built, destroyed, or
rebuilt; they also may be extended, attached to other ones, divided into several buildings or they can undergo degrada-tion along their life-cycle. Moreover, their destinadegrada-tion can change over time, as well as their owner. Less frequently, but all the same possible, buildings can be entirely or partially moved and rebuilt somewhere else.
We wonder how to represent such events without altering the role played by buildings in the process of knowledge of a site.
2.1.2 The duration of transformations
Furthermore, changes involving buildings have different
tem-poral granularities: transformations can be sudden or
grad-ual. For instance, a change of property is a sudden event. On the other hand there are changes that are progressive: to name but a few, demolition of buildings is a short event because it usually takes a few days and the construction site of a Gothic cathedral is a rather long event that lasts several cen-turies. Therefore, spatio-temporal modeling has to manage both sudden and gradual transitions.
2.2 The choice of the approach: the historic graphs
Among several approaches managing spatio-temporal trans-formations [17], Renolen’s historic graphs [19,21,22] rep-resent a suitable notation for the field of historical heritage. Such object oriented approach traces very well the kinds of building transformations by showing both relations between entities and their lifespan. It proves to facilitate transforma-tions understanding.
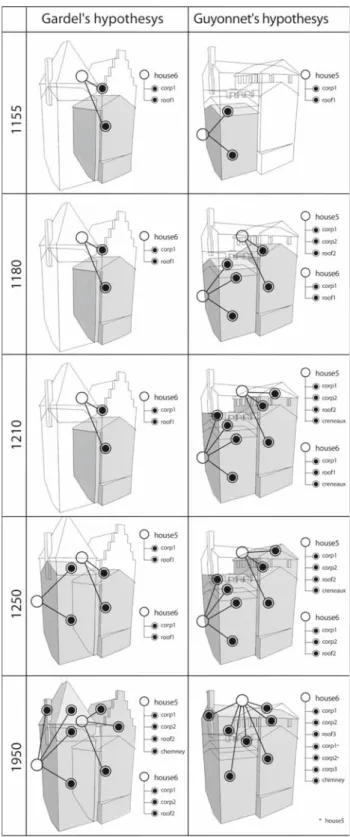
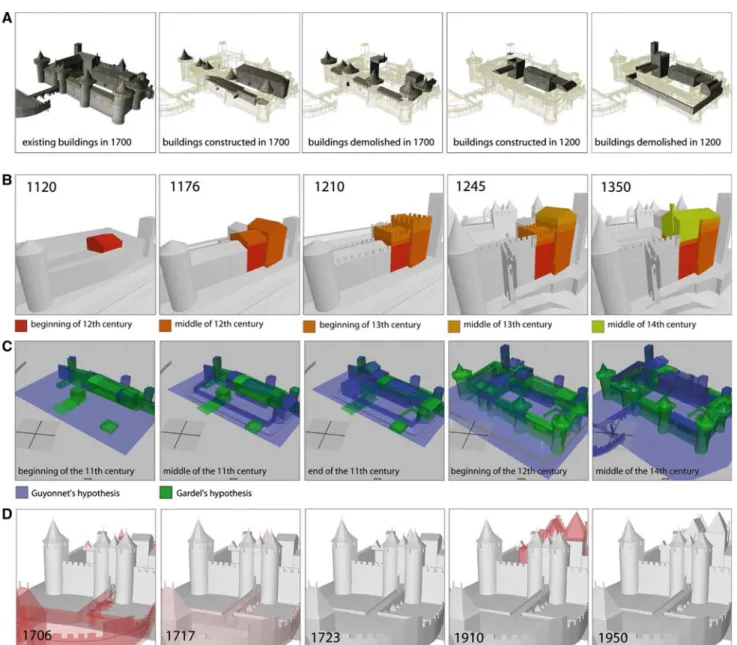
In order to clarify this notation, Fig.3shows transforma-tions undergone by several buildings of Carcassonne Castle. According to the historian Guyonnet, these changes followed one another between the 12th and the 14th century. In the upper part of the figure, images show six historic states that belong to this hypothesis. In the lower part the graphs use rectangles to represent the lifespan of buildings and smoothed rectangles to represent their transitions duration. Housing 5 (whose graphs are highlighted) is analyzed with the purpose of detailing Renolen’s notation. According to Guyonnet, the lodging 5 was built “at the end of the 12th century” (tran-sition T3); then, at the beginning of the 13th century (T4) crenels were added to it. Later, towards the middle of the 13th century (T5), crenellations were demolished and a part of this building changed function: planned for being a pas-sage at the ground floor, the portion 7 was annexed to the existing galleries (numbered 6). Finally, towards the middle of the 14th century (T6), a gallery portion at the ground of housing 7 was demolished and housing 5 was enlarged by taking up the ancient housing 7.
Actually Renolen’s approach allows managing various granularities of change [20]. Progressive changes such as
Fig. 3 Renolen’s notation showing six historical states between the 12th and the 14th century according to the historian Guyonnet. The graph
system allows building relations and life cycle to be described
those ones of Fig.3, are described by means of smoothed rectangles having different lengths according to the interval of transformation; on the contrary, variations with sudden duration (such as changes in building property), are repre-sented by means of circles. In this notation, there is another kind of change that is relevant for buildings: it concerns con-tinuous and exceptionally long changes, as building decay and degradation. An exhaustive analysis of granularities will be carried out in the following paragraph.
2.3 The adopted solution
In a general way, static systems of representation have a great limit: representation is invariable at each scale. As a result, events must be represented at the correct scale in order both to ease the system and to point out relevant information to com-prehend. Even in a conceptual notation such as Renolen’s, it is possible to consider various representations according to the granularity taken into account.
All transformations concerning buildings will be formal-ized according to different spatial and temporal granularities. As a consequence, the previous case of building transforma-tions (see Fig.3) described throughout graphs could be rep-resented by means of various restitutions corresponding to the spatial and the temporal granularity levels [20].
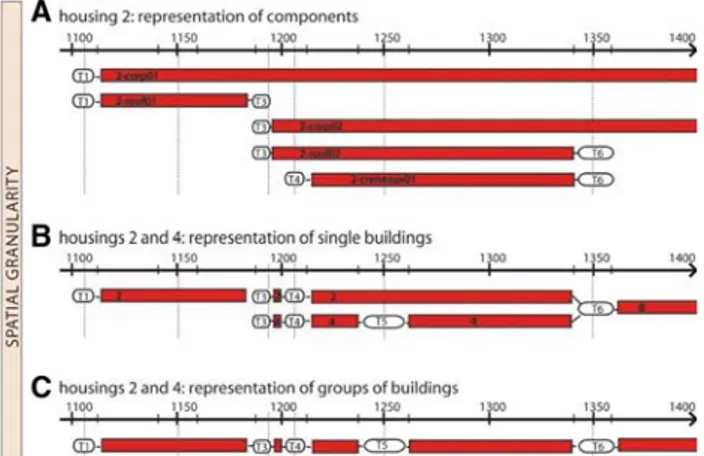
2.3.1 Spatial granularity level
If we take into account the spatial granularity level, a graph can represent different concepts. Rectangles can stand for single buildings, as in the case of Figs.3and4b. In partic-ular, this last figure outlines evolution of buildings 2 and 4. However, at a higher granularity level, each rectangle could symbolize the various parts composing a building. This case
Fig. 4 Spatial granularity in Carcassonne Castle: a representation of
different components of the same building; b representation of single buildings; c representation of groups of buildings
Time indeterminacy and spatio-temporal building transformations
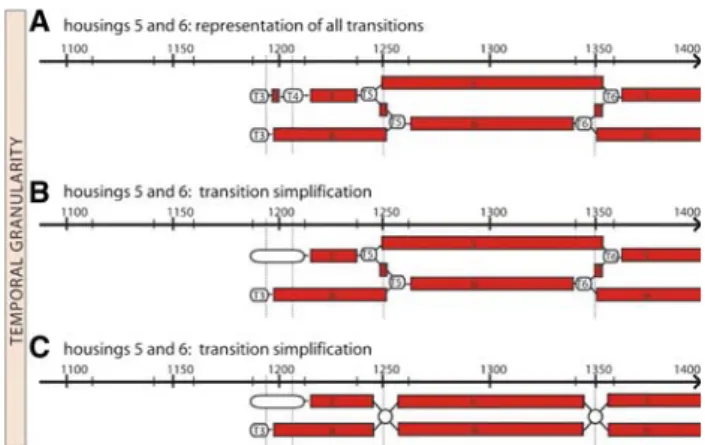
Fig. 5 Progressive temporal granularity reduction applied to two
build-ings in Carcassonne: a representation of all transitions; b and c transition simplification
is outlined in Fig.6a: in this option, each rectangle stands for walls, roofs and crenels belonging to the same construction (housing 2) built in different temporal periods. Moreover, at a lower granularity, each rectangle can be related to a group of buildings (see Fig.3c). Therefore, different spatial granulari-ties can be applied to the same entigranulari-ties according to the object of the analysis: from groups of buildings to single building components, granularity will be higher and higher.
2.3.2 Temporal granularity level
In the same way, temporal granularity becomes a variable for graphs visualization depending on the analysis criteria. As a result, each transition (smoothed rectangle) can concern one and only one change of the building state (see Fig.5a). However, in wide-ranging analyses a smoothed rectangle can stand for multiple and complex transformations such as extremely small, close or overlapped changes. Figure5 out-lines various temporal granularities: in the highest temporal granularity level all transitions are represented (Fig.7a); on the contrary at lower granularity levels transitions are simpli-fied in the same smoothed rectangle (see Fig.5b and c). As a result, different temporal granularity levels can be displayed according to the “temporal scale” of analysis.
3 Representation of temporal and spatial uncertainty
3.1 Fundamental problem
In our domain, lots of researchers today focus on the acqui-sition and the precise structuring of spatial data with the aim of producing significant and detailed digital models. How-ever, in the field of historical heritage more than anywhere else, 3D-model architectural elements must be characterized by temporal properties. Sometimes historical sites are recent
and fully known, but in most cases they are old and docu-mental sources allow only a partial knowledge about them. In this logic, a range of possibility is opened, because sometimes existing historical elements lead to many controversies about the precise dating or about the original shape or position in space.
Therefore, it is necessary to introduce the notion of inde-cision, otherwise described as spatial and temporal uncer-tainty. As it refers to a broad subject [27], in this article only the notion of temporal uncertainty will be investigate.
3.1.1 Factors of imprecision
Among the causes of temporal imprecision, several factors can be included [4].
Firstly, in the case of patrimonial complexes often the primary problem is the one of granularity. Events which took place “on August 10th, 1810” or “in October, 1650” or again “between the year 1801 and the 1830” certify different tem-poral weights. If granularity is the “month”, can we establish the day in which a transformation occurred? How can we manage different nature/granularity transformations? Utterly this notion causes a first “technical” ambiguity.
Secondly, any archaeological interpretation leans on
dat-ing problem of archaeological finds and sites. Most of the
times uncertain dating systems are used: for example car-bon 14 technique has a margin error of nine centuries. As a consequence, dating inaccuracy must be considered among parameters which play an essential role for indeterminacy of sites.
Thirdly, in historic heritage historians have the responsi-bility to report past, to explain it and interpret it on the basis of documentary sources. They are thus led on formulating really divergent hypotheses for the same site. Uncertainty in such assumptions can concern both the position of architec-tonic elements and their changes in a period of time more or less certain.
At last, there can be cases of uncertainty in future, when prevision is necessary. Some examples are planning physical displacements of archaeological finds in different museums, planning building restorations or scheduling to end a work.
3.2 The kinds of events
As a result it is necessary to distinguish the kinds of events causing changes in the field of building historical heritage.
An event is determinate if both the historic moment when it occurred and the physical site are known. On the other hand, an event is indeterminate if certainly it occurred, but either the moment or the physical site are unknown.
We can deduct the notion of indeterminate interval, which designates an interval as bounded by undetermined elements.
Fig. 6 Viollet Le Duc’s sketche: Comtal Castle of Carcassonne south
view
Fig. 7 Plan concerning the archeological excavations at Comtal Castle
3.3 Hypothesis: a particular case of uncertainty
In our field, uncertainty is mainly represented by the idea of hypothesis. Events are hypothetical if it is not certain that they occurred.
Castle Comtal of Carcassonne offers rather precise scen-ery about this notion. In fact, in this city, two historians have tried to explain and to interpret numerous sketches (see Fig.6), documents and archeological excavations (see Fig.7). Hence, two hypotheses concerning the historic states between the 10th and the 20th century have been formulated.
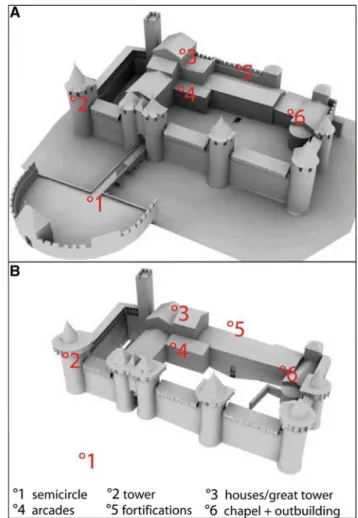
Fig. 8 Comtal Castle hypotheses during the 13th century: a
Guy-onnet’s hypothesis; b Gardel’s hypothesis
That is because the virtual model role is to distinguish sure elements from uncertain parts by means of convenient dis-play codes [3,10].
In order to do an example on the heterogeneity of hypothe-ses, both restitutions of Fig.8show Carcassonne in the same historical period: the middle of the 13th century. The first one is based on Guyonnet’s assumption (2000) and the sec-ond one is based on Gardel’s (1993). These hypotheses differ greatly from each others: among the differences, in the first one (see Fig.8a), there are no hoards on towers and fortifica-tions have crenels; on the other hand, in the second hypoth-esis (see Fig.8b) neither the semicircle nor the bridge nor galleries exist, and houses have different morphologies.
4 Spatial structuring of buildings
This section deals with the problem of the spatial structuring of the virtual model in order to allow multiple restitutions.
This structuring is in line with a PhD Thesis [14] that establishes how to transform general data into significant and
Time indeterminacy and spatio-temporal building transformations 67
structured spatial information about buildings. The identified solution implies three phases: firstly the classification of building components according to selected points of view (by function, by material), secondly the morphological build-ing decomposition and thirdly the creation of associations among concepts by means of description graphs. Such graphs provide a semantic value to the morphological representation of architectural objects.
When analysing past epochs, reasoning about temporal changes becomes essential. This notion has to be taken into account in the 3D-model structuring. Therefore, the “structure reorganization” implies an appropriate 3D-model partition. In order to classify and subdivide 3D-models, ele-ments will be structured according to a hybrid temporal and functional division: firstly graphs will be anchored to archi-tectural elements; secondly temporal attributes will be con-nected with the graphs hierarchy.
Data is hierarchically organized in a tree structure having three levels:
– groups, corresponding to a set of elements standing for building complexes, single buildings and their major components (ground, walls, bays, roofs, etc.),
– entities, standing for the functional and temporal 3D-model elements resulting from the 3D-3D-model partition, – reference marks, representing at the lowest level some
particular aspects belonging to entities.
Figure9 shows the relation graphs scheme of the hypo-thetical Carcassonne restitutions according to Guyonnet and Gardel, in the time interval of eight centuries. The advantage of these graphs is that all temporal entities are anchored to concepts (groups): entities are displayed or masked accord-ing to their existence in the selected period. For instance, according to Guyonnet, in 1180 housing 5 consisted by sev-eral architectural entities: the exterior/interior walls built towards the middle of the 10th century, the walls added in the second half of the 10th century, and a roof. However, at the beginning of the 11 century the same house was fortified and crenels were added. A new morphological entity char-acterized by temporal attributes is thus displayed: the entity “crenels”.
5 Implementation
In our field, there are multiple reasons to be interested in information technology development. The first goal is to improve analysis methods in order to obtain detailed descriptions of architectural objects and in order to itate their comprehension. The second purpose is to facil-itate consultation of information sources as a means to awaken the public to historical heritage. The third
objec-Fig. 9 Relations graphs scheme of hypothetical restitutions for two
housings/tours according to Guyonnet and Gardel
tive is to recognize the various transformations of historic sites. Implementation thus belongs to a context of heritage improvement concerning both the current state and the past ones.
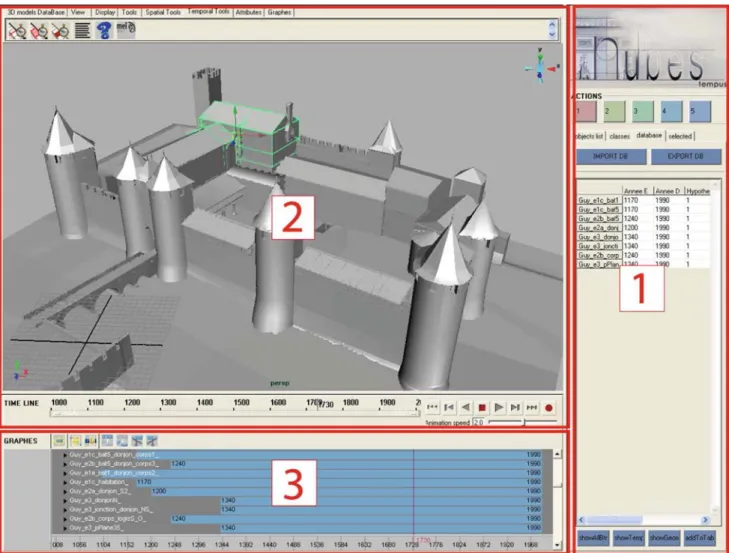
Fig. 10 System interface: 1 time management window: objects and attributes creation and manipulation; 2 restitutions display and manipulation; 3 temporal diagrams
As a result, the tool that has been developed aims to man-age three fundamental aspects: the 3D-model structuring, the temporal aspect and the uncertainty notion. It is in line with a project in which a semantic description model allows to man-age different restitutions, by means of the graphs previously described [15]. Our tool has been created by means of pro-gramming devices belonging to Maya, a software conceived for 3D geometrical modeling [8]. The interface of this tool, developed in form of plug-in, has been created by means of Mel language.
The interface is divided into three modules (Fig.10): the first concerns all phases for 3D-models time management and for queries formulation; the second displays various restitu-tions issued from executed queries and allows their manipu-lation; the last one allows buildings existence to be displayed by means of state diagrams.
This application focuses particularly on the temporal notion. Therefore, all phases have been conceived in order
to structure the 3D-model, to create temporal attributes, to characterize elements as hypothetical or certain, to store objects in their temporal period, yet to show their lifespan.
Furthermore, auxiliary tools are developed to facilitate restitution display. In particular a window allows temporal queries to be formulated, another one displays certain ele-ments thought colors/gray scale and a third one shows hypo-thetical elements with transparency. The three modules will be detailed in the following paragraphs.
5.1 The stages for time management
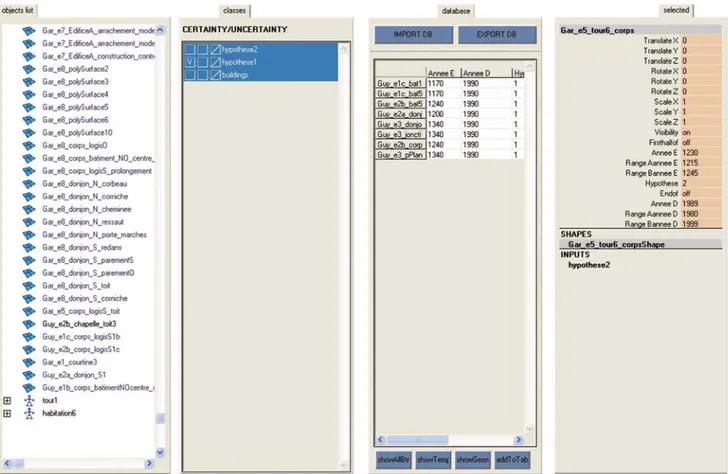
The first section is used to create the environment for tem-poral modeling and to consult all object attributes. As a con-sequence, this module is divided into two parts: in the upper part, four consecutive actions predispose the 3D-model to time management; in the lower part, four tabs allow 3D archi-tectural elements to be manipulated (Fig.11).
Time indeterminacy and spatio-temporal building transformations 69
Fig. 11 Four tabs enable data management
5.1.1 Attributes definition
Among all actions, the first one concerns the attributes
cre-ation. This stage is necessary to qualify the temporality of
objects and if they are certain or hypothetical. The funda-mental attributes to be created are dates (concerning the con-struction and demolition period) as well as the hypothesis author name. The user is guided in the creation of primary attributes for objects qualification; however, it is always pos-sible to create new ones if needed. Attributes are modifiable or erasable at any moment in the manipulation tab.
The interface is predisposed to manage different granu-larities. For example, if a date is vague, it is possible to fill in a period of time instead of a precise value. In particular, the desired granularity can be chosen for each object. Possible ranges will be centuries, years, months, days.
Furthermore, once granularity is selected, events lifespan can be characterized more in detail, by means of a drop-down menu (Fig.12) containing the options “beginning of”, “first half of”, “middle of”, “second half of”, “end of” as well as “around”. These time complements allow periods to be qual-ified as uncertain and limit the uncertainty period of events to shorter time intervals.
Fig. 12 Temporal attributes creation and hypotheses window.
Accord-ing to the range and the selected granularity, blanks (real range) can be filled with convenient values
5.1.2 3D objects distribution in classes
The second action concerns the class creation. Architectural objects having been defined as certain or hypothetical can be
Fig. 13 A time bar enables the transformations display over time
arranged in different layers, with the aim of grouping them together by type. This allows a faster selection and the display of buildings.
5.1.3 Temporal states creation
Finally, when temporal attributes are attached to the 3D-model, temporal states can be created: in this way, archi-tectural elements are placed in the historic existence period. A time bar allows architectural objects to run over time so transformations become more comprehensible (Fig.13). The time bar numbering depends on the objects temporal attri-butes values. Video recorder traditional buttons enable to extract 3D objects, to make run on in chronological or anti-chronological direction, to stop temporarily animation, to provide forward and backward motion, as well as to make events run on step by step. Finally, states progression can be recorded and stored in .avi format. At last, it is possible to slow down or to accelerate animation speed according to the kinds of transformations: for example, speed can be reduced if changes are too close one another.
5.1.4 State diagrams creation
The following step provides the state diagrams creation. This action allows buildings lifespan to be shown. Diagrams can be compared with existence states: by means of Mel language scripts, lifespan of architectural objects can be displayed in the temporal bar. For a deeper treatment of the subject we refer the reader to the paragraph5.3.
Beneath the actions, four tabs provide help for attributes manipulation (Fig.11). The first lists the objects belonging to the 3D-model; the second shows the organization in classes (if existing) facilitating the selection of objects by category; the third displays for the selected objects the geometry table containing attributes and values; finally the last one lists more in detail all attributes for each selected geometry.
In this paper, only geometry table will be chiefly detailed. Its interface shows the temporal attributes and the temporal uncertainties for the selected object. Two buttons allow tem-poral attributes to be exported in a .txt format file as well as to be imported from existing databases. These functions enable to retrieve existing databases or to exploit new data for other systems. In regard to this last task, for instance, data can be exported in MySQL databases in order to display any collected information and the related 3D-models on a Web system [15].
5.2 Displaying and manipulating many restitutions
This module aims to improve buildings analysis and com-prehension by means of 3D-models. Either restitutions over various periods of time or only certain selected elements can be displayed through graphical codes. Implementation pro-vides various tools in order to control the 3D-model and to compare different entities. A variety of tasks is possible.
5.2.1 Formulating temporal queries
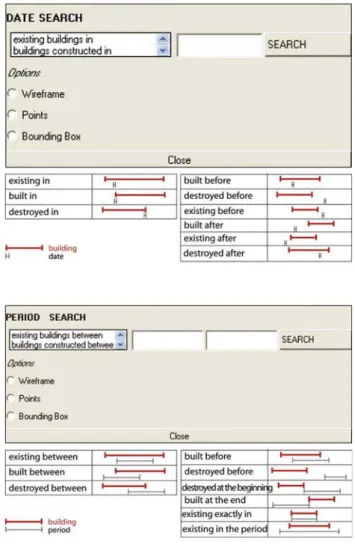
Temporal queries can be executed with regard to dates or periods, in order to know buildings existence states (or the demolition ones) before, during or after time instants/time intervals (Figs.14,15a). That implies to take into account
Time indeterminacy and spatio-temporal building transformations
Fig. 15 a Display of buildings selected according to temporal queries; b temporal evolution of two housings in Carcassonne from the earliest
parts to the most recent ones; c 3D model superposition: Guyonnet’s and
Gardel’s hypothesis are displayed by the visual help of transparencies;
d display of building demolition and creation by means of
transparen-cies
relations between discrete precise events or continuous fuzzy ones and time intervals or instants. The windows of Fig.14 show the kinds of possible queries with regard to dates and periods. Basic queries provide to know the constructed, exist-ing or destroyed buildexist-ings durexist-ing the selected year or period. However, other topological relations between intervals are possible, as [5,6] suggest. Among all relations, partial super-position between intervals is envisaged, because it is a recur-ring case in the interrogation of historical heritage databases. In the schemes of Fig.14, possible relations between build-ings and dates/periods are represented. Temporal queries could be extended to all the cases enumerated in the right schemes.
5.2.2 Representing temporal states
Colors or gray scale coding can be used in order to better distinguish manufactures having different temporalities. It is possible to show architectural objects according to a color coding that can be proportional/not proportional to dates. Colors tones should be adopted according to the specific site context. For instance, if dates are too close one another, visu-alization by colors proportional to dates will not give any useful result. Fig. 15b shows, through colors, the transfor-mations undergone by the same two housings whose graphs have been represented in paragraph2.3. Not only colors indi-cate changes over time from the construction of the first house
(in red) until its last transformation (in yellow); color tones proportional to dates reveal if two consecutive transforma-tions have taken place in a very short period or in a long time interval.
5.2.3 Displaying hypotheses
Assumptions will be displayed in transparency in order to dis-tinguish sure elements from fuzzy ones. This method enables to appreciate the superposition of dissimilar hypotheses and to notice differences or similarities (Fig.15c) for the same building complex.
5.2.4 Displaying temporal uncertainties
In the case of fuzzy dates, uncertainty will be displayed by means of transparency coding. During animation, if crea-tion or demolicrea-tion dates are uncertain, architectural entities will be shown in transparency gradation. In particular, in the case of fuzzy dates, objects are “positioned” in time inter-vals of more or less wideness. Fig.15d clears up this concept. According to Gardel, the hemicycle of the figure was built “at the beginning of the 18th century”. The possibilities range of this building construction is reduced to approximately around 20 year. Thus animation shows its construction as a gradual action by means of decreasing transparency, until building is completed approximately around year 1723.
5.2.5 Displaying information
For each temporal object information about name, origin,
certain or hypothetical state will be shown when the mouse
rolls over it.
5.3 Elements state diagrams
The third and last module displays existence diagrams for architectural bodies. The Maya software has a tracks editor who treats not linear animations sequences. As diagrams cor-respond to the animation length, this tool has been adapted in order to show the element state over time.
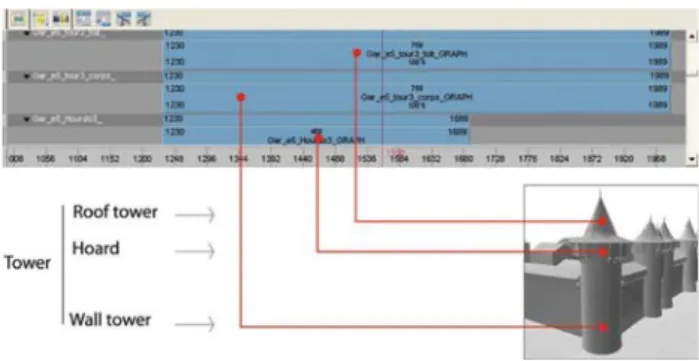
By means of Mel language scripts, all temporal entities constituting buildings and their life expectancy can be dis-played. For all diagrams, lifespan, creation and demolition dates are visible (Fig.16). However, the real advantage of this tool is that temporal attributes can be directly changed by users, in an intuitive and dynamic way: the user needs only to modify the diagrams dimension or position at the level of the interface in order to change the construction date, the demolition one and the duration. As a consequence, tempo-ral values will be directly modified in the Maya geometry table. So these diagrams can be used as completion to 3D management.
Fig. 16 Entities diagrams of the tower: roof, hoards and wall.
Dia-grams show that three elements were built at the same time but that hoards was demolished before the other parts
5.3.1 A notation for the Web
The diagrams previously described have one fundamen-tal limit: they are reduced to Boolean values (True/False) because they display only the existence and the end state of entities. On the contrary, the graph formalism is more com-plex: firstly, transformations are various and not confined to creation or demolition; secondly, the temporal dimension of each entity should be intersected with the topological notion of the spatial entity as belonging to a specific building.
As a consequence, the interest is to display graphs through a time bar. Graphs will represent every kind of change, included the annexation, the division and the partial demo-lition. An example of web visualization of graphs is repre-sented in Fig.17. The general architecture stands on NUBES interface described in [15]. A module concerning graphs has been added on the bottom of NUBES frames.1
In particular, the interface concerning graphs is created in svg,2a language for describing two-dimensional graphics in XML. A dynamic time bar permits to move the time range forward and backward. Under the timeline, dynamic graphs are created by means of PHP language3 filtering temporal attributes contained in a MySQL database.4
Under the graphs, different tasks make up the current work in progress. Firstly, two frames allow building transforma-tions to be described according to various spatial and tem-poral resolutions (paragraph 2.3). When the mouse is over graphs, some information concerning building names, time date and lifespan are displayed. The interest of such web development is to query graphs in order to understand the history of each building or component.
1 Web site:www.map.archi.fr/nubes. 2 Web site:www.w3.org.
3 Web site:www.php.net. 4 Web site:www.mysql.com.
Time indeterminacy and spatio-temporal building transformations
Fig. 17 NUBES web interface. The graphs on the bottom describe buildings lifespan and their “temporal position”
6 Conclusions
As this article underlines, representing graphically the evolu-tions of single buildings or building complexes is not simple. A possible solution is to manage the temporal dimension through the implementation of dynamic graphs. This task has been partially realised in Maya modules, but a winning temporal management will provide a dynamic graphs inter-face for a Web consultation System in real time and actually this work is in progress.
Furthermore, other factors interfere in the historic heritage analysis, such as particular varieties of sources. As a result, it will be necessary to classify the geometrical representation levels according to the informative contents of the different kinds of documentary sources.
Finally, all these reflections aim to build an information system spatially interfaced at the architecture scale. This system has to take into account the two aspects previously
discussed: evolutions over time and varieties of sources. Moreover, it should envisage considering both different tem-poral granularities and lacks of information management.
References
1. Breunig, B., Cremers, A.C., Müller, W., Siebeck, J.: 5th AGILE Conference on Geographic Information Science. In: Geographic Information Science, pp. 195–204, Palma (Mallorca), Spain, 25– 27 April (2002)
2. Bustany-Leca, C., Bustany, D.: Vers une vision du forum d’Au-guste. In: Virtual Retrospect 2005, vol. 2, pp. 103–106, Biarritz, France. Ausonius éditions (2005)
3. Dudek, I., Jean-Yves, B.: From artefact representation to infor-mation visualisation: Genesis of informative modelling. In: Smart Graphics, vol. 3638 of Lecture Notes in Computer Science, pp. 230–236, Frauenworth Cloister, Germany, Springer, LNCS (2005)
4. Dyreson, C.E., Snodgrass, R.T.: Supporting valid-time indetermi-nacy. ACM Trans. Database Syst. 23(1), 1–57 (1998)
5. Erwig, M., Güting, R.H., Schneider, M., Vazirgiannis, M.: Spatio-temporal data types: an approach to modeling and querying moving objects in database. Geoinformatica 3(3), 269–296 (1999) 6. Euzenat, J.: Granularité dans les représentations
spatio-tempor-elles. Intelligence artificielle, systèmes cognitifs et interaction homme-machine 2242, Institut National de Recherche en Infor-matique et en autoInfor-matique, Paris. Rapports de recherche de l’INRI (1994)
7. Fischer, B.: Mission and recent project of the UCLA cultural virtual reality laboratory. In: Virtual Retrospect 2005, vol. 2, pp. 65–74, Biarritz, France. Ausonius éditions (2005)
8. Gould, D.A.: Complete Maya Programming. An Extensive Guide to MEL and the C++ API, 1ère édn. Morgan Kaufmann, Los Altos, CA (2002)
9. Kavouras, M.: Understanding and modelling spatial change. In: Frank, A., Raper, J., Cheylan, J.P. (ed.) Life and Motion of Socio-Economic Units, number 8 in GISDATA, p. 348. London (2001) 10. Kienreich, W.: Information visualization–an oblique view. In:
Jour-nal MIA, vol. 0 of 1, Saint Maximin, France (2006)
11. Laboury, D., Morceau, V.: A new tool for 3D archeological and epi-graphic recording. In: Virtual Retrospect 2005, vol. 2, pp. 60–66, Biarritz, France. Ausonius éditions (2005)
12. Lecocq, F.: Reconstitution virtuelle de rome antique. In: Virtual Retrospect 2003, vol. 1, pp. 77–84, Biarritz, France, Ausonius édi-tions (2003)
13. Léon, J.C., Véron, P., Pernot, J.P.: Obtaining usable 3D models from scanned archeological sites. In: Virtual Retrospect vol. 2, pp. 18–25, Biarritz, France, 2005. Ausonius éditions (2005) 14. De Luca, L.: Relevé et multi-représentation du patrimoine
architec-tural : définition d’une approche de reconstruction 3D d’édifices. Engineering. ENSA Marseille (2006)
15. De Luca, L., Busarayat, C., Stefani, C., Véron, P., Florenzano, M.: An integrated framework to describe, analyze, document and share digital representations of architectural buildings. In: VAST2007– Future technologies to empower heritage professionals, Brighton, UK (2007)
16. Du Mouza, C., Rigaux, P.: Bases de données Spatio-Temporelles. In: Documents et évolution. publié dans le cadre de l’école théma-tique du GDR I3 (2000)
17. Pelekis, N., Theodoulidis, B., Kopanakis, I., Theodoridis, Y.: Lit-erature review of spatio-temporal database models. Knowl. Eng. Rev 19(3), 235–274 (2004)
18. Poux, J.: La cité de Carcassonne, histoire et description. Privat E., Toulouse (1922)
19. Renolen, A.: Conceptual modelling and spatiotemporal informa-tion systems: How to model the real world. ScanGIS’97, pp. 1–22 (1–3 June 1997)
20. Renolen, A.: Generalization and data reduction in spatiotemporal data sets. Technical report, Department of Surveying and Mapping, Trondheim, Norway (1997)
21. Renolen, A.: Modelling spatiotemporal information: The spatio-temporal object model. Technical report, Department of Survey-ing and MappSurvey-ing (IKO), The Norwegian Institute of Technology (1997)
22. Renolen, A.: Concepts end methods for modelling temporal and spatio-temporal information. PhD thesis, Norwegian University of Science and Technology, NTNU (1999)
23. Salonia, P., Negri, A., Valdarnini, L., Scolastico, S., Bellucci, V.: Quick photogrammetric systems applied to documentation of cul-tural heritage: the example of aosta roman city wall. In: CIPA 2005– XX International Symposium. Torino, Italy (2005)
24. Scolastico, S.: Innovative systems for 2D–3D documentation and conservation of cultural heritage. In: MIA Journal, vol. 0 of 2, pp. 41–46. Saint Maximin, France (2006)
25. Serrato-Combe, A.: From aztec pictograms to digital media. In: Jabi, W. (ed.) Reinventing the Discourse. How Digital Tools Help Bridge and Transform Research, Education and Practice in Archi-tecture, pp. 34–43. Syracuse (2001)
26. Stojakovic, V., Tepavcevic, B.: Optimal methods for 3d model-ing of devastated architectural objects. In: Proceedmodel-ings of the 3rd ISPRS International Workshop 3D-ARCH 2009, vol. XXXVIII-5/W1, Trento. Fabio Remondino, Sabry El-Hakim Lorenzo Gonzo (2009)
27. Thomson, J., Hetzler, E., MacEachren, A.M., Gahegan, M., Pavel, M.: A typology for visualizing uncertainty. In: Society of Photo-Optical Instrumentation Engineers (SPIE) Conference Series, vol. 5669 of Society of Photo-Optical Instrumentation Engineers (SPIE) Conference Series, pp. 146–157 (2005)
28. Wang, S., Liu, D.: Spatial query preprocessing in distributed GIS. In: Jin, H., Pan, Y., Xiao, N., Sun, J. (eds.) GCC, vol. 3251 of Lecture Notes in Computer Science, pp. 737–744. Wuhan, China (2004)
29. Weber, C., Gançarski, P.: Revue Internationale de Géomatique. European Journal of GIS and Spatial Analysis, vol. 17 of Infor-mations Géographiques (2007)