Population and social conditions
Author: Giampaolo LANZIERI
S t a t i s t i c s i n f o c u s
13/2013
Towards a ‘baby recession’ in Europe?
Differential fertility trends during the economic crisis
The relationship between the economy andpopulation dynamics has long been discussed, but is still controversial. Fertility is commonly assumed to follow the economic cycle, falling in periods of recession and vice-versa, though scientific evidence is still not unanimous on this. This report looks at fertility trends in 31
European countries against selected indicators of economic recession. Fertility rates are also computed for women differentiated by parity, employment status, educational attainment and migrant status, highlighting the impact that the economic crisis may have on specific population groups.
In 2008, several European countries entered a period of economic crisis, usually featuring a fall in
gross domestic product (GDP). From the start of the recession, the total fertility rate (TFR, see methodological notes) started to decline across Europe.
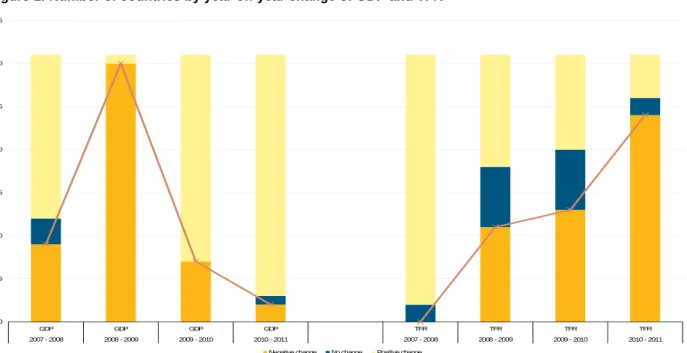
Figure 1 shows that in 31 European countries, the economic crisis spread in 2009, while decreases in fertility became a common feature in Europe with a time lag. The peak of the crisis (in terms of
geographic reach) in 2009 was accompanied by stagnation of the TFR in several countries, followed by a distinct fall. In 2008, there were no falls in the rate compared to the previous year, but by 2011, the TFR had declined in 24 countries. With some exceptions, these trends in fertility rates mirrored the changes that occurred in the number of live births.
Figure 1: Number of countries by year-on-year change of GDP and TFR
0 5 10 15 20 25 30 35 GDP GDP GDP GDP TFR TFR TFR TFR 2007 - 2008 2008 - 2009 2009 - 2010 2010 - 2011 2007 - 2008 2008 - 2009 2009 - 2010 2010 - 2011 Negative change No change Positive change
Notes: changes in GDP lower in absolute value than 0.1% and changes in TFR lower in absolute value than 0.01 live births per women are classified as 'No change'. GDP in millions of euro, chain-linked volumes, reference year 2000 (at 2000 exchange rates).
2 13/2013 — Statistics in focus
Fewer births were due more to fewer would-be mothers than to lower fertility
From the beginning of the crisis, the total numberof live births in Europe reversed the previous upward trend (see Figure 2). Between 2008 and 2011, the total number of live births fell by 3.5 %, from 5.6 to 5.4 million, and the number of
countries which recorded a fall compared to the previous year grew from 1 to 26 out of 31. Figure 2: Number of live births in Europe
5.0 5.1 5.2 5.3 5.4 5.5 5.6 5.7 2000 2001 2002 2003 2004 2005 2006 2007 2008 2009 2010 2011 M illio n s
Source: computation of the author on Eurostat data (online data code: demo_gind).
The number of live births can be broken down into the product of the age-specific fertility rates by the respective number of women of childbearing age (WCA) — the ‘would-be mothers’. The overall size of this population group has been slowly decreasing over recent years and, by 2011, it was shrinking in about two-thirds of European countries (post-census revisions of the population size in various countries may affect the current estimates — see methodological notes).
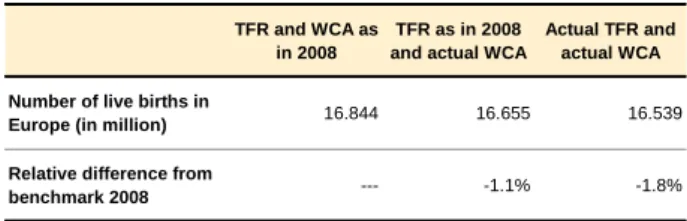
Although the year-on-year change in relative terms of the total number of women of childbearing age is much lower than the corresponding relative changes of the TFR (which is the sum of the age-specific fertility rates), its impact can be more significant. Table 1 reports the total number of live births, which would have occurred under different hypotheses.
Table 1: Simulated number of live births in 2009-2011 according to various scenarios
TFR and WCA as in 2008
TFR as in 2008 and actual WCA
Actual TFR and actual WCA
Number of live births in
Europe (in million) 16.844 16.655 16.539
Relative difference from
benchmark 2008 --- -1.1% -1.8%
Source: computation of the author on Eurostat data (online data codes: demo_find, demo_pjan).
Considering that 2008 was the peak year in the number of live births, taking this year as a benchmark and keeping constant its conditions (summarised by the WCA and TFR) over the next three years gives the hypothetical number of live births which would have occurred during 2009-2011 if no change had taken place in both the number of would-be mothers and in age-specific fertility rates. Allowing only the WCA to decrease as actually occurred gives the number of live births resulting from a shrinking number of women of childbearing age who keep their fertility behaviour constant (i.e., the TFR). This hypothetical scenario enables us to roughly estimate the impact of changes in the WCA, all other things being equal. Finally, allowing both WCA and TFR to change leads to what was actually recorded over the period 2009-2011.
Table 1 shows that the change in WCA alone is responsible for about 62 % of the decrease in the number of live births. If fertility had not decreased since 2008, about 189 000 live births would have been ‘lost’ anyway, due to fewer would-be
mothers. The decline of the TFR that occurred after 2008 has in fact amplified this effect. This
downturn is of most interest because, unlike the changes in WCA, largely determined by past fertility conditions and thus mainly driven by inertia, changes in TFR are supposedly more reactive to current factors.
Fertility rates returned to ‘lowest-low‘ levels in some Eastern European countries
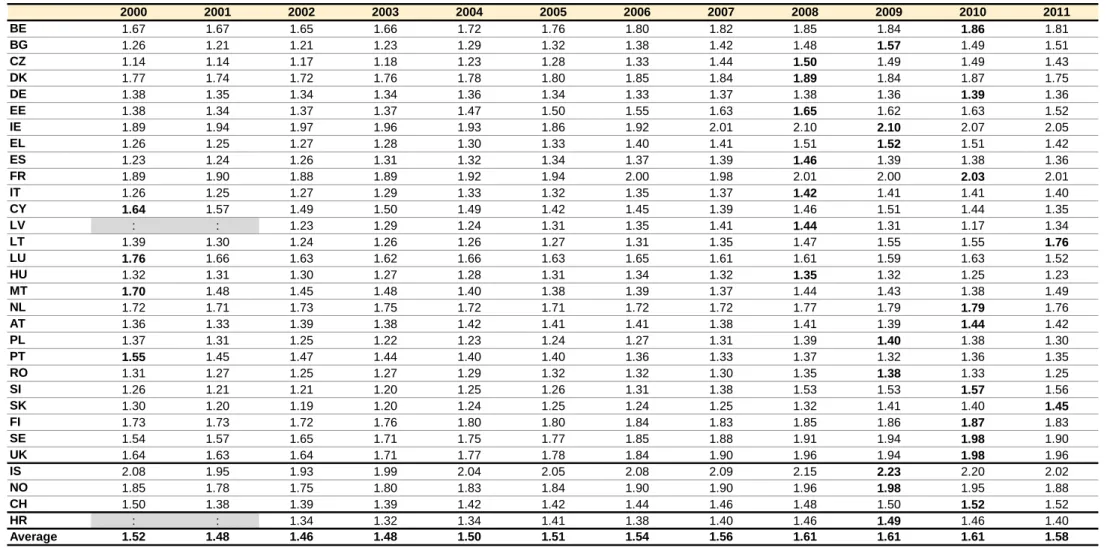
There has been a general recovery of fertility overthe past decade (see Table 2), though with some exceptions (such as Luxembourg and Portugal). The average across countries has risen by about 0.15 live births per woman between 2002 and 2008-09. Such an increase in fertility rates is usually explained by scholars as due to recuperation after the postponement of childbearing. Therefore, it would not be an
effective increase of the quantum of fertility, but simply a tempo effect. In other words, taking a longitudinal perspective, by the end of their childbearing years, successive cohorts of women would have accomplished about the same level of completed fertility. Decreases recorded by a period indicator such the TFR would be due mainly to temporary postponements of childbearing.
In 2008, no country had a TFR below 1.3,
considered by some scholars as marking a level of ‘lowest-low’ fertility. This recuperation process seems to have stopped around 2009 and, by 2011, the TFR in a few countries (Hungary, Poland and Romania) had perhaps unexpectedly fallen again, below the 1.3 live births per woman.
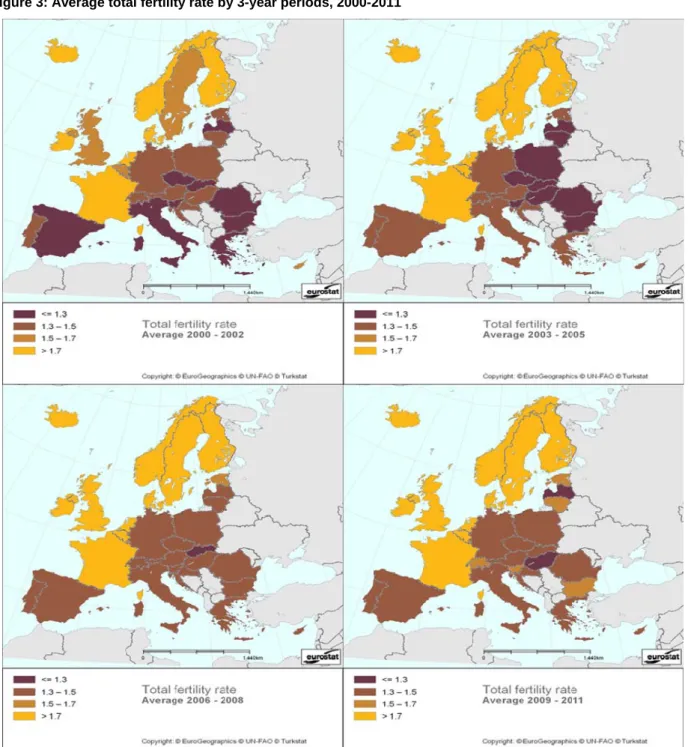
Figure 3 shows the geographic pattern of the TFR over time. At the start of the previous decade, the average TFR was at its lowest over the 12 years considered. In several countries in Northern and Western Europe, its level was above 1.7, while in Eastern and Southern Europe, low fertility was widespread. The next three years see a clear divide
between Northern and Western Europe, with a relatively high level of fertility, Eastern Europe, with ‘lowest-low’ fertility, and Central and Southern Europe, with slightly higher fertility, but still below 1.5 live births per woman. Between 2006 and 2008, fertility in Eastern Europe
continued to recover, leaving behind only Slovakia: in this period, fertility in Europe is essentially divided by a diagonal running from North-East to South-West. Finally, during the last three years, the average TFR grew further in some countries, but fell back in others, blurring the geographical pattern of low fertility in Eastern Europe.
Figure 3: Average total fertility rate by 3-year periods, 2000-2011
Note: for LV and HR the average 2000-2002 is based only on the 2002 year. Source: computation of the author on Eurostat data (online data code: demo_find).
4
13/20
13 —
Statistics in focus
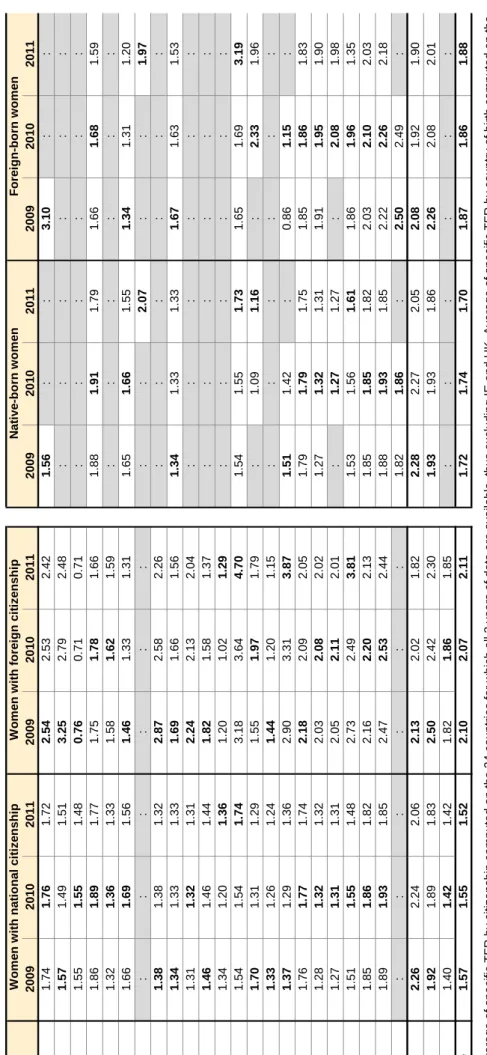
Table 2: Total fertility rate in European countries, 2000-2011
2000 2001 2002 2003 2004 2005 2006 2007 2008 2009 2010 2011 BE 1.67 1.67 1.65 1.66 1.72 1.76 1.80 1.82 1.85 1.84 1.86 1.81 BG 1.26 1.21 1.21 1.23 1.29 1.32 1.38 1.42 1.48 1.57 1.49 1.51 CZ 1.14 1.14 1.17 1.18 1.23 1.28 1.33 1.44 1.50 1.49 1.49 1.43 DK 1.77 1.74 1.72 1.76 1.78 1.80 1.85 1.84 1.89 1.84 1.87 1.75 DE 1.38 1.35 1.34 1.34 1.36 1.34 1.33 1.37 1.38 1.36 1.39 1.36 EE 1.38 1.34 1.37 1.37 1.47 1.50 1.55 1.63 1.65 1.62 1.63 1.52 IE 1.89 1.94 1.97 1.96 1.93 1.86 1.92 2.01 2.10 2.10 2.07 2.05 EL 1.26 1.25 1.27 1.28 1.30 1.33 1.40 1.41 1.51 1.52 1.51 1.42 ES 1.23 1.24 1.26 1.31 1.32 1.34 1.37 1.39 1.46 1.39 1.38 1.36 FR 1.89 1.90 1.88 1.89 1.92 1.94 2.00 1.98 2.01 2.00 2.03 2.01 IT 1.26 1.25 1.27 1.29 1.33 1.32 1.35 1.37 1.42 1.41 1.41 1.40 CY 1.64 1.57 1.49 1.50 1.49 1.42 1.45 1.39 1.46 1.51 1.44 1.35 LV : : 1.23 1.29 1.24 1.31 1.35 1.41 1.44 1.31 1.17 1.34 LT 1.39 1.30 1.24 1.26 1.26 1.27 1.31 1.35 1.47 1.55 1.55 1.76 LU 1.76 1.66 1.63 1.62 1.66 1.63 1.65 1.61 1.61 1.59 1.63 1.52 HU 1.32 1.31 1.30 1.27 1.28 1.31 1.34 1.32 1.35 1.32 1.25 1.23 MT 1.70 1.48 1.45 1.48 1.40 1.38 1.39 1.37 1.44 1.43 1.38 1.49 NL 1.72 1.71 1.73 1.75 1.72 1.71 1.72 1.72 1.77 1.79 1.79 1.76 AT 1.36 1.33 1.39 1.38 1.42 1.41 1.41 1.38 1.41 1.39 1.44 1.42 PL 1.37 1.31 1.25 1.22 1.23 1.24 1.27 1.31 1.39 1.40 1.38 1.30 PT 1.55 1.45 1.47 1.44 1.40 1.40 1.36 1.33 1.37 1.32 1.36 1.35 RO 1.31 1.27 1.25 1.27 1.29 1.32 1.32 1.30 1.35 1.38 1.33 1.25 SI 1.26 1.21 1.21 1.20 1.25 1.26 1.31 1.38 1.53 1.53 1.57 1.56 SK 1.30 1.20 1.19 1.20 1.24 1.25 1.24 1.25 1.32 1.41 1.40 1.45 FI 1.73 1.73 1.72 1.76 1.80 1.80 1.84 1.83 1.85 1.86 1.87 1.83 SE 1.54 1.57 1.65 1.71 1.75 1.77 1.85 1.88 1.91 1.94 1.98 1.90 UK 1.64 1.63 1.64 1.71 1.77 1.78 1.84 1.90 1.96 1.94 1.98 1.96 IS 2.08 1.95 1.93 1.99 2.04 2.05 2.08 2.09 2.15 2.23 2.20 2.02 NO 1.85 1.78 1.75 1.80 1.83 1.84 1.90 1.90 1.96 1.98 1.95 1.88 CH 1.50 1.38 1.39 1.39 1.42 1.42 1.44 1.46 1.48 1.50 1.52 1.52 HR : : 1.34 1.32 1.34 1.41 1.38 1.40 1.46 1.49 1.46 1.40 Average 1.52 1.48 1.46 1.48 1.50 1.51 1.54 1.56 1.61 1.61 1.61 1.58
Notes:’:’ =not available; average for 2000 and 2001 without LV and HR, thus likely overestimated. In bold, maximum value across years for the specific country. Source: Eurostat (online data code: demo_find).
Changes in fertility partially follow changes in the economy, with an average lag
of less than two years
It may be difficult to disentangle what could be a ‘natural’ decrease in the number of live births, due to the shrinking number of women of childbearing age and/or to the continuing decline in their fertility rates, from the impact of an occasional shock, such as an economic crisis. A recession can influence fertility in various ways, although its effect may be softened by government interventions. Apart from the direct impact of the crisis at individual level, the economic uncertainty that can spread in periods of hardship may influence fertility. From this point of view, the duration of a crisis may play an important role and, in some countries, the duration and the depth of the current recession are
unprecedented.
Table 3 reports the correlations between the time series of the changes in the TFR and in selected indicators of economic crisis for each European country. In fact, the interest here is in looking at the potential link between changes in economic
conditions and changes in fertility behaviour. These correlations have been computed taking into account a lag in the TFR from 0 to 3 years: hence, four correlations were computed for each country and indicator. Table 3 only shows the highest values of the correlations (with the expected sign), together with the lag at which they were found. To focus on the effect of the economic crisis, the correlations were computed using annual data from 2000 to 2011, which makes the number of available cases rather limited, especially for correlations between time series shifted by 3 years. Results also depend on the quality of the demographic data, which may be affected by various issues (see methodological notes).
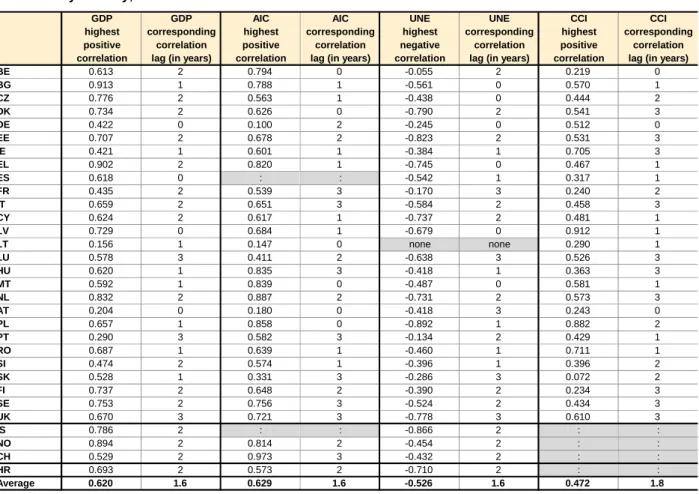
The usual indicator of economic growth is based on the GDP. The expected relationship is that negative changes in GDP correspond to negative changes in the TFR, possibly with some delay, thus showing a high positive correlation at particular lags. The correlation with the TFR is relevant in Spain and Latvia without any lag; in Bulgaria, Poland and Romania with one year of lag; and in the Czech Republic, Denmark, Estonia, Greece, the Netherlands, Finland, Sweden, Iceland, Norway and Croatia with two years of lag. Taking the overall average across countries, a change in GDP is mostly positively correlated with a change in the TFR within about 19 months.
It must be noted that in some countries, there may also be negative correlations at some lags, thus supporting the hypothesis of TFR changes
counter-cyclical to the economic trends, but usually their intensity is lower than the positive correlations at different lags. Exceptions in this regard are Latvia, Lithuania, Malta, Austria and Romania. For Malta, Austria and Romania, these negative correlations do not seem to be relevant once the number of available cases is taken into account, whereas they are noticeable for Lithuania at lag 2 and for Latvia at lag 3. In these two countries, the evidence would suggest changes in TFR negatively correlated with changes in GDP.
Another indicator selected for this study is Actual Individual Consumption (AIC), which is
considered to provide a better measure of the material welfare condition of households, because it refers to goods and services actually consumed by individuals, irrespective of whether these goods and services are purchased and paid for by
households, by government, or by non-profit organisations. By looking at the correlation of the changes in AIC with changes in TFR, the intention is to analyse the impact of the changing material situation of households, rather than the country’s living standards (as measured by the GDP), on fertility behaviour. Likewise for GDP, the expected relationship between changes in AIC and TFR is positive.
Most relevant positive correlations between AIC and lagged TFR are found for Belgium, Denmark, Malta and Poland at lag zero; for Bulgaria, Greece, Latvia and Romania with a lag of one year; for Estonia, the Netherlands and Norway with a lag of two years; and for Hungary, Sweden, the United Kingdom and Switzerland with a lag of three years. The average lag (without Spain and Iceland) for a change in TFR is thus again of about 19 months. However, in Germany, Cyprus, Luxembourg and Austria, there is a negative correlation higher in absolute values than the positive one, but still at negligible levels, whereas in Latvia and Lithuania, this negative correlation is rather noticeable. The next indicator is the annual unemployment rate for the age group 15-49 (UNE). The expected relationship here is with negative sign, meaning that a positive change of the UNE should be correlated with a negative change of the (lagged) TFR. This is particularly the case for Greece and Latvia without lag; for Poland with one year of lag; for Denmark, Estonia, Cyprus, the Netherlands and Iceland with two years of lag; and for the United Kingdom with three years of lag. The country where there is a positive correlation higher than the
6 13/2013— Statistics in focus
negative are Belgium, the Czech Republic, France, Lithuania, Portugal and Slovenia, but none
relevant. On average, changes in the
unemployment rate would then be negatively correlated with changes in TFR lagged by about 19 months, as in the case of GDP and AIC. The last indicator used for Table 3 is the annual average of the consumers’ confidence index (CCI), meant to measure the sentiment of economic uncertainty. As for GDP and AIC, the correlation between changes in the CCI and lagged changes in the TFR is expected to be positive. The values are particularly relevant only for Latvia and Romania, with one year of lag, and for Poland with two years of lag. However, several countries have negative
correlations higher in absolute value than the highest positive: Belgium, Austria, Slovakia, Finland, Sweden, and particularly Spain, Lithuania and Luxembourg. Privileging the pro-cyclical relationship between CCI and TFR, on average, a change in consumers’ confidence would be correlated with a change in the TFR, delayed by about 22 months.
In general, the correlations of economic indicators with the lagged TFR have the expected sign in most countries, though not particularly significant. However, in a few cases, it cannot be excluded that the economic crisis may actually open a ‘window of opportunity’ for childbearing, especially for specific population groups.
Table 3: Highest correlations and corresponding lags of the TFR with various indicators of economic recession by country, 2000-2011
GDP GDP AIC AIC UNE UNE CCI CCI
highest corresponding highest corresponding highest corresponding highest corresponding positive correlation positive correlation negative correlation positive correlation correlation lag (in years) correlation lag (in years) correlation lag (in years) correlation lag (in years)
BE 0.613 2 0.794 0 -0.055 2 0.219 0 BG 0.913 1 0.788 1 -0.561 0 0.570 1 CZ 0.776 2 0.563 1 -0.438 0 0.444 2 DK 0.734 2 0.626 0 -0.790 2 0.541 3 DE 0.422 0 0.100 2 -0.245 0 0.512 0 EE 0.707 2 0.678 2 -0.823 2 0.531 3 IE 0.421 1 0.601 1 -0.384 1 0.705 3 EL 0.902 2 0.820 1 -0.745 0 0.467 1 ES 0.618 0 : : -0.542 1 0.317 1 FR 0.435 2 0.539 3 -0.170 3 0.240 2 IT 0.659 2 0.651 3 -0.584 2 0.458 3 CY 0.624 2 0.617 1 -0.737 2 0.481 1 LV 0.729 0 0.684 1 -0.679 0 0.912 1 LT 0.156 1 0.147 0 none none 0.290 1 LU 0.578 3 0.411 2 -0.638 3 0.526 3 HU 0.620 1 0.835 3 -0.418 1 0.363 3 MT 0.592 1 0.839 0 -0.487 0 0.581 1 NL 0.832 2 0.887 2 -0.731 2 0.573 3 AT 0.204 0 0.180 0 -0.418 3 0.243 0 PL 0.657 1 0.858 0 -0.892 1 0.882 2 PT 0.290 3 0.582 3 -0.134 2 0.429 1 RO 0.687 1 0.639 1 -0.460 1 0.711 1 SI 0.474 2 0.574 1 -0.396 1 0.396 2 SK 0.528 1 0.331 3 -0.286 3 0.072 2 FI 0.737 2 0.648 2 -0.390 2 0.234 3 SE 0.753 2 0.756 3 -0.524 2 0.434 3 UK 0.670 3 0.721 3 -0.778 3 0.610 3 IS 0.786 2 : : -0.866 2 : : NO 0.894 2 0.814 2 -0.454 2 : : CH 0.529 2 0.973 3 -0.432 2 : : HR 0.693 2 0.573 2 -0.710 2 : : Average 0.620 1.6 0.629 1.6 -0.526 1.6 0.472 1.8
Notes: ‘:‘ = data not available; none = no correlation of the selected sign. TFR = year-on-year change of the total fertility rate; GDP = year-on-year change of the gross domestic product at market prices in euros per capita, chain-linked volumes, reference year 2000 (at 2000 exchange rates); AIC = year-on-year change of the actual individual consumption in euros per capita, chain-linked volumes, reference year 2000 (at 2000 exchange rates); UNE = year-on-year change of the unemployment rates from 15 to 49 years; CCI = year-on-year change of the consumer confidence indicator, annual average. Annual TFR data not available for LV (2000, 2001) and HR (2000, 2001); annual AIC data not available for FI, CH (2011) and HR (2010, 2011); annual UNE data not available for HR (2000, 2001); annual CCI data not available for BG (2000), CY (2000), LT (2000), LU (2000, 2001), MT (2000, 2001), PL (2000) and RO (2000).
Source: computation of the author on Eurostat data (online data codes: demo_find, demo_gind, nama_gdp_k, nama_fcs_k,
lfsa_urgan) and on data from the Business and Consumer Surveys of the Directorate General for Economic and Financial Affairs of
Slight tendency to wider decreases in first births than in subsequent births
An economic crisis may prompt would-be parentsto postpone childbearing, especially if they are childless. Table 4 shows the quota of the TFR attributable to live births from (previously) childless women (TFR 1) and that for women who already had at least one child (TFR 2+). Due to data unavailability, these indicators could not be computed making reference to the population composition by parity (the number of live births a woman had in the past). Thus the female
population ‘exposed’ to childbearing is the total number of women of childbearing age, regardless of any previous live birth they may have delivered. By multiplying the percentages in Table 4 with the corresponding TFR value in Table 2, the values of TFR 1 and TFR 2+ (not shown here) can be obtained.
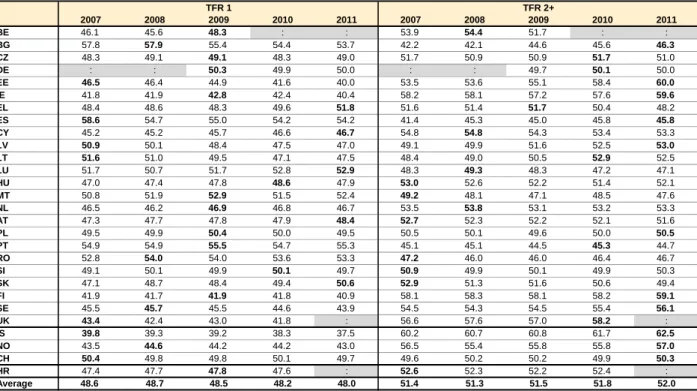
In general, the decrease from the respective peak value over 2007-2011 was slightly more relevant for the first-order TFR. However, on the whole, the two rates mostly moved together, so by 2011, the difference between them did not increase much. A
particular case is Greece, where the TFR of order two and higher has plummeted over recent years, falling below the TFR of first order, which rose slightly.
In proportion to the overall TFR, in Bulgaria, Estonia, Spain, Latvia and Lithuania, the decrease in the TFR 1 from the peak value over the four years to 2011 is higher than 3 percentage points (p.p.), and in Ireland and in the Nordic countries the decrease is between 1 and 3 p.p.
A few countries saw the proportion of TFR attributable to childless women rise, as in Greece and Slovakia. On average across all countries, there was a slight reduction over time of the proportion of TFR attributable to first-order live births. This means that the changes in TFR 1 were either somewhat less positive or more negative than those of TFR 2, or even trended in the opposite
(negative) direction.
Table 4: Percentage of TFR attributable to live births of first order (TFR 1) and to live births of order two and over (TFR 2+), 2007-2011 TFR 1 TFR 2+ 2007 2008 2009 2010 2011 2007 2008 2009 2010 2011 BE 46.1 45.6 48.3 : : 53.9 54.4 51.7 : : BG 57.8 57.9 55.4 54.4 53.7 42.2 42.1 44.6 45.6 46.3 CZ 48.3 49.1 49.1 48.3 49.0 51.7 50.9 50.9 51.7 51.0 DE : : 50.3 49.9 50.0 : : 49.7 50.1 50.0 EE 46.5 46.4 44.9 41.6 40.0 53.5 53.6 55.1 58.4 60.0 IE 41.8 41.9 42.8 42.4 40.4 58.2 58.1 57.2 57.6 59.6 EL 48.4 48.6 48.3 49.6 51.8 51.6 51.4 51.7 50.4 48.2 ES 58.6 54.7 55.0 54.2 54.2 41.4 45.3 45.0 45.8 45.8 CY 45.2 45.2 45.7 46.6 46.7 54.8 54.8 54.3 53.4 53.3 LV 50.9 50.1 48.4 47.5 47.0 49.1 49.9 51.6 52.5 53.0 LT 51.6 51.0 49.5 47.1 47.5 48.4 49.0 50.5 52.9 52.5 LU 51.7 50.7 51.7 52.8 52.9 48.3 49.3 48.3 47.2 47.1 HU 47.0 47.4 47.8 48.6 47.9 53.0 52.6 52.2 51.4 52.1 MT 50.8 51.9 52.9 51.5 52.4 49.2 48.1 47.1 48.5 47.6 NL 46.5 46.2 46.9 46.8 46.7 53.5 53.8 53.1 53.2 53.3 AT 47.3 47.7 47.8 47.9 48.4 52.7 52.3 52.2 52.1 51.6 PL 49.5 49.9 50.4 50.0 49.5 50.5 50.1 49.6 50.0 50.5 PT 54.9 54.9 55.5 54.7 55.3 45.1 45.1 44.5 45.3 44.7 RO 52.8 54.0 54.0 53.6 53.3 47.2 46.0 46.0 46.4 46.7 SI 49.1 50.1 49.9 50.1 49.7 50.9 49.9 50.1 49.9 50.3 SK 47.1 48.7 48.4 49.4 50.6 52.9 51.3 51.6 50.6 49.4 FI 41.9 41.7 41.9 41.8 40.9 58.1 58.3 58.1 58.2 59.1 SE 45.5 45.7 45.5 44.6 43.9 54.5 54.3 54.5 55.4 56.1 UK 43.4 42.4 43.0 41.8 : 56.6 57.6 57.0 58.2 : IS 39.8 39.3 39.2 38.3 37.5 60.2 60.7 60.8 61.7 62.5 NO 43.5 44.6 44.2 44.2 43.0 56.5 55.4 55.8 55.8 57.0 CH 50.4 49.8 49.8 50.1 49.7 49.6 50.2 50.2 49.9 50.3 HR 47.4 47.7 47.8 47.6 : 52.6 52.3 52.2 52.4 : Average 48.6 48.7 48.5 48.2 48.0 51.4 51.3 51.5 51.8 52.0
Notes: ‘:‘= not available. Data for missing countries (DK, FR and IT) not available. Average computed on the 24 countries for which all 5 years of data are available, thus excluding BE, DE, UK and HR. Live birth order for UK refers only to births within marriage. In bold, maximum value across years for the specific country and live birth order.
8 13/2013 — Statistics in focus
Mixed fertility behaviour across countries for employed and non-employed
women
Because the economic crisis may have differing effects on the fertility behaviour of different categories of women, it is interesting to look at values for the specific fertility indicator for selected population breakdowns.
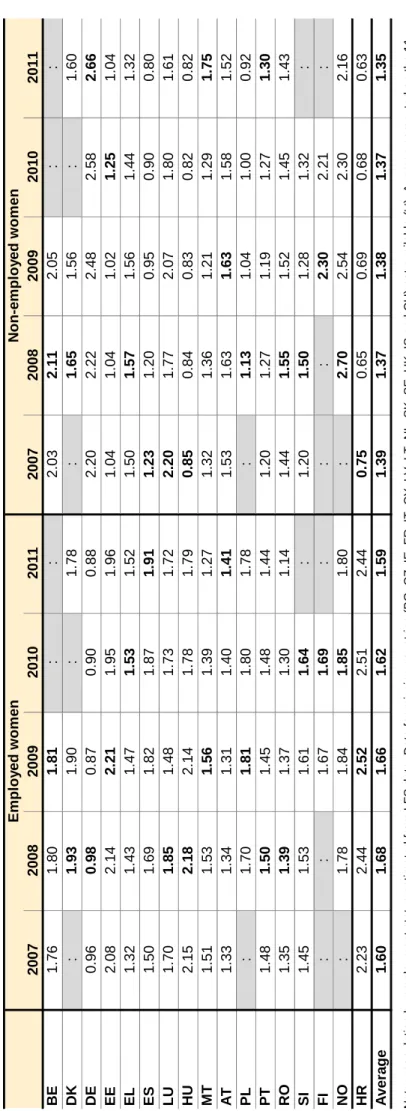
Table 5 shows the specific TFR for employed and non-employed women, the latter comprising unemployed and inactive women. Across countries, the differential fertility according to employment status is not consistently positive or negative between 2007 and 2011. In Belgium, Germany, Austria, Romania, Finland and Norway, non-employed women have higher fertility than those employed; the opposite applies for the other countries for which data are available, except for Greece, Luxembourg and Malta, where the group with higher fertility changes over time.
Differentials in fertility by employment status can reach remarkable values in both directions: in Germany, in 2011, employed women have 1.8 live births fewer than non-employed women, about the same value as in Croatia, where the differential is reversed.
The tendency of fertility in the two groups over recent years is not consistent across Europe. In some countries, the differentials have further increased; in other countries, specific TFR have been converging, sometimes even reversing the sign of the differential.
For instance, in Germany, the fertility of non-employed women has increased and that of
employed women decreased, while in Spain, the opposite occurred; in Greece, the TFR of non-employed women fell below that of non-employed women, changing from a positive differential of about 0.2 average live births for non-employed women to a similar value for employed women; in Norway, the two groups converged.
It is thus difficult to detect a common pattern across Europe, taking into account that fertility behaviour in population groups defined according to their relationship to the labour market may be influenced by national policies to combine work and family life.
As total TFR also depends also on the composition of the population (see methodological notes), an increase or decrease in a specific TFR does not necessarily impact much on the overall TFR. For instance, in Germany, the proportion of women of childbearing age classified as non-employed is slightly above one third. Hence, the relatively high fertility of this population group influences the overall TFR much less than that of employed women of childbearing age, whose fertility is even below one live birth per (employed) woman. In fact, the increase of 0.46 live births per
non-employed woman over the five years examined has produced little effect on the total TFR, which has continued to be around 1.37 live births per woman (see Table 2), due to the corresponding fall of about 0.10 live births in the TFR of employed women.
Fertility of women with medium education has decreased more visibly than of
those with low or high education
The level of educational attainment is often considered to be a proxy of the socio-economic status of a person. To improve comparability across countries, the national level of educational
attainment is converted according to an
international standard classification of education (ISCED) with seven degrees from 0 to 6. The level zero indicates no formal education and the level 6 corresponds to the highest achievable level of education (such as a PhD).
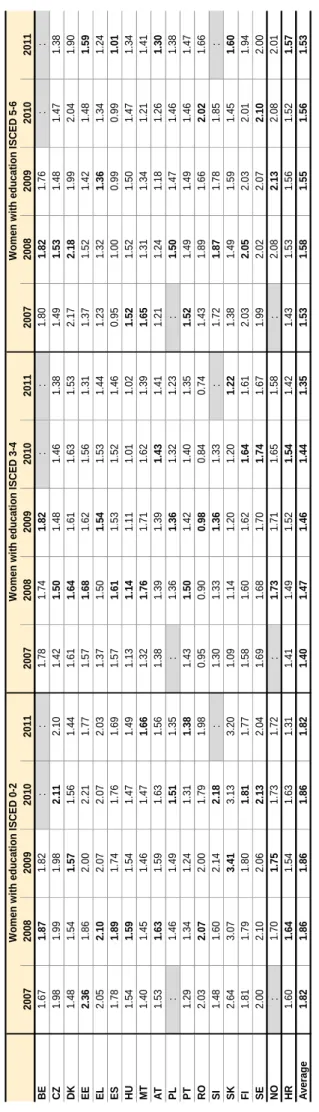
Table 6 shows the specific TFR of women with different levels of educational attainment, grouped in ‘low’ (ISCED from level 0 to level 2), ‘medium’ (ISCED 3-4) and ‘high’ (ISCED 5-6).
Apart from Nordic countries (Denmark, Finland and Norway), Portugal and Malta, in general, women with low education had a higher TFR between 2007 and 2011. Differentials reached a level as high as 2.2 live births per woman (Slovakia, 2009).
Comparing 2011 to the peak year of fertility (in bold in Table 6), on average across countries, the fertility of women with a medium level of education dropped by about 9 %, while the decrease for women with high or low education was less significant. However, the pattern at national level is quite diversified, and the same applies within countries. Fertility may have different patterns in different population groups.
Changes in the specific TFR of population subgroups affect the overall TFR to the extent of their relative weight in the population. So, in general, the same change would have less effect if
it were to occur in the fertility of women with high education, given that their share in the total number of women in childbearing ages is about one fifth (on average across countries).
In most countries, immigrants’ fertility decreased more than that of natives
Citizenship and country of birth are two differentways of looking at migrant status. In general, a foreign-born person has migrated at least once in their lifetime, while a person with foreign citizenship has not necessarily done so, but has a foreign background.
These characteristics may influence the
demographic behaviour in terms of fertility, though in neither case is there a direct indication of the duration of the residence of the person in the host country.
A foreign-born woman could actually have arrived in a country long ago, or even have grown up there, hence being largely influenced by the local culture. A woman with foreign citizenship may acquire the citizenship of the host country — the longer her residence in the host country, the higher the probability that she would change her citizenship, thus possibly leaving the group of women with foreign citizenship (with differences depending on the policies of naturalisation of the country). Table 7 shows the specific TFR of women who hold foreign citizenship or were born abroad. In all countries but the Czech Republic, Denmark, Estonia, Latvia and Iceland, these population groups have higher fertility than national or native-born women. In Cyprus and Hungary, the TFR of foreign women falls below the level of that for national citizens during those three years.
In fact, in almost all countries where the fertility of women with foreign citizenship decreased between 2009 and 2011, the decline was higher than among women with national citizenship, either in absolute or in relative terms. In only two years, in Bulgaria, Greece, Cyprus and Hungary, the TFR decrease for foreigners was more than one fifth of the initial value; on the other hand, strong TFR increases were recorded in Lithuania, Malta and Slovenia, though for Slovenia, the evidence for foreign-born women trends in the opposite direction.
As for the native women, their TFR is more stable, even in countries where the economic crisis has hit hardest, such as Italy, Cyprus, Spain and Portugal, while in Bulgaria, Greece and Hungary, the TFR decrease has been much lower than for foreigners. Luxembourg is a peculiar case in which the fertility of native women has fallen sharply. There have also been quite significant decreases in some Nordic countries, where the level of TFR of native women is relatively high.
As there is no country in which a majority of the population is composed of immigrants, any change in their specific TFR is less relevant (for the overall fertility) than a change in the specific TFR of the native population. However, an increase in the proportion of migrants in countries where their specific fertility is higher than that of natives would increase the overall TFR, even with unchanged specific fertility rates.
10 13/2013 — Statistics in focus
Table 5: Specific total fertilit
y ra tes by employ ment stat us, 2007-2011 Emp lo y e d w o me n N on -e mp lo y e d w o me n 2007 2008 2009 2010 201 1 2 007 2 0 0 8 2009 2 010 2 011 BE 1. 7 6 1 .80 1. 8 1 : : 2.03 2. 11 2.05 : : DK : 1. 9 3 1. 9 0 : 1 .7 8 : 1. 65 1.56 : 1 .60 DE 0. 9 6 0. 9 8 0 .87 0.90 0. 88 2.20 2. 22 2.48 2. 58 2.66 EE 2. 0 8 2 .14 2. 2 1 1.95 1. 96 1.04 1. 04 1.02 1. 25 1.04 EL 1. 3 2 1 .43 1. 4 7 1.53 1. 52 1.50 1. 57 1.56 1. 44 1.32 ES 1. 5 0 1 .69 1. 8 2 1 .8 7 1. 91 1.23 1. 20 0.95 0. 90 0.80 LU 1. 7 0 1. 8 5 1 .48 1.73 1. 72 2.20 1. 77 2.07 1. 80 1.61 HU 2. 1 5 2. 1 8 2 .14 1.78 1. 79 0.85 0. 84 0.83 0. 82 0.82 MT 1. 5 1 1 .53 1. 5 6 1.39 1. 27 1.32 1. 36 1.21 1. 29 1.75 AT 1. 3 3 1 .34 1. 3 1 1 .4 0 1. 41 1.53 1. 63 1.63 1. 58 1.52 PL :1 .7 0 1. 8 1 1.80 1. 78 : 1. 13 1.04 1. 00 0.92 PT 1. 4 8 1. 5 0 1 .45 1.48 1. 44 1.20 1. 27 1.19 1. 27 1.30 RO 1. 3 5 1. 3 9 1 .37 1.30 1. 14 1.44 1. 55 1.52 1. 45 1.43 SI 1. 4 5 1 .53 1. 6 1 1.64 :1 .2 0 1. 50 1.28 1. 32 : FI :: 1 .6 7 1.69 :: : 2.30 2. 21 : NO : 1 .7 8 1 .8 4 1.85 1. 80 : 2. 70 2.54 2. 30 2.16 HR 2. 2 3 2 .44 2. 5 2 2.51 2. 44 0.75 0. 65 0.69 0. 68 0.63 A v e ra g e 1 .6 01 .6 8 1 .6 61 .6 21 .5 91 .3 91 .3 71 .3 81 .3 71 .3 5 Notes: populatio n b y emplo y ment
status estimated from LFS d
a
ta.
Data
for missing countries (BG, C
Z , IE, FR, I T , C Y , LV, LT, NL, SK, S E, UK, IS and CH) not available (‘:‘). Average co mputed on the 1 1 countries for w h ic h all 5 y e a rs of
data are available, thus excl
uding BE, DK, PL, SI, FI and N O . In b o ld, maximum valu e across y ears fo
r the specific cou
n tr y a nd populati on group. Source: computa
tion of the autho
r on Eurostat data
(see methodolo
g
Table 6: Specific total fertilit y rates by edu cational attainment, 2007-2011 W o m e n w it h ed uc ati o n I S CE D 0-2 W o m en w ith ed u cat io n IS C E D 3-4 W o m en w it h ed uca ti o n I S CE D 5-6 2007 2008 200 9 2 010 2011 2007 20 08 2009 2010 201 1 2007 2008 2009 2 010 2011 BE 1.6 7 1. 87 1. 82 : : 1. 7 8 1. 74 1. 82 :: 1 .8 0 1. 82 1. 7 6 : : CZ 1 .98 1. 99 1. 98 2. 11 2. 10 1. 4 2 1. 50 1. 48 1. 46 1. 38 1 .49 1. 53 1. 4 8 1. 47 1. 38 DK 1 .48 1. 54 1. 57 1. 56 1. 44 1. 6 1 1. 64 1. 61 1. 63 1. 53 2 .17 2. 18 1. 9 9 2. 04 1. 90 EE 2.3 6 1. 86 2. 00 2. 21 1. 77 1. 5 7 1. 68 1. 62 1. 56 1. 31 1 .37 1. 52 1. 4 2 1. 48 1. 59 EL 2.0 5 2. 10 2. 07 2. 07 2. 03 1. 3 7 1. 50 1. 54 1. 53 1. 44 1 .23 1. 32 1. 3 6 1. 34 1. 24 ES 1.7 8 1. 89 1. 74 1. 76 1. 69 1. 5 7 1. 61 1. 53 1. 52 1. 46 0 .95 1. 00 0. 9 9 0. 99 1. 01 HU 1.5 4 1. 59 1. 54 1. 47 1. 49 1. 1 3 1. 14 1. 11 1. 01 1. 02 1.5 2 1. 52 1. 5 0 1. 47 1. 34 MT 1 .40 1. 45 1. 46 1. 47 1. 66 1. 3 2 1. 76 1. 71 1. 62 1. 39 1.6 5 1. 31 1. 3 4 1. 21 1. 41 AT 1.5 3 1. 63 1. 59 1. 63 1. 56 1. 3 8 1. 39 1. 39 1. 43 1. 41 1 .21 1. 24 1. 1 8 1. 26 1. 30 PL :1 .4 6 1 .4 9 1. 51 1. 35 : 1 .3 6 1. 36 1. 32 1. 23 : 1. 50 1. 4 7 1. 46 1. 38 PT 1 .29 1. 34 1. 24 1. 31 1. 38 1. 4 3 1. 50 1. 42 1. 40 1. 35 1.5 2 1. 49 1. 4 9 1. 46 1. 47 RO 2.0 3 2. 07 2. 00 1. 79 1. 98 0. 9 5 0. 90 0. 98 0. 84 0. 74 1 .43 1. 89 1. 6 6 2. 02 1. 66 SI 1 .48 1. 60 2. 14 2. 18 :1 .3 0 1 .3 3 1. 36 1. 33 : 1 .7 2 1. 87 1. 7 8 1. 85 : SK 2 .64 3. 07 3. 41 3. 13 3. 20 1. 0 9 1. 14 1. 20 1. 20 1. 22 1 .38 1. 49 1. 5 9 1. 45 1. 60 FI 1 .81 1. 79 1. 80 1. 81 1. 77 1. 5 8 1. 60 1. 62 1. 64 1. 61 2 .03 2. 05 2. 0 3 2. 01 1. 94 SE 2 .00 2. 10 2. 06 2. 13 2. 04 1. 6 9 1. 68 1. 70 1. 74 1. 67 1 .99 2. 02 2. 0 7 2. 10 2. 00 NO :1 .7 0 1. 75 1. 73 1. 72 : 1. 73 1. 71 1. 65 1. 58 : 2 .0 8 2. 1 3 2. 08 2. 01 HR 1.6 0 1. 64 1. 54 1. 63 1. 31 1. 4 1 1. 49 1. 52 1. 54 1. 42 1 .43 1. 53 1. 5 6 1. 52 1. 57 A v e ra g e 1 .8 21 .8 61 .8 6 1 .8 61 .8 21 .4 0 1 .4 71 .4 61 .4 41 .3 5 1 .5 31 .5 81 .5 5 1 .5 61 .5 3 Notes: populatio n b y ed
ucational attainment estimated from L
F S d a ta for BE, C Z , E E
, EL, ES, HU, A
T , PL, PT, R O , S I, SK and HR. Av erag e compute d on the 14 count ries for w h ich all 5 y e ars of data ar e
available, thus excluding BE, PL, SI and N
O . In bol d, maximum valu e across y ears fo
r the specific cou
n tr y a nd populati on group. ‘:‘=not available Source: computa
tion of the autho
r on Eurostat data
(see methodolo
g
ical notes
) (online data codes:
d e mo_faeduc , de mo_pjanedu ).
12 13/2013 — Statistics in focus
Table 7: Specific total fertilit
y rates by citi zenship (left panels) and by country
of birth (right panels),
2009-2011 W o m e n w it h na ti ona l c it iz e ns hip W o m e n w it h f o re ign c it iz e ns hip N a tiv e -born w o m e n Fore ign-b o rn w o m e n 2009 20 10 2011 2009 2010 2011 2009 2010 2011 2009 2 010 2011 BE 1. 74 1.76 1. 72 2. 54 2. 53 2. 42 1. 56 :: 3. 10 :: BG 1. 57 1.49 1. 51 3. 25 2. 79 2. 48 : : : : : : CZ 1. 55 1.55 1. 48 0. 76 0. 71 0. 71 : : : : : : DK 1. 86 1.89 1. 77 1. 75 1. 78 1. 66 1. 88 1. 91 1. 79 1. 66 1. 6 8 1. 59 DE 1. 32 1.36 1. 33 1. 58 1. 62 1 .5 9 :: :: :: EE 1. 66 1.69 1. 56 1. 46 1. 33 1. 31 1. 65 1. 66 1. 55 1. 34 1 .31 1. 20 IE : ::: :: :: 2. 07 :: 1. 97 E L 1. 38 1.38 1. 32 2. 87 2. 58 2. 26 : : : : : : E S 1. 34 1.33 1. 33 1. 69 1. 66 1. 56 1. 34 1. 33 1. 33 1. 67 1 .63 1. 53 IT 1. 31 1.32 1. 31 2. 24 2. 13 2. 04 : : : : : : C Y 1. 46 1.46 1. 44 1. 82 1. 58 1. 37 : : : : : : LV 1. 34 1.20 1. 36 1. 20 1. 02 1. 29 :: :: :: LT 1. 54 1.54 1. 74 3. 18 3. 64 4. 70 1. 54 1. 55 1. 73 1. 65 1 .69 3. 19 L U 1. 70 1.31 1. 29 1. 55 1. 97 1. 79 : 1 .0 9 1. 16 : 2. 3 3 1. 96 HU 1. 33 1.26 1. 24 1. 44 1. 20 1. 15 : : : : : : M T 1. 37 1.29 1. 36 2. 90 3. 31 3. 87 1. 51 1. 42 : 0 .8 6 1. 1 5 : NL 1. 76 1.77 1. 74 2. 18 2. 09 2. 05 1. 79 1. 79 1. 75 1. 85 1. 8 6 1. 83 AT 1. 28 1.32 1. 32 2. 03 2. 08 2. 02 1. 27 1. 32 1. 31 1. 91 1. 9 5 1. 90 PT 1. 27 1.31 1. 31 2. 05 2. 11 2. 01 : 1. 27 1. 27 : 2. 0 8 1. 98 SI 1. 51 1.55 1. 48 2. 73 2. 49 3. 81 1. 53 1. 56 1. 61 1. 86 1. 9 6 1. 35 FI 1. 85 1.86 1. 82 2. 16 2. 20 2. 13 1. 85 1. 85 1. 82 2. 03 2. 1 0 2. 03 SE 1. 89 1.93 1. 85 2. 47 2. 53 2. 44 1. 88 1. 93 1. 85 2. 22 2. 2 6 2. 18 UK : ::: :: 1 .8 2 1. 86 : 2. 50 2. 4 9 : IS 2. 26 2.24 2. 06 2. 13 2. 02 1. 82 2. 28 2. 27 2. 05 2. 08 1 .92 1. 90 NO 1. 92 1.89 1. 83 2. 50 2. 42 2. 30 1. 93 1. 93 1. 86 2. 26 2 .08 2. 01 CH 1. 40 1.42 1. 42 1. 82 1. 86 1 .8 5 :: :: :: A v e ra g e 1 .5 7 1 .5 5 1 .5 2 2 .1 0 2 .0 7 2 .1 1 1 .7 2 1 .7 4 1 .7 0 1 .8 7 1 .8 6 1 .8 8 Notes : average o f specific TFR b y citizensh ip co mputed on the 2 4 countries for w h ic h all 3 y ears of d a
ta are available, thus excludi
ng I
E
and UK. Avera
ge of specific TFR b y count ry of b irth computed on the 11 countries for w h ich all 3 y e ars of data are
available, thus excluding BE, BG, C
Z
,
DE, IE, EL, IT, C
Y , LV, L U , HU, M T , PT, UK a nd C H . Data fo r FR, RO, PL, SK an d
HR are missing for both
characteristics. I n bold, maximum value across y e ars for t he specific countr y and po pulati on group. (‘:‘= not available) Source: computa
tion of the autho
r on Eurostat data
(see me
thodolo
g
ical notes) (online
data codes fo r population: mig r_pop2ctz , migr_ pop4ctb ).
Latest monthly data point to fewer countries with decreasing number of live births
There is still little empirical evidence about the path fertility is taking lately. The most up-to-date information is shown in Figure 4, based on the data available for 2012 on live births by month.
Each box shows the relative change, all within the same range ±20 %, from the corresponding month of 2011 of the cumulated number of monthly live births. The horizontal dotted grey line is set to zero, meaning that the cumulated number of live births is
progressing to match what happened the previous year.
Lines in the upper part of the boxes mean that the cumulated number of live births is higher in 2012 than in the same month of 2011, and vice versa. The latest available monthly observations define the length of the line, which can range from a semester up to the entire year, the latter corresponding to the full length of the horizontal axis.
Besides the provisional data, a country may have also provided a forecast for live births for the following months, indicated by a dashed line.
For instance, during the first months of 2012, Lithuania had far fewer live births than in the same period of 2011, but it later recovered, and by the end of the year the (forecasted) cumulated number of live births almost matched the total for the previous year. Greece, Malta and Croatia provided no data for 2012 and thus are not shown in Figure 4.
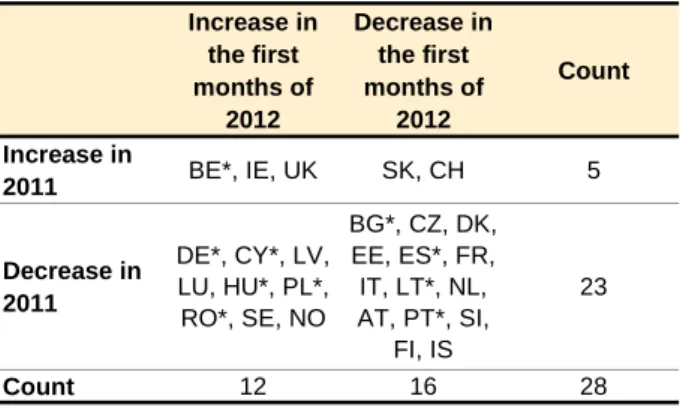
Table 8: Countries by change from previous year of the number of live births in 2011 (full year) and 2012 (up to the available monthly data)
Increase in the first months of 2012 Decrease in the first months of 2012 Count Increase in 2011 BE*, IE, UK SK, CH 5 Decrease in 2011 DE*, CY*, LV, LU, HU*, PL*, RO*, SE, NO BG*, CZ, DK, EE, ES*, FR, IT, LT*, NL, AT, PT*, SI, FI, IS 23 Count 12 16 28
Notes: (*) including forecasted values. Values for 2012 refer to the provisional cumulated data covering only part of the year, variable across countries. EL, MT and HR missing.
Source: computation of the author on Eurostat data (online data code: demo_fmonth)
Table 8 summarises changes in the number of live births, showing that nine countries are expected to invert the negative change observed in 2011, but this will not be the case for half the countries shown. For instance, Germany had about 15 000 fewer live births in 2011 compared to 2010, while the value forecast by the national statistical office for 2012 was about 7 000 live births more than in 2011.
The continuation or reversal of past trends in 2012 may be due either to changes in the number of women of childbearing age and/or in fertility rates, but the data necessary for such disaggregation are not yet available for all countries.
14 13/2013— Statistics in focus Figure 4: Cumulative monthly live births in 2012 (provisional data in percentage change from corresponding month of previous year)
Notes: solid line = provisional data; dashed line = values forecast by the national statistical office. EL, MT and HR missing. Source: computation of the author on Eurostat data (online data code: demo_fmonth).
METHODOLOGICAL NOTES Geographical coverage
The term ‘Europe’ is used for the sake of simplicity to designate the area covered by the following 31 countries, listed according to the EU protocol order (between brackets their code): Belgium (BE), Bulgaria (BG), the Czech Republic (CZ), Denmark (DK), Germany (DE), Estonia (EE), Ireland (IE), Greece (EL), Spain (ES), France (FR), Italy (IT), Cyprus (CY), Latvia (LV), Lithuania (LT), Luxembourg (LU), Hungary (HU), Malta (MT), the Netherlands (NL), Austria (AT), Poland (PL), Portugal (PT), Romania (RO), Slovenia (SI), Slovakia (SK), Finland (FI), Sweden (SE), the United Kingdom (UK), Iceland (IS), Norway (NO), Switzerland (CH) and Croatia (HR).
Data sources
Most of the statistics presented in this report are experimental and are not part of the regular production of Eurostat. All input Eurostat data are provided by the national statistical offices. Population by employment status and by educational attainment are estimated from Labour Force Survey data.
Post-census revisions
For most of the countries, population data for 2011 take into account the results of the latest population census (held in 2011); the time series between the census rounds 2001 and 2011 have not yet been revised. The revision of population data for previous years may lead to changes in the demographic indicators presented in this report. Further, the comparison of these indicators referring to pre-census and post-census years may result in differences which could be at least partially explained with the lack of revision of past population data. Hence, care should be taken when comparing the results for 2011 with previous years.
Demographic indicators
The total fertility rate (TFR) is the most common period indicator of fertility, measuring the average number of live births a woman would deliver if she were to experience the fertility rates of a given period (usually a year). It is computed as the sum over childbearing age of age-specific fertility rates, in their turn computed as the ratio of the number of live births from women of a given age to the number of women of the same age exposed to the risk of childbearing (usually estimated as the average number of women in that year).
The employment-specific TFR, as well as the education-specific TFR and the migration-specific TFR, are computed from age-specific fertility rates of the first type, which relate the number of events specific to a characteristic (live births by employment status, or by educational attainment, or by citizenship, or by country of birth in this report) to the number of women who are at risk of that specific event. For instance, the TFR of employed women is the sum of the age-specific fertility rates computed as the ratio between the live births to employed women at a selected age and the average number of employed women of the same age.
A birth-order specific TFR would then require the number of women by age and parity, but the latter information is not available. Hence, the TFR by birth order presented in this report is a rate of the second kind, i.e. for each childbearing age, it relates live births by birth order to the total number of women, regardless of the number of live births they delivered before.
For each childbearing age, the sum of the age- and characteristic-specific fertility rates weighted with the corresponding share of their population at risk in the total number of women in childbearing age is equal to the total age-specific fertility rate. Therefore, changes in the total TFR could simply reflect changes in the composition of the population at risk by the selected characteristic with unchanged characteristic-specific fertility rates.
The characteristic-specific TFRs are computed by grouping the events and the population at risk by 5-year age group because the computation by single age, though possible, may be too sensitive to small numbers and/or to the sampling size of the population at risk. Where the latter approach is used, the values of the indicators may differ by several percentage points.
Further data quality issues
Where the population breakdown is estimated by Labour Force Survey data, its total population is recalibrated to match the latest revisions available in the demographic data. In some countries, the youngest age classes relevant for employment (e.g., from 15 to 19 years old) may be under-represented in the sample, which would lead to an overestimate of the corresponding age- and characteristic-specific fertility rate, and thus to an over-estimate of the specific TFR.
Misclassification of live births by educational attainment of the mother at younger ages may be particularly influential on the overall total fertility rate. In order to remove such an impact, live births occurring to women aged 18 years and under have all been classified in ISCED 0-2, and those to women aged from 19 to 21 years with ISCED 5-6 reclassified as occurring to women with ISCED 3-4. Hence, age-specific fertility rates are set to zero up to age 18 for women with ISCED 3-4, and up to age 21 for women with ISCED 5-6.