The
2012
Ageing Report
Economic and budgetary projections for the
27 EU Member States (2010-2060)
EURopEAn EconoMy 2|2012
(provisional version)
European Commission
Directorate-General for Economic and Financial Affairs
Economic Policy Committee
Ageing Working Group
The 2012 Ageing Report:
Economic and budgetary projections
for the EU27 Member States (2010-2060)
Joint Report prepared by the European Commission
(DG ECFIN) and the Economic Policy Committee (AWG)
4
MEMBERS OF THE AGEING WORKING GROUP
CHAIRMAN
Mr. Peter PART Bundesministerium für Finanzen
BELGIQUE-BELGIË
Mr. Michel ENGLERT Bureau fédéral du Plan - Federaal Planbureau Ms. Micheline LAMBRECHT Bureau fédéral du Plan - Federaal Planbureau BULGARIA
Ms. Penka TANEVA National Social Security Institute
Ms. Yoana LAZAROVA Ministry of Finance
CZECH REPUBLIC
Mr. Zbynek STORK Ministry of Finance
Mr. Jindrich MARVAL Ministry of Finance
DANMARK
Mr. Jakob Egholt SØGAARD Ministry of Finance Mr. Jørgen SLOTH BIERRE HANSEN Ministry of Finance BUNDESREPUBLIK DEUTSCHLAND
Ms. Stefanie WOLFF-HAMACHER Bundesministerium der Finanzen
Mr. Thomas SALZMANN Bundesministerium für Arbeit und Soziales ESTONIA
Mr. Tanel STEINBERG Ministry of Finance Ms. Pille MIHKELSON Ministry of Finance ELLAS
Mr. Athanasios C. THANOPOULOS Ministry of Finance
Ms. Marianna PAPAMICHAIL National Actuarial Authority ESPAÑA
Mr. Alvaro PASTOR Ministerio de Economía y Competitividad
Mr. Juan VARELA Ministerio de Hacienda y Administraciones Publicas
FRANCE
Ms. Marie MAGNIEN Ministère de l'économie, des finances et de
l'industrie
Mr. Thomas LELLOUCH Ministère de l'économie, des finances et de l'industrie
IRELAND
ITALIA
Mr. Rocco APRILE Ministero dell'Economia e delle Finanze
Mr. Marco CACCIOTTI Ministero dell'Economia e delle Finanze CYPRUS
Mr. Costas STAVRAKIS Ministry of Labour and Social Insurance
Ms. Maria MATSI Ministry of Finance
LATVIA
Ms. Kristīne JAKOVLEVA Ministry of Finance
Ms. Sandra STABINA Ministry of Welfare
LITHUANIA
Ms. Rasa SLIOGERIENE Ministry of Finance
Ms. Vidija PASTUKIENE Ministry of Social Security and Labour LUXEMBOURG
Mr. François PELTIER STATEC
Mr. Tom DOMINIQUE Inspection Générale de la Securité Sociale HUNGARY
Ms. Edit LENDVAI Ministry for National Economy
Mr. Marton SZILI Ministry for National Economy
MALTA
Mr. Godwin MIFSUD Ministry of Finance, the Economy and Investment Ms. Pauline MERCIECA Ministry of Finance, the Economy and Investment NEDERLAND
Mr. Harry TER RELE Centraal Planbureau
Mr. Emiel AFMAN Ministry of Finance
ÖSTERREICH
Mr. Stefan SCHIMAN Bundesministerium für Finanzen
Mrs. Caroline HABERFELLNER Bundesministerium für Finanzen POLAND
Ms. Joanna STACHURA Ministry of Finance
Mr. Pawel STRZELECKI National Bank of Poland PORTUGAL
Mr. Conceicao NUNES Ministry of Finance
ROMANIA
Mrs. Iuliana DASCALU Ministry of Public Finance
6
SLOVENIA
Mrs. Saša JAZBEC Ministry of Finance
Ms. Eva ZVER Institute of Macroeconomic Analysis and
Development SLOVAKIA
Mr. Rastislav GABIK Ministry of Finance
Mr. Marek PORUBSKY Ministry of Finance SUOMI FINLAND
Mr. Jussi HUOPANIEMI Ministry of Finance Mr Juho KOSTIAINEN Ministry of Finance SVERIGE
Mr Jonas NORLIN Ministry of Finance
Mr. Olle SUNDBERG Ministry of Finance
Mr. Thomas EISENSEE Ministry of Finance UNITED KINGDOM
Mr. Thomas HEMINGWAY HM Treasury
Mr. Joseph ROBINS Office for Budget Responsibility
Mr. Mirko LICCHETTA HM Treasury
OBSERVERS
Mr. Yngvar DYVI Ministry of Finance, Norway
Mr. Per-Mathis KONGSRUD Ministry of Finance, Norway
Mr. Eythor BENEDIKTSSON Icelandic Mission to the European Union EUROPEAN CENTRAL BANK
Mr. Michal SLAVIK EUROSTAT
Ms. Anne CLEMENCEAU Mr. Giampaolo LANZIERI EFC/EPC SECRETARIAT Mr. Alvaro LOPEZ BARCELO Mr. Fuat VARDAR Mr. Balazs HORVATH EUROPEAN COMMISSION Mr. Giuseppe CARONE Mr. Per ECKEFELDT Mr. Lucio PENCH
TABLE OF CONTENTS
SUMMARY AND MAIN CONCLUSIONS ... 21
1. Underlying demographic and macroeconomic assumptions... 45
1.1. Population projection ... 45
1.1.1. Fertility ... 45
1.1.2. Life expectancy ... 47
1.1.3. Net migration flows... 51
1.1.4. Overall results of the EUROPOP2010 population projection... 54
1.1.5. Population ageing is a global phenomenon... 61
1.2. Labour force projections ... 63
1.2.1. Overview ... 63
1.2.2. Main results of the projection of labour market participation rates ... 66
1.2.3. Assumptions on structural unemployment... 70
1.2.4. Employment projections ... 70
1.2.5. The balance of non workers to workers: the economic dependency ratios emerging from the labour force projection ... 71
1.2.6. Total hours worked projected to decline ... 75
1.3. Labour productivity and GDP ... 75
1.3.1. Main results of the projections ... 75
1.3.2. Comparison with the 2009 long-term projections... 80
2. Pensions ... 87
2.1. Introduction ... 87
2.2. Coverage of pension projections ... 88
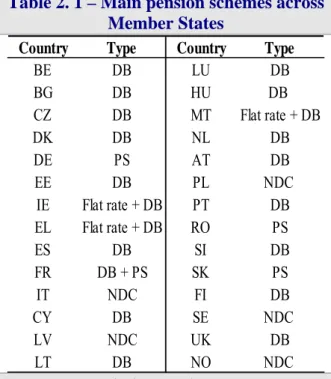
2.3. Characteristics of pension systems in Europe ... 89
2.4. Pension expenditure projections... 101
2.4.1. Public pensions... 101
2.4.2. Occupational and private pensions... 107
2.5. Pension expenditure development over time ... 110
2.6. Drivers of pension expenditure ... 115
2.6.1. Decomposition of the projected pension expenditure ... 115
2.6.2. Benefit ratio and replacement rates... 127
2.6.3. Pension indexation ... 131
2.7. Decomposition of new pensions ... 132
2.8. Sensitivity tests... 136
2.9. Comparison with the 2009 round of projections... 142
Annex I: Pension projection questionnaire ... 147
Annex II: Coverage of pension projections and open issues with respect to Member States' projection coverage... 150
Annex III: Detailed overview of indexation rules... 152
Annex IV: Comparison with the 2009 round of projections based on 2007 as reference year for the 2009 Ageing report ... 154
21
SUMMARY AND MAIN CONCLUSIONS
Overview of the 2012 long-term budgetary projection exercise
Organisation and discharge of the mandate
An ageing population raises challenges for our societies and economies, culturally, organisationally and from an economic point of view. Policy makers worry about how living standards will be affected as each worker has to provide for the consumption needs of a growing number of elderly dependents. Markets worry about fiscal sustainability and the ability of policy makers to address timely and sufficiently these challenges in several Member States. The seriousness of the challenge depends on how our economies and societies respond and adapt to these changing demographic conditions. Looking ahead, policy makers need to ensure long-term fiscal sustainability in the face of large but predictable challenges, as well as significant uncertainty. This is all the more true as Europe has experienced the deepest recession in decades, which is putting an unprecedented stress on workers and enterprises and has had a major negative impact on public finances.
Already in 2001, the Stockholm European Council emphasised the need for the Council to “regularly review the long term sustainability of public finances, including the expected
strains caused by the demographic changes ahead”. In 2009, the ECOFIN Council gave a
mandate to the Economic Policy Committee (EPC) to update and further deepen its common exercise of age-related expenditure projections by 2012, on the basis of a new population projection by Eurostat (EUROPOP2010).
In light of this mandate, the EPC and the Commission (Directorate-General for Economic and Financial Affairs - DG ECFIN) developed a work programme with broad arrangements to organise the budgetary projection and reach agreement on its assumptions and methodologies. The projections of all government expenditure items are made on the basis of common macroeconomic assumptions endorsed by the EPC and a "no policy change" assumption, i.e. reflecting only already enacted legislation. Reforms legislated after
December 2011 have not been taken into account in the projections.1 This report presents the
expenditure projections covering pensions, health care, long-term care, education and unemployment transfers for all Member States.
The work was carried out by the EPC Working Group on Ageing Populations (AWG), which gathered experts from the 27 Member States and Norway and the European Commission represented by the Directorate-General for Economic and Financial Affairs (DG ECFIN). The European Central Bank and the International Monetary Fund have also contributed. Eurostat has played a key role by preparing demographic projections (EUROPOP2010). The EPC and its AWG coordinated the work with their counterparts in other Council formations, in particular the Social Protection Committee. In the preparation of the population projection, Eurostat actively consulted national statistical institutes in the Member States.
This is the fourth time since 2001 that long-run economic and budgetary projections aimed at assessing the impact of ageing population have been released. This projection exercise builds
1 For details, see Box 2: "Latest legislated pension reforms not incorporated in the Ageing Report 2012 projections", in Chapter 2.
on, updates and improves methodologically further the previous exercises so as to enhance overall accuracy, comparability across countries, consistency across expenditure items and the economic basis for the underlying assumptions.
The projections feed into a variety of policy debates at EU level, including the overarching Europe 2020 strategy for smart, sustainable and inclusive growth. In particular, they are used in the annual assessment of the sustainability of public finances carried out as part of the Stability and Growth Pact and in the analysis on the impact of ageing populations on the labour market and potential economic growth.
Graph 1 - Overview of the 2012 long-term budgetary projections
Demographic and economic projections Budgetary projections
Population 2010-2060 EUROPOP2010 Labour Productivity Production function method Labour input Cohort method Unemployment Convergence to ECFIN estimate of NAIRU Real interest rate (constant) GDP Production function Unemployment benefits Health care Long-term care Education Strictly- age- related public spending (unempl. benefits excluded) Pensions National models Total age- related public spending
Source: Commission services, EPC.
Coverage and general overview
Graph 1 above presents an overview of the entire public expenditure projection exercise. The starting point is the EUROPOP2010 population projection for the period 2010 to 2060. The EPC agreed on a common set of assumptions and methodologies in order to make projections on a set of exogenous macroeconomic variables, covering the labour force (participation, employment and unemployment rates), labour productivity and the real interest rate. This combined set of economic projections enabled the calculation of GDP for all Member States
up to 2060.2 The macroeconomic assumptions on which this report is based were agreed in
the first half of 2011 and published in September 2011; the latest macroeconomic developments may thus not be fully captured.
On the basis of these assumptions, separate budgetary projections were run for the age-related expenditure items (pensions, health care, long-term care, education and
23 unemployment benefits). Since unemployment benefits are more affected by cyclical fluctuations, two different scopes of age-related expenditures are considered to present the results for the AWG reference and risk scenarios: including those benefits (“total age-related
spending”)3 and excluding them (“strictly-age-related spending”). The projections for
pensions are run by the Member States using their own national model(s). In this way, the projections benefit from capturing the country-specific circumstances prevailing in the different Member States as a result of different pension legislations, while at the same time consistency is ensured by basing the projections on commonly agreed underlying assumptions. The projections for health care, long-term care, education and unemployment are run by the Commission services (DG ECFIN), on the basis of a common projection model for each expenditure item. The results of this set of projections are aggregated to provide an overall projection of age-related public expenditures. In the EU as a whole, strictly-age-related spending (unemployment benefits excluded) was 25% of GDP and unemployment benefit spending was 1.1% of GDP in 2010, which together accounts for about 50% of general government expenditure.
This report is structured in two parts. The first one describes the underlying assumptions: the population projection, the labour force projection and the macroeconomic assumptions used. The second part presents the term budgetary projections on pensions, health care, long-term care, education and unemployment benefits. A statistical annex gives an overview of the projection results by country.
Use and limitations of long-term economic and budgetary projections
To grasp the challenges that the future demographic changes in Europe represent, it is necessary to consider the age-structure of the population today and how it will look in coming decades, so as to shed light on the economic challenges that policy-makers will have to face. The long-term projections provide an indication of the timing and scale of economic changes that would result from an ageing population in a "no-policy change" scenario. They show where, when, and to what extent, ageing pressures will accelerate as the baby-boom generation retires and the average life-span continues to increase. Hence, the projections are helpful in highlighting the immediate and future policy challenges posed for governments by demographic trends.
The long-term projections are not forecasts. Projecting economic developments over the next 50 years is one of the most daunting analytical tasks facing policy makers. The uncertainty surrounding the projections is high and the longer the projection period, the higher the degree of uncertainty. Although we know a lot about workers and pension beneficiaries for the next 20 years, substantial uncertainty remains, for example, on productivity developments, unemployment, migration flows, the health status of the elderly or the incidence of disability and the magnitude of the associated fiscal costs. The projection results are strongly influenced by the underlying assumptions. For this reason, a set of sensitivity tests were carried out, to illustrate the extent to which the public expenditure projections are sensitive to key assumptions. For reasons of transparency, the underlying assumptions were published in
2011.4 Finally, given the current juncture of financial and economic crisis, there is also
considerable uncertainty concerning medium-term economic developments.
3 By comparison, this was the only definition considered in the 2009 Ageing Report.
4 See European Commission and Economic Policy Committee (2011) "2012 Ageing Report: Underlying assumptions and projection methodologies", European Commission, European Economy, No 4.
Main results
Demographic projection
Demographic change is transforming the EU's population structure. The extent and speed of population ageing depend on future trends in life expectancy, fertility and migration. Demographic factors are subject to less variation than economic factors over the short run, however they have exhibited much less stability over the longer term of say, 25 years.
Fertility rates expected to rise slightly…
Only a modest recovery in the total fertility rate, which is the average number of births per woman over her lifetime, is assumed for the EU. The convergence scenario approach employed in the EUROPOP2010 projection entails a process of convergence in the fertility rates across Member States to that of the forerunners countries, currently exhibiting the highest rates (Ireland, France, Sweden and the United Kingdom, Belgium, Denmark and
Finland), over the very long-term.5 For the EU as a whole, the total fertility rate (TFR) is
projected to rise from 1.59 in 2010 to 1.64 by 2030 and further to 1.71 by 2060. In the euro
area6, a slightly lower increase is projected, from 1.57 in 2010 to 1.68 in 2060.7
The fertility rate is projected to increase over the projection period in nearly all Member States, with the exception of Ireland, France, Sweden and the United Kingdom where it decreases (though remaining above 1.9), and in Belgium, Denmark and Finland it is projected to remain stable. Hence, in all countries the fertility rates are expected to remain below the natural replacement rate of 2.1 in the period to 2060. As a result of the convergence assumption, the largest increases in fertility rates are projected to take place in Latvia, Hungary and Portugal, which have the lowest fertility rates in the EU in 2010. The increase is projected to occur gradually, with fertility rates in these countries approaching but not reaching the current EU average fertility rate in 2060.
5 Member States are assumed to converge to a total fertility rate of 1.85 live births per woman. However, this is only a theoretical convergence level, which for most of the countries is not reached within the time horizon of the projections. For further details, see footnote 7.
6 BE, DE, EE, IE, EL, ES, FR, IT, CY, LU, MT, NL, AT, PT, SI, SK and FI.
25
…and further life expectancy gains are projected…
In the EU, life expectancy at birth for males is projected to increase by about 8 years over the projection period, from 76.7 in 2010 to 84.6 in 2060. Life expectancy at birth is projected to increase by 6.5 years for females, from 82.5 in 2010 to 89.1 in 2060, implying a slight convergence of life expectancy between males and females. The largest increases in life expectancy at birth, for both males and females, are projected to take place in the Member States with the lowest life expectancy in 2010. Life expectancy for males in 2010 is the lowest in Bulgaria, Estonia, Latvia, Lithuania, Hungary and Romania, ranging between 67 and 71 years. Some catching-up takes place over the projection period, with increases in life expectancy of more than 11 years up to 2060 for these countries. For females, gains in life expectancy at birth of 8 years or more are projected in Bulgaria, Latvia, Lithuania, Hungary, Romania and Slovakia. Female life expectancy in 2010 in all of these countries is below 80 years.
Given the assumed "convergence hypothesis"8, the projection compresses the spread of life
expectancy at birth for males across the Member States, from 11.7 years in 2010 (Sweden 79.4 and Lithuania 67.7) to 4.8 years in 2060 (85.5 in Sweden and Italy compared with 80.7 in Lithuania). For females, the reduction of the differential in life expectancy at birth is lower, from 7.2 years in 2010 (84.7 in Spain and 77.5 in Bulgaria and Romania) to 3.4 years in 2060 (90 in France and 86.6 in Bulgaria).
In the EU as a whole, life expectancy at age 65 is projected to increase by 5.2 years for males and by 4.9 years for females over the projection period. In 2060, life expectancy at age 65 will reach 22.4 years for males and 25.6 for females, with the projected difference (3.2 years) being smaller than the projected 4.5 year difference in life expectancy at birth. In 2060, the highest life expectancy at age 65 is expected in France for both males (23 years) and females (26.6 years), while the lowest is expected in Bulgaria for both males (20.6 years) and females (23.6 years).
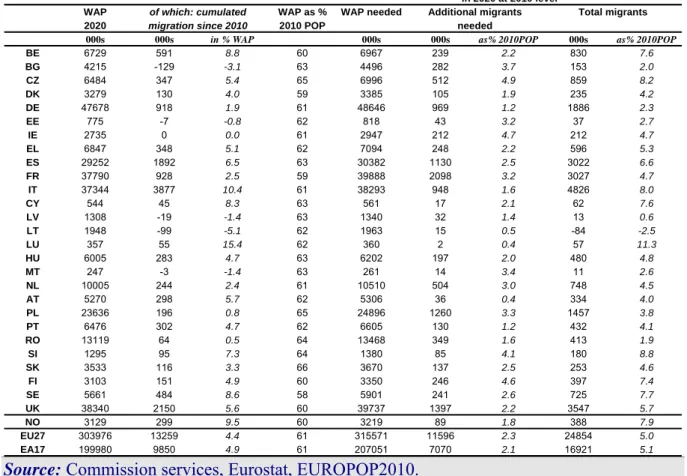
…together with continued, but decelerating inward net migration to the EU
For the EU as a whole, annual net inflows are projected to increase from about 1,043,000 people in 2010 (equivalent to 0.2% of the natural EU population) to 1,332,500 by 2020 and thereafter declining to 945,000 people by 2060.
The cumulated net migration to the EU over the entire projection period is 60.7 million, of which the bulk is in the euro area (45.8 million). Net migration flows are projected to be concentrated to a few destination countries: Italy (15.9 million cumulated up to 2060), Spain (11.2 million) and the United Kingdom (8.6 million). According to the assumptions, Spain and Italy are projected to change from origin countries of migration in the past to destination countries in coming decades.
8 Life expectancy increases are assumed to be greater for countries at lower levels of life expectancy and smaller for those at higher levels, thus following convergent trajectories. The countries converge towards a long-term theoretical age pattern of mortality following an exponential interpolation, thus mortality improvements take place at a decreasing pace. Those theoretical levels are not reached within the time horizon of the projections. For further details, see footnote 7.
For countries that are experiencing a net outflow (BG, EE, LV, LT, MT, IE and RO), this is
projected to taper off or reverse in the coming decades. 9
The EU population is projected to increase up to 2040 and decline thereafter…
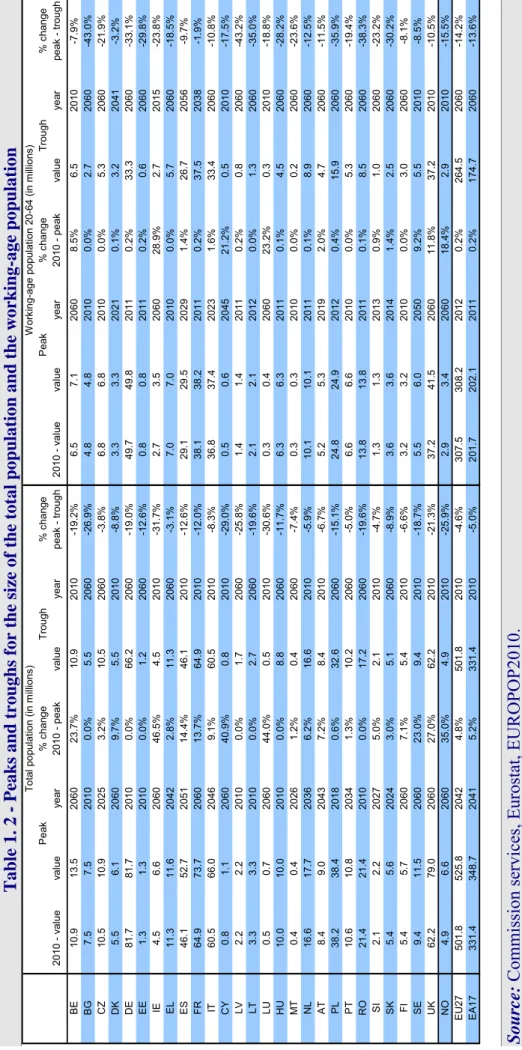
Due to the expected dynamics of fertility, life expectancy and migration rates, the age structure of the EU population is projected to dramatically change in coming decades. The overall size of the population is projected to be slightly larger in 50 years time, but much older than it is now. The EU population is projected to increase (from 502 million in 2010) up to 2040 by almost 5%, when it will peak (at 526 million). Thereafter, a steady decline occurs and the population shrinks by nearly 2% by 2060. Nonetheless, according to the projections, the population in 2060 will be slightly higher than in 2010, at 517 million.
While the EU population is projected to be larger in 2060 compared to 2010, there are wide differences in population trends until 2060 across Member States. Decreases of the total population are projected for about half of the EU Member States (BG, CZ, DE, EE, EL, LV, LT, HU, MT, PL, PT, RO and SK). For the other Member States (BE, DK, IE, ES, FR, IT, CY, LU, NL, AT, SI, FI, SE and UK) an increase is projected. The strongest population growth is projected in Ireland (+46%), Luxembourg (+45%), Cyprus (+41%), the United Kingdom (+27%), Belgium (+24%) and Sweden (+23%), and the sharpest decline in Bulgaria (-27%), Latvia (-26%), Lithuania (-20%), Romania and Germany (both -19%).
In 2010, the Member States with the largest population were: Germany (82 million), France (65 mn), the United Kingdom (62 mn), Italy (60 mn) and Spain (46 mn). In 2060, the United Kingdom would become the most populous EU country (79 mn), followed by France (74 mn), Germany (66 mn), Italy (65 mn) and Spain (52 mn).
…and undergo significant changes in its age structure
The age structure of the EU population is projected to change dramatically. The most numerous cohorts in 2010 are around 40 years old for men and women. Elderly people are projected to account for an increasing share of the population. At the same time, the middle of the age pyramid becomes smaller during the projection period due to below natural replacement fertility rates. As a consequence, the shape of the population pyramid gradually changes, increasingly resembling a pillar. A similar development is projected for the euro area.
The proportion of young people (aged 0-14) is projected to remain fairly constant by 2060 in the EU27 and the euro area (around 14%), while those aged 15-64 will become a substantially smaller share, declining from 67% to 56%. Those aged 65 and over will become a much larger share (rising from 17% to 30% of the population), and those aged 80 and over (rising from 5% to 12%) will almost become as numerous as the young population in 2060.
9 There is a lot of uncertainty as regards migration flows, making it difficult to project future developments. Migration flows are assumed to subside in the very long-term. The basic assumptions on migration is that immigration and emigration flows tend to converge towards a common level, which is different country by
27
The projections point to a significant reduction in the population aged 15-64 …
The population aged 15-64 is estimated to be declining as of 2010 in the EU and, over the whole projection period, it will drop by 14%. This means that there will be 45,600,000 persons less in this age group. This is however not a uniform phenomenon across the EU; it is projected to increase in 7 Member States (Belgium, Ireland, France, Cyprus, Luxembourg, Sweden and the United Kingdom).
… and an increase in persons aged 65 or more…
The population aged 65 and above will increase very markedly throughout the projection period. This group will almost double, rising from 87.5 million in 2010 to 152.6 million in 2060 in the EU. The number of older people (aged 80 years and above) is projected to increase by even more, almost tripling from 23.7 million in 2010 to 62.4 million in 2060.
… leading to a doubling of the old-age dependency ratio in the EU
As a result of these different trends among age-groups, the demographic old-age dependency ratio (people aged 65 or above relative to those aged 15-64) is projected to increase from 26% to 52.5% in the EU as a whole over the projection period. This entails that the EU would move from having four working-age people for every person aged over 65 years to two working-age persons. The increase in the total age-dependency ratio (people aged 14 and below and aged 65 and above over the population aged 15-64) is projected to be even larger, rising from 49.3% in 2010 to 77.9% in 2060. The difference is noticeable among individual EU Member States. A relatively small increase in the total age-dependency ratio (20 p.p. or less) is projected in Denmark, Ireland and the United Kingdom, while in Poland, Slovakia, Romania and Latvia an increase of 40 p.p. or more is projected by 2060.
Labour force projections
Overall participation rates are projected to increase …
Using recent trends in labour market behaviour, the total participation rate10 (for the age
group 20 to 64) in the EU27 is projected to increase by about 3 ¼ percentage points (from 75.6% in 2010 to 78.8% in 2060). For the euro area, a similar increase is projected (from 75.9% in 2010 to 79.4% in 2060). For the age group 15-64, the projected increases in participation rates are smaller, with 80% of the total improvement occurring in the period up to 2020.
In the EU27, the biggest increase in participation rates is projected for workers aged 55-64 (around 20 p.p. for women and 10 p.p. for men), positively influenced by structural reforms
10 The Cohort Simulation Method (CSM) is used to project participation rates (see Carone, 2005). The CSM makes the following four main assumptions: i) the starting year for the projections is 2010; ii) labour market participation rates are calculated by gender and single age, using average entry/exit rates in the labour market observed over the last ten years (2001-2010); iii) a correction mechanism is applied for young generations (15-24), in order to avoid that any increase in enrolment rates (and the corresponding decline in participation rates) feeds into future declines of participation rates for prime age workers; and iv) the impact of pension reforms is modelled through their estimated impact on the labour market exit rates of older workers (aged 50-74). Specifically, exit rates of older workers (50-74) are adjusted relatively to average historical values (2001-2010) in order to incorporate the expected future effects of legislated pension reforms.
in the field of pensions, leading to a substantial narrowing of the gender gap in terms of participation rates up to 2060.
… but labour supply will decline because of the projected population trends
Total labour supply in the EU27 is projected to increase by 1 ½ % from 2010 to 2020 (age group 20 to 64). In terms of persons, this represents an increase in labour force of roughly 3.7 million. In the euro area, the labour force is projected to increase by 2 ¼ % in the same period. The increase in labour supply over the period 2010 to 2020 is mainly due to the increase in women's labour supply, as men's labour force is projected to remain largely unchanged.
The positive trend in labour supply up to 2020 is expected to be reversed during the period 2020 to 2060 when the total labour force is projected to contract by 11 ¾ %, equivalent to 27.7 million people (24 million compared with the 2010 level). In the euro area, the projected fall in labour supply between 2020 and 2060 is 11 ½ %, which represents 17.8 million people (14.3 million compared with the 2010 level).
There is however a wide diversity across Member States, ranging from an increase in the labour force of 24.9% in Ireland to a decrease of 38.5% in Romania. The initially positive trend across most countries in the period 2010-2020 is projected to be reversed after 2020, when a large majority of countries is expected to record a decline (20 Member States in total).
Assumptions on unemployment
As a general rule, actual unemployment rates are assumed to converge to structural
unemployment rates. 11 In the EU27, the unemployment rate is assumed to decline by 3.2 p.p.
(from 9.7% in 2010 to 6.5% in 2060). In the euro area, the unemployment rate is expected to fall from 10.1% in 2010 to 6.7% in 2060.
The employment rate would increase…
As a result of the population projection, the labour force projection and the unemployment rate assumptions, the total employment rate (for individuals aged 20 to 64) in the EU27 is projected to increase from 68 ½ % in 2010 to 71 ½ % in 2020 and to 74% in 2060. In the euro area, a similar development is projected, with the employment rate attaining 74 ¼ % in 2060. Recent pension reforms that encourage longer working lives contribute to the projected increase in employment rates.
11 First convergence by 2015 corresponds to a general rule for closing the (generally negative) output gap by 2015. Second, the structural unemployment rates are assumed to gradually decline towards country-specific historical minima. However, for countries where the lowest historical rates are high, the structural unemployment rates are capped at 7.3%, which corresponds to the EU27 average structural unemployment (based on the spring 2011 DG ECFIN's Economic Forecasts). The assumed decline in effective unemployment rates due to the reduction of structural unemployment is about 2 p.p. between 2020 and 2060 in the EU and in the EA, i.e. larger than the reduction due to the closing of the output gap. For some Member States with high estimated structural unemployment rates currently, the assumed decline of the unemployment rate has a large
29
… but the number of workers would shrink.
In the EU27, the number of persons employed (using the LFS definition) is projected to record an annual growth rate of only ¼ % over the period 2010 to 2020 (compared to almost 1% over the period 2000-2009), which is expected to reverse to a negative annual growth rate of a similar magnitude over the period 2020 to 2060. The outcome of these opposite trends is that employment will peak at 217.6 million in 2022 and go down to 195.6 million in 2060. This implies a decline of about 15.7 million workers over the period 2010 to 2060. The negative prospects stemming from the rapid ageing of the population, will only be partly offset by the increase in (older workers) participation rates migration inflows and the assumed decline in structural unemployment, leading to a reduction in the number of people employed during the period 2022 to 2060 (22 million).
Graph 2 - Population and employment developments, EU
180 200 220 240 260 280 300 320 2007 2010 2013 2016 2019 2022 2025 2028 2031 2034 2037 2040 2043 2046 2049 2052 2055 2058 65 66 67 68 69 70 71 72 73 74 75
working-age population (20-64) total employment (20-64) employment rate (20-64)
until 2012: rising employ ment and slow grow th in w orking-age population 2013-2022: rising employment, declining w orking-age population
from 2023 onw ard:
both employment and w orking-age population decline
Source: Commission services, EPC.
Demographic developments have a major impact on labour market developments. Three distinct periods can be observed for the EU as a whole:
• 2007-2012 – demographic developments still supportive of growth: both the working-age population and the number of persons employed are projected to increase. However, the increase slows down as the effects of an ageing population take hold, even without incorporating the potential negative impact of the current financial and economic crisis.
• 2013-2021– rising employment rates offset the decline in the working-age population: the working-age population starts to decline as the baby-boom generation enters retirement. However, the assumed reduction in unemployment rates, the projected increase in the employment rates of women and older workers cushion the impact of demographic change, and the overall number of persons employed would continue to increase, albeit at a slower pace.
• From 2022 – the ageing effect dominates: the trend increase in female employment rates will broadly have worked itself through. In the absence of further reforms, the employment rate of older workers is also projected to reach a steady state. Consequently, there is no counter-balancing factor to ageing, and both the working-age population and the number of persons employed enter a downward trajectory.
Labour input (hours worked) is projected to decline
These employment trends and compositional effects, namely the rising share of part-time
work, will bring about a medium to long term decline in total hours worked.12 Nevertheless,
annual average growth in total hours worked is projected to be 0.3% in the period 2010 to 2020 in the EU27. However from 2020 onwards, the rising trend is projected to be reversed and annual average total hours worked are expected to fall by 0.1% between 2021 and 2040 and by 0.3% between 2040 and 2060. Over the entire projection period (i.e. 2010-2060), annual average growth in total hours worked is projected to be negative; down by 0.1% in the EU27 as well as in the euro area.
There are major differences across Member States, reflecting different demographic outlooks. In terms of annual average growth rate, a fall of 0.8% or more is projected for Romania, Latvia and Bulgaria. By contrast, an increase of 0.4% or more on average is expected in Ireland, Luxembourg and Cyprus.
The ratio of elderly non-workers to workers will rise steeply
The effective economic old-age dependency ratio is an important indicator to assess the impact of ageing on budgetary expenditure, particularly on its pension component. This indicator is calculated as the ratio between the inactive elderly (65+) and total employment (15-64). The effective economic old age dependency ratio is projected to rise significantly from around 39% in 2010 to 71% in 2060 in the EU27. In the euro area, a similar increase is projected from 42% in 2010 to 72% in 2060.
Across EU Member States, the effective economic old age dependency ratio is projected to range from less than 55% in Denmark, the United Kingdom, Norway and Ireland to more than 90% in Hungary, Slovakia, Poland and Romania in 2060.
31
Graph 3 - Effective economic old-age dependency ratio
0 20 40 60 80 100 120 DK UK NO IE SE NL CY FI AT FR BE LU EU 2 7 PT EA 1 7 EE CZ ES DE SI LT EL IT MT LV BG HU SK PL RO 2010 2010-2060 Source: Commission services, EPC.
Note: Inactive population aged 65 and above as a percentage of the employed population
aged 15 to 64.
Macroeconomic projections: labour productivity and potential growth rates
Total factor productivity growth is assumed to converge to 1%
Total factor productivity (TFP) drives labour productivity growth in the long-run. A prudent assumption was set: Member States' TFP growth rates are assumed to converge to a
long-term historical average in the EU13 of 1% (which represents a downward revision of 0.1 p.p.
relative to the assumption made in the previous round).14 As a result of this assumption, the
growth rate in labour productivity is projected to be 1.5% in the long-term, reflecting a contribution from capital deepening to output growth of 0.5%. The speed of convergence to this long-run TFP growth rate has been determined by the relative country-specific income position in the different Member States. Specifically, it is assumed that the lower the GDP per capita of a country compared to the EU average at present, the higher its catching up potential.
13 Annual average TFP growth in the EU, proxied by EU15, over 1971-2010.
14 For some Member States, a 1% TFP growth rate entails an acceleration in growth compared with recent trends, while for others it would imply a deceleration. It should be stressed that TFP growth in many countries, notably in the euro area, has been on a falling trend, with a declining TFP growth rate to around 0.6-0.7% already well before the financial crisis in 2008-09. The baseline therefore assumes an increase in TFP growth over the forecast horizon.
Taking account of the cyclical position of the economy in the long-term projections
Over a short-to-medium term horizon, there is a need to take account of the cyclical position of the economy, so as to bridge the current situation and the longer-term prospects. This is of particular importance at the current juncture, where nearly all Member States have large output gaps.
In order to produce actual, as opposed to potential, growth rate projections, the following operational rules are applied for closing the output gap. Firstly, the default rule is that the output gap is closed at the end of the medium term (i.e. 2015 based on the spring 2011 Commission forecast). Secondly, in circumstances where the output gap is small at the end of the short term forecasts, the gap could be closed by 0.5 p.p. a year until the gap is closed. Finally, when an output gap is particularly large (i.e. more than double the EU average), a longer period of closure would be allowed, up to a maximum of two additional years. Specifically, on the basis of the Commission's spring 2011 forecast, all Member States are assumed to close the output gap in 2015 except Greece, where it is assumed to be closed in 2017.
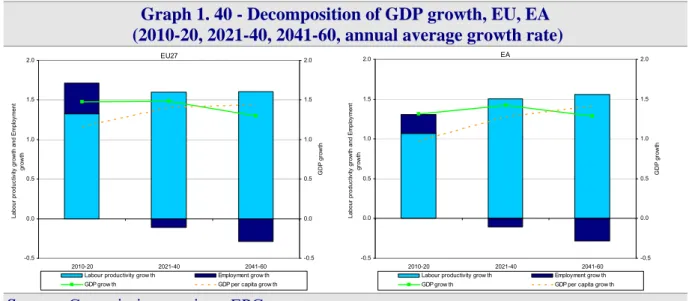
Low potential growth rates projected for the EU
In the EU as a whole, the annual average potential GDP growth rate is projected to remain quite stable over the long-term. After an average potential growth of 1.5% up to 2020, a slight rebound to 1.6% is projected in the period 2021-30, primarily on account of the assumption of the catching up potential in terms of labour productivity in those EU Member
States where it currently is relatively low15, while over the remainder of the projection period
(2031-2060) a slowdown to 1.3% emerges. Over the whole period 2010-2060, output growth rates in the euro area are very close to those in the EU27, as the former represents more than 2/3 of the EU27 total output. Notwithstanding this, the potential growth rate in the euro area is projected to be consistently slightly lower (by about 0.1 percentage point) than for the EU27 throughout the entire projection period.
Labour productivity will become the key driver of growth in the EU
For the EU and for the euro area, labour input acts as a drag on growth over the projection period (2010-2060), as the working-age population is projected to decline. As a result, labour input contributes negatively to annual output growth on average over the projection period (by about 0.1 p.p. both in the EU and in the euro area). Hence, labour productivity growth becomes the sole source for potential output growth in both the EU and the euro area starting from 2028.
The crisis weighs on potential growth in the EU
Following the largest economic crisis in many decades, potential GDP growth has been revised downwards in 2010 and the surrounding years, compared with the baseline projection
in the 2009 Ageing Report (see Graph 4). The current projections indicate that potential
growth in the EU as a whole should only very gradually approach the growth rates projected in the 2009 Ageing Report, just before the economic and financial crisis. As a consequence, the GDP level is lower throughout the projection period in the current projection.
Potential growth is projected to be 1.5 % on average up to 2020 in the EU as a whole, which is about ¾ p.p. lower than the 2009 Ageing Report projection. For the euro area, a slightly
33 lower average potential growth rate of 1 ¼ % is projected, (almost 1 p.p. lower compared with the 2009 Ageing Report). Over the period 2010-2060, annual average potential GDP growth in the EU27 is projected to be about 1 ½ %, which is slightly lower than in the 2009 projection. A similar picture emerges for the euro area. The lower average potential growth rate over the entire projection period in the EU can mainly be attributed to the new more prudent projection of convergence to a labour productivity growth rate of 1.5%, compared with 1.7% in the 2009 Ageing Report.
Graph 4 - Potential GDP growth, 2012 and 2009 reports compared
Potential GDP growth - EU27
% change 0.0 0.5 1.0 1.5 2.0 2.5 3.0 2004 2006 2008 2010 2012 2014 2016 2018 2020 2022 2024 2026 2028 2030 2032 2034 2036 2038 2040 2042 2044 2046 2048 2050 2052 2054 2056 2058 2060 2009 AR 2012 AR - Potential
Budgetary projections
The long-term public expenditure projections reveal a daunting challenge for policy makers in the EU…
The fiscal impact of ageing is projected to be substantial in almost all Member States, with effects becoming apparent already during the next decade. The current projection results indeed confirm, overall, that population ageing is posing a major challenge for public finance sustainability, as identified in previous projection exercises. They also show that age-related spending in 2010 was higher than projected in the 2009 Ageing Report, reflecting the crisis. If growth prospects in the medium-term should turn out to be different than projected, this would have a budgetary impact (positive or negative). However, there are noteworthy changes in the current projection. As regards pensions, reforms were implemented since the completion of the 2009 Ageing Report in some Member States (in FR, EL, IT, CZ, ES). They are having visible positive impacts, being very large in Greece, Italy, the Czech Republic and Spain. They have sharply reduced the projected increase in public pension expenditure, diminishing the budgetary impact of ageing. Nonetheless, in some countries, the scale of reforms has been insufficient to stabilise public finance trends and they need to be pursued further to cope with the inexorable increasing share of older persons in Europe. A key policy response, already implemented in some Member States, is to increase the retirement age and link it with changes in life expectancy (as in e.g. CZ, EL, ES and IT). At the same time, there may be a need to implement other, additional measures that enable higher employment rates of older workers as well as putting in place policies that support higher labour productivity, thus contributing further to fiscal sustainability as well as to more adequate retirement incomes in the future. In some Member States, new pension reforms have been legislated after the finalisation of the 2012 projections, thus too late to be incorporated in the
projections.16
As in previous long-term projection exercise, the AWG reference scenario focuses on the budgetary impact mostly due to demographic developments.
As noted above, there is considerable uncertainty as to future developments of age-related public expenditure, in particular related to the challenge to cope with trend increases in public spending and in particular on health care and long-term care. For this reason and in order to contribute to the wider policy debate on fiscal challenges the EU will be facing in the future, an AWG risk scenario was prepared for this exercise. The AWG risk scenario, in addition to the impact of demographic changes, reflects the impact of additional non-demographic
drivers of costs for health care and long-term care expenditure.17
Strictly-age-related public expenditure is projected to increase on average by 4.1 percentage
points of GDP by 2060 in the EU - and by 4.5 percentage points in the euro area (see Table 1)
in the AWG reference scenario. Most of the projected increase in public spending over the period 2010-2060 will be on pensions (+1.5 p.p. of GDP), long-term care (+1.5 p.p. of GDP) and health care (+1.1 p.p. of GDP) in the EU. In the euro area, spending on pensions and
35 In the AWG risk scenario, the overall increase in strictly-age-related expenditure by 2060 would be about 5 percentage points of GDP in the EU - and 5 ½ percentage points in the euro
area (see Table 1 and Graph 5). This higher projected increase is mainly due to public
expenditure on health care and long-term care rising, in each case, by 1.7 p.p. of GDP by 2060 in the EU (and respectively by 1.7 p.p. and 1.9 p.p. of GDP in the euro area).
Graph 5 - Projected change in strictly-age-related expenditure AWG reference and risk scenarios, 2010-60
-4.0 -2.0 0.0 2.0 4.0 6.0 8.0 10.0 12.0 14.0 LV EE IT PL PT BG EL UK FR DK SE EU2 7 HU AT EA LT ES CZ DE RO IE FI SK MT CY NL BE NO SI LU
AWG reference scenario AWG risk scenario
Overall change in age-related expenditure (p.p. of GDP), 2010-2060
Source: Commission services, EPC.
In terms of the different Member States situation, the following points can be made:
The strictly-age-related increase in public spending in the AWG reference scenario will be very significant in seven Member States (Belgium, Cyprus, Luxembourg, Malta, the Netherlands, Slovenia and Slovakia) with a projected increase of 7 p.p. of GDP or more. In terms of the AWG risk scenario, coping with the future prospects is deemed to be even more challenging for these countries.
For a second group of countries – the Czech Republic, Germany, Ireland, Spain, Lithuania, Hungary, Austria, Romania and Finland - the strictly-age-related increase in public spending is more limited, ranging from 4 p.p. to 7 p.p. of GDP. In terms of the AWG risk scenario, coping with the future prospects is deemed to be more challenging, and especially so in Ireland, Lithuania and Finland where the increase would be in excess of 7 p.p. of GDP.
Finally, the increase will be more moderate, 4 p.p. of GDP or less, in Bulgaria, Denmark,
Estonia, Greece, France, Italy, Latvia18, Poland, Portugal, Sweden and the United
Kingdom. However, in terms of the AWG risk scenario, coping with the future prospects is deemed to be more demanding, especially in Denmark, Greece, France, Sweden and
18 Age-related spending is projected to fall in Latvia, reflecting inter alia recent measures taken by the Latvian authorities to ensure sustainability of the pension system.
the United Kingdom where the increase would be 4 p.p. of GDP or more, but the overall change in strictly-age-related expenditures remains below the EU average.
Table 1 – Age-related spending, p.p. of GDP, 2010-2060
Level Level 2010 2010-2020 2010-2060 2010-2020 2010-2060 2010 2010-2020 2010-2060 2010-2020 2010-2060 BE 25.4 2.6 9.2 2.8 10.4 27.5 2.5 9.1 2.7 10.3 BE BG 18.2 -0.5 2.2 -0.2 2.8 18.7 -0.6 2.0 -0.4 2.6 BG CZ 20.2 0.1 5.3 0.3 6.4 20.6 0.0 5.2 0.2 6.3 CZ DK 29.6 1.4 3.7 1.6 4.2 30.3 1.4 3.6 1.6 4.2 DK DE 24.2 0.5 5.5 0.7 6.2 25.2 0.2 5.2 0.5 6.0 DE EE 19.7 -0.9 0.2 -0.7 1.1 20.3 -1.0 0.0 -0.7 0.9 EE IE 22.2 2.3 6.8 2.6 8.0 24.9 2.9 5.4 3.1 6.7 IE EL 25.3 0.0 3.2 0.1 4.0 25.9 0.0 2.9 0.2 3.8 EL ES 21.6 0.3 5.0 0.5 5.8 23.6 0.8 3.9 1.0 4.7 ES FR 29.7 0.4 3.7 0.7 4.5 31.4 0.1 3.1 0.3 3.9 FR IT 27.9 -1.1 0.2 -0.9 0.6 28.6 -1.3 -0.1 -1.2 0.4 IT CY 17.1 1.1 8.5 1.1 8.7 17.5 1.1 8.4 1.2 8.5 CY LV 18.5 -2.6 -3.5 -2.5 -3.0 19.2 -2.6 -3.8 -2.4 -3.3 LV LT 19.2 -1.3 4.7 -0.9 7.4 19.6 -1.2 4.5 -0.9 7.2 LT LU 17.1 1.5 12.1 1.6 12.4 17.7 1.4 12.0 1.5 12.3 LU HU 22.0 -0.5 4.1 -0.3 5.0 22.4 -0.5 4.0 -0.3 4.8 HU MT 21.5 0.2 8.2 0.6 11.3 21.9 0.2 8.2 0.6 11.3 MT NL 23.0 1.4 8.6 1.5 9.1 24.6 1.2 8.2 1.4 8.8 NL AT 28.0 1.2 4.5 1.5 6.1 28.8 1.1 4.4 1.4 6.0 AT PL 21.4 -0.9 0.2 -0.5 1.9 21.6 -1.0 0.1 -0.6 1.8 PL PT 24.7 -0.2 0.5 -0.1 1.7 26.0 -0.1 0.1 0.0 1.3 PT RO 17.6 -0.8 5.6 -0.6 6.5 18.1 -1.0 5.4 -0.9 6.3 RO SI 23.5 1.7 10.3 1.9 10.8 23.8 1.8 10.3 2.0 10.8 SI SK 17.6 1.0 7.6 1.4 9.9 17.8 0.9 7.5 1.3 9.8 SK FI 26.5 2.8 6.9 3.1 7.8 28.1 2.6 6.7 2.8 7.5 FI SE 27.3 0.1 3.8 0.3 4.4 27.9 0.1 3.8 0.3 4.3 SE UK 21.9 -0.3 3.4 0.0 4.0 22.1 -0.2 3.3 0.0 4.0 UK NO 27.4 2.4 10.1 2.6 10.6 27.9 2.2 9.9 2.4 10.4 NO EU27 25.0 0.2 4.1 0.4 4.8 26.0 0.1 3.7 0.3 4.5 EU27 EA 25.7 0.4 4.5 0.7 5.3 27.0 0.3 4.1 0.5 4.9 EA
Strictly age-related items, 2010-2060, percentage points of GDP
Total age-related items, 2010-2060, percentage points of GDP
Change Change
AWG reference scenario AWG risk scenario AWG reference scenario AWG risk scenario
Change Change
Source: Commission services, EPC.
Note: In the 2009 Ageing Report, age-related spending included unemployment benefits in
addition to pensions, health care, long-term care and education. Since unemployment benefits are more affected by cyclical fluctuations, the results for the AWG reference and risk scenarios are presented both with and without unemployment benefits.19
Reforms legislated after December 2011 have not been taken into account in the projections (see Box 2 on page 97).
These results reveal that in some countries, there is a need to take due account of future increases in government expenditure, including through modernisation of social expenditure systems. In others, policy action has already been taken, significantly limiting the future increase in government expenditure. A comprehensive assessment of risks to the sustainability of public finances, including the identification of relevant policy responses, will be made in the 2012 update of the Commission's Sustainability Report.
37
…influenced by the future prospects for public spending on pensions…
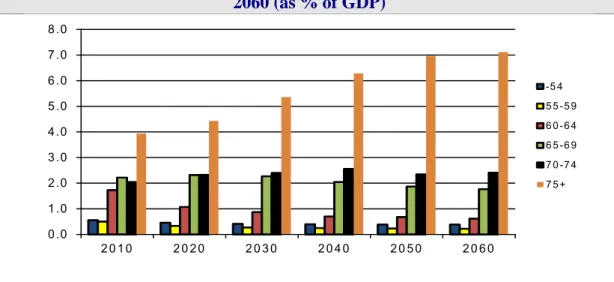
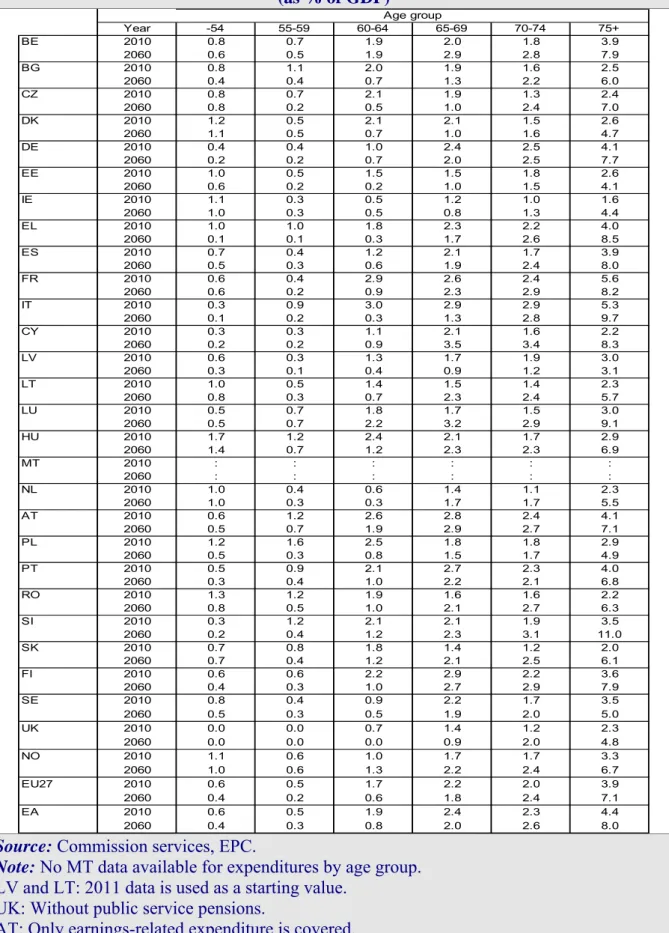
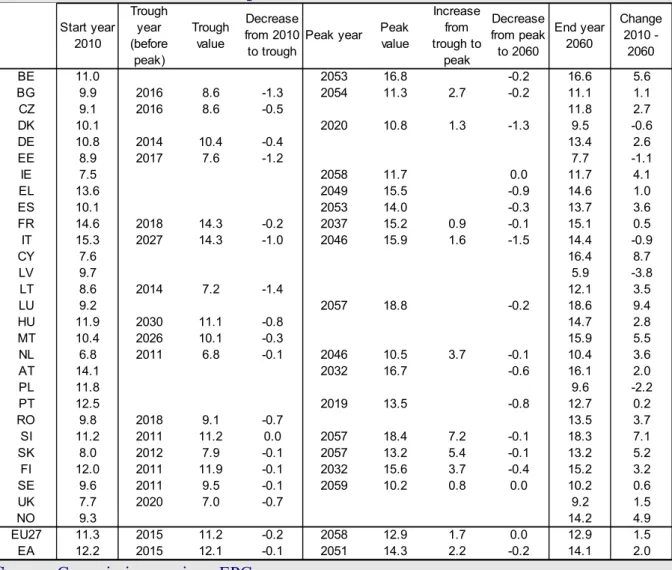
Public pension expenditure in the EU27 is projected to increase by 1.5 p.p. of GDP over the period 2010-2060 to a level of 12.9% of GDP. In the euro area, an increase by 2.0 p.p. of GDP is projected. Yet, the range of projected changes in public pension expenditure is very large across Member States. On the one hand, an increase of 9.4 p.p. of GDP is projected for Luxembourg, while Slovenia and Cyprus project a public pension expenditure increase by more than 7 p.p. of GDP. In another three Member States (Slovakia, Belgium and Malta) spending to GDP is projected to grow between 5 to 7 p.p. of GDP. On the contrary, the ratio decreases over the projection horizon in Latvia, with a projected decline of -3.8 p.p. of GDP; it also decreases in Denmark, Italy, Estonia and Poland. For the remaining Member States, an increase of less than 5 p.p. of GDP is expected.
The timing of the fiscal challenge to pension systems also differs markedly across the Member States. Public pension spending is estimated to rise by more than 1 ½ p.p. of GDP already by 2020 in Belgium, Cyprus, Luxembourg and Finland - alternatively put, an increase of between 15 and 25% of public pension spending over this period. By contrast, in about a third of the Member States (Bulgaria, the Czech Republic, Estonia, France, Italy, Latvia, Lithuania, Hungary, Poland, Romania, Sweden, and the United Kingdom) pension spending as a share of GDP is either stable or falling over the medium-term (to 2020).
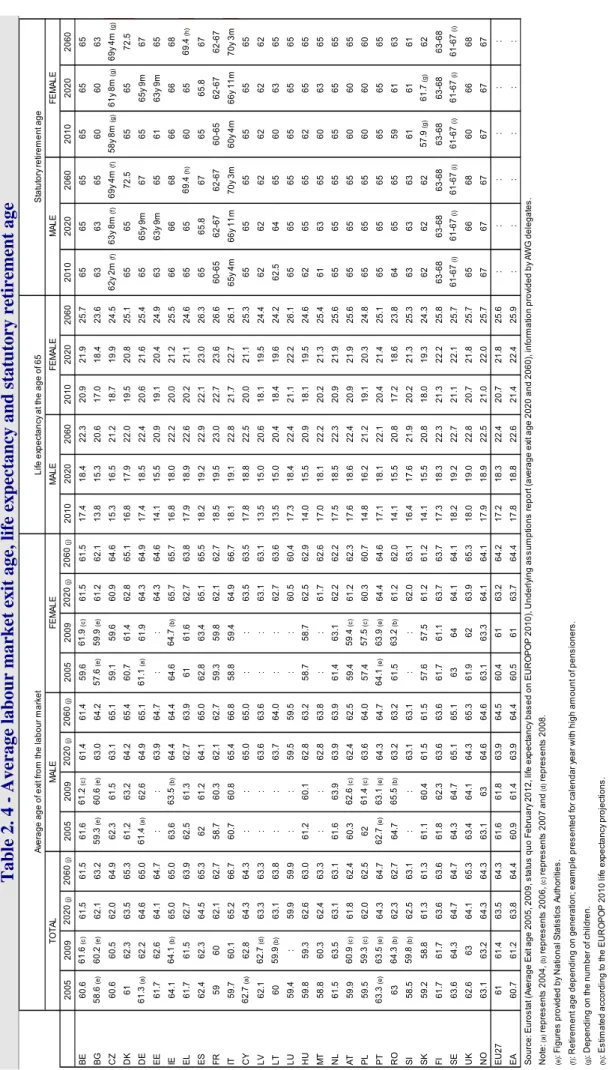
Many countries have introduced pension reforms that will increase the retirement age. In all Member States, the share of public pensioners in the age group below 65 is constantly decreasing over the whole projection horizon. For the EU27, the share of pensioners younger than 55 of age drops by 3.3 p.p. over time. As of 2050 it becomes stable, reflecting that the share of younger people receiving disability and other pensions is assumed to be constant over the projection horizon. The shares for age groups 55-59 and 60-64 are also projected to decrease by 3.2 p.p. and 9.9 p.p., respectively. This mostly reflects increasing retirement ages over time and the evolution of the demographic structure. Over the entire projection horizon, the share of pensioners in age group 65-69 is decreasing as well (-5.8 p.p. on the EU27 level), reflecting a rising number of persons in this age group already during this decade onwards, but the increase in statutory retirement ages in many Member States takes effect only gradually.
38
Table 2 – Projected age-related expendi
ture, 2010-2060, percentage points of GDP
Le vel Le vel Le vel Le ve l 20 12 A R * 20 09 A R * 20 10-20 20 20 10 -2 060 20 10 20 10-20 20 20 10-2060 2010 -2 02 0 201 0-206 0 201 0 2010 -2 020 201 0-206 0 20 10-20 20 20 10 -2 060 20 10 20 10-20 20 20 10 -2 060 20 10 20 10-20 20 20 10 -2 060 2. 1 5. 6 6. 3 0. 1 0. 4 0. 2 0. 8 2. 3 0. 4 2. 7 0. 5 3. 5 5. 7 0. 0 0. 5 2. 1 -0 .1 -0 .1 9. 1 6. 6 B E -0. 7 1. 1 4. 3 0. 2 0. 5 0. 5 1. 1 0. 5 0. 0 0. 3 0. 0 0. 4 3. 5 -0. 1 0. 2 0. 4 -0. 1 -0. 2 2. 0 3. 2 B G -0 .4 2.7 6. 9 0.4 1. 7 0. 7 2. 4 0.8 0. 1 0. 7 0. 1 1.0 3. 4 0.0 0. 2 0. 4 -0 .1 -0 .1 5. 2 6. 3 C Z 0. 7 -0. 6 7. 4 0. 4 0. 9 0. 5 1. 5 4. 5 0. 3 3. 5 0. 3 3. 5 7. 6 0. 0 -0. 2 0. 7 0. 0 0. 0 3. 6 2. 2 DK 0. 1 2. 6 8. 0 0. 6 1. 4 0. 9 2. 0 1. 4 0. 3 1. 7 0. 3 1. 8 3. 9 -0. 5 -0. 2 1. 0 -0 .3 -0 .3 5. 2 5. 1 DE -1. 2 -1. 1 5. 2 0. 2 1. 1 0. 5 1. 8 0. 5 0. 0 0. 3 0. 1 0. 5 5. 2 0. 0 0. 0 0. 6 -0. 1 -0. 2 0. 0 -0 .1 E E 1. 4 4. 1 7.3 0. 0 1. 1 0.1 1.7 1. 1 0.2 1. 5 0. 2 2. 1 6.3 0. 8 0. 0 2.6 0. 5 -1 .3 5.4 8.7 IE 0. 2 1.0 6. 5 -0 .1 0.9 -0 .1 1. 2 1.4 0. 2 1. 2 0. 2 1.8 3. 9 -0 .2 0.1 0. 6 0.0 -0 .2 2. 9 16 .0 E L 0. 5 3. 6 6. 5 0. 0 1. 3 0. 2 1. 9 0. 8 0. 0 0. 7 0. 1 0. 8 4. 2 -0. 1 -0. 5 2. 0 0. 5 -1. 1 3. 9 8. 3 E S -0 .2 0. 5 8. 0 0. 4 1. 4 0. 7 2. 1 2. 2 0. 4 2. 1 0. 4 2. 2 5. 0 -0 .2 -0 .4 1. 7 -0. 3 -0. 6 3. 1 2. 2 F R -0 .8 -0 .9 6.6 0. 0 0. 6 0.1 1. 0 1. 9 0.1 0.9 0. 1 0. 9 4.1 -0 .4 -0 .5 0.7 -0 .3 -0 .3 -0 .1 1. 6 IT 1. 9 8. 7 2. 6 0. 1 0. 4 0. 1 0. 5 0. 2 0. 0 0. 1 0. 0 0. 1 6. 7 -0 .9 -0 .7 0. 5 0. 0 -0 .1 8. 4 10. 7 C Y -2. 5 -3. 8 3. 7 0. 1 0. 5 0. 3 1. 1 0. 7 0. 1 0. 4 0. 1 0. 4 4. 4 -0 .3 -0 .6 0. 7 0. 1 -0 .3 -3 .8 1. 3 LV -1. 1 3. 5 4. 9 0. 3 0. 7 0. 5 1. 3 1. 2 0. 1 1. 1 0. 3 3. 2 4. 4 -0. 6 -0. 5 0. 4 0. 0 -0. 2 4. 5 6. 0 LT 1. 6 9. 4 3. 8 -0 .1 0. 7 0. 1 1. 0 1. 0 0. 3 2. 1 0. 3 2. 1 3. 2 -0. 3 -0. 1 0. 6 -0 .1 -0 .1 12. 0 18. 2 LU -0 .4 2. 8 4.9 0. 2 1. 1 0.3 1.6 0. 8 0.1 0. 6 0. 1 1. 0 4.3 -0 .3 -0 .4 0.4 0. 0 -0 .1 4.0 4.0 H U 0. 2 5. 5 5. 4 0. 8 2. 9 1. 0 3. 6 0. 7 0. 1 0. 9 0. 3 3. 2 5. 1 -0. 9 -1. 1 0. 4 0. 0 0. 0 8. 2 9. 2 M T 0. 6 3. 6 7. 0 0. 5 1. 0 0. 7 1. 5 3. 8 0. 6 4. 1 0. 6 4. 1 5. 3 -0 .3 -0 .1 1. 6 -0. 2 -0. 3 8. 2 9. 4 N L 1. 0 2. 0 7. 4 0. 5 1. 6 0. 8 2. 2 1. 6 0. 2 1. 2 0. 3 2. 3 4. 9 -0. 6 -0. 4 0. 8 -0 .1 -0 .1 4. 4 3. 3 A T -0 .9 -2 .2 4. 9 0. 4 1. 9 0. 7 2. 6 0. 7 0. 1 1. 0 0. 2 1. 9 3. 9 -0. 6 -0. 5 0. 2 -0 .1 -0 .1 0. 1 -1 .1 P L 1. 0 0. 2 7. 2 -0. 4 1. 1 -0 .4 1. 6 0. 3 0. 0 0. 3 0. 1 1. 0 4. 7 -0. 8 -1. 1 1. 2 0. 1 -0. 4 0. 1 2. 9 P T -0. 6 3. 7 3. 7 0. 0 1. 0 0. 2 1. 4 0. 6 0. 1 1. 1 0. 1 1. 5 3. 5 -0. 3 -0. 1 0. 5 -0 .2 -0 .3 5. 4 8. 5 RO 1. 0 7. 1 6. 1 0. 3 1. 1 0. 5 1. 7 1. 4 0. 3 1. 6 0. 3 1. 6 4. 7 0. 1 0. 5 0. 3 0. 1 0. 0 10. 3 12. 7 S I 0. 6 5. 2 6. 2 0. 6 2. 1 0. 9 3. 0 0. 3 0. 0 0. 4 0. 1 1. 9 3. 1 -0 .3 -0 .1 0. 2 -0. 1 -0. 1 7. 5 5. 5 S K 1. 9 3. 2 6. 0 0. 4 1. 0 0. 6 1. 5 2. 5 0. 6 2. 6 0. 6 2. 9 5. 9 0. 0 0. 2 1. 6 -0 .3 -0 .3 6. 7 5. 9 F I 0. 0 0. 6 7. 5 0. 2 0. 7 0. 4 1. 2 3. 9 0. 2 2. 5 0. 2 2. 5 6. 3 -0 .2 0. 0 0. 6 0. 0 0. 0 3. 8 2. 7 S E -0. 7 1. 5 7. 2 0. 3 1. 1 0. 5 1. 8 2. 0 0. 2 0. 7 0. 2 0. 7 5. 0 -0. 1 0. 0 0. 3 0. 0 0. 0 3. 3 4. 8 U K 2. 3 4. 9 5.8 0. 3 1. 2 0.5 1.7 3. 8 0.1 3. 9 0. 2 4. 0 8.5 -0 .3 0. 0 0.5 -0 .2 -0 .2 9.9 8.3 N O -0 .1 1. 5 7. 1 0. 3 1. 1 0. 5 1. 7 1. 8 0. 2 1. 5 0. 3 1. 7 4. 6 -0 .3 -0 .1 1. 1 -0. 1 -0. 3 3. 7 4. 6 E U2 7 0. 2 2. 0 7. 3 0. 3 1. 1 0. 5 1. 7 1. 8 0. 3 1. 7 0. 3 1. 9 4. 5 -0. 3 -0. 2 1. 3 -0 .1 -0 .4 4. 1 5. 1 E A C han ge 201 0-20 60 T o ta l a g e -r e la te d ite m s Cha nge Unem pl oy m ent be nef its R ef ere nc e sc ena rio R is k s ce na rio R ef er en ce s ce nar io Ri sk s cena rio Cha nge Ch ang e C han ge Cha nge P roj ec te d publi c spe ndi ng, 2 0 1 0 -2 0 6 0 , per c ent a ge points of GD P S tr ict ly -a g e -r el at ed i tem s P en sio ns Hea lth c are Lon g-te rm c ar e E du cat ion
Commission services, EPC.
s legislated after December 2011 have not been take
n into account in the projec
The demographic transition to an older population is the main driver behind the projected increase in public pension expenditure. This effect alone pushes up expenditures significantly in all Member States (ranging from +3.1 p.p. in the United Kingdom to as much as +14.0 p.p. in Poland (EU27: +8.5 p.p. of GDP). However, some factors, also related to past reforms of pension systems, are expected to mitigate the increase:
A tightening of the eligibility for a public pension (through higher retirement age and/or reduced access to early retirement and better control of alternatives to early retirement like disability pensions) would constrain public pension expenditure in nearly every Member State. A strong downward effect of lower coverage ratios (i.e. fewer pensioners in relation to the population aged 65 and over) on public pension expenditure of at least 3 p.p. of GDP is projected in 12 Member States (Slovenia, Finland, Greece, France, Slovakia, Bulgaria, Denmark, Hungary, the Czech Republic, Romania, Poland and Italy). In the remaining Member States the declining coverage rate will also contribute to limit the impact of demographic factors on pension spending, although to a less pronounced extent. The overall EU27 contribution is -2.9 p.p. over the period 2010 to 2060.
On average for the EU27, increasing employment leads to a reduction in the public pension expenditure over GDP ratio (-0.9 p.p. over the projection period).
Reduced pensions relative to wages over time. The pension benefit ratio – i.e. the average pension as a share of the average wage – is projected to decrease, partly on account of pension reforms. In the EU27, the benefit ratio effect will contribute to push down the increasing impact of the demographic effect on the pension expenditure/GDP ratio over the projection horizon by 2.8 p.p. of GDP. In the majority of Member States, a reduction in the relative value of public pension benefits (compared to the gross average wage) is projected. In 9 Member States (France, Estonia, Cyprus, Greece, Romania, Austria, Portugal, Latvia and Poland) the contribution of a decreasing benefit ratio is in absolute terms significant (i.e. above 3 p.p.). Only in 2 Member States (the United Kingdom and Ireland), the contribution of the change in the benefit ratio is supposed to push the expenditure level further upwards.
In sum, the projections reveal that pension policies in a majority of EU Member States will lead to a containment of the increase in old-age and early pensions spending through: (i) reducing the generosity of public pension schemes to make these programmes financially more sustainable in view of the demographic trends; (ii) pushing up the retirement ages, including the statutory retirement age, in a gradually phased way for old-age pensions; (iii) restricting access to early retirement schemes.
…and substantive pressures on health care spending …
Projecting public spending on health care over the long-run for EU Member States (and Norway) is a highly complex exercise, given the uncertainties regarding future trends in the drivers of spending and the complex institutional settings of national health care systems. The simulation model used in the exercise attempts to quantify in a comparable way the impact of demographic changes and, in addition, the possible evolution of non-demographic drivers on public health care expenditure.
According to the "AWG reference scenario", health care expenditures are driven by a combination of changes in the population structure, an assumption that half of the future gains
in life expectancy are spent in good health and a moderate impact of income.20 The joint
impact of those factors is a projected increase in spending from 7.1% of GDP in 2010 to 8.3% of GDP in 2060 for the EU27 (from 7.3% to 8.4% of GDP for the EA). Individual countries’ increases range between 0.4 p.p. (Belgium and Cyprus) and 2.9 p.p. of GDP (Malta).
The "AWG risk scenario"21 keeps the assumption that half of the future gains in life
expectancy are spent in good health, as in the "AWG reference scenario". However, it departs from it by assuming more dynamic spending growth in the beginning of the projection period
in line with past trends for the EU as a whole.22 In comparison to the AWG reference
scenario, this scenario captures the impact of additional non-demographic cost drivers, i.e. technological changes (e.g. development of new treatments and new diagnostic equipment) and institutional mechanisms (e.g. universalization of coverage or devolution to regions) which may stimulate expenditure growth in excess of what can be expected due to purely demographic factors. According to this AWG risk scenario, public spending is projected in the EU27 to be 8.9% of GDP by 2060, i.e. an increase of 1.7 p.p. of GDP relative to 2010. The projected excess cost growth therefore adds around 0.6 p.p. of GDP to the AWG reference scenario for the EU27.
…and on public spending on long-term care
An ageing population will have a strong upward impact on public spending for long-term care. This is because frailty and disability rise sharply at older ages, especially amongst the very old (aged 80+) which will be the fastest growing segment of the population in the decades to come.
According to the "AWG reference scenario"23 based on current policy settings, public
spending on long-term care is projected to double, increasing from 1.8% of GDP in 2010 to 3.4% of GDP in 2060 in the EU as a whole (to 3.4% of GDP in the EA). The projected absolute changes range from less than ½ % of GDP in Bulgaria, Estonia, Cyprus, Latvia, Portugal and Slovakia to more than 2 ½ % of GDP in Belgium, Denmark, the Netherlands, Finland and Sweden, reflecting very different approaches to the provision/financing of formal care.
20 The AWG reference scenario assumes that: (i) half of the increase in life expectancy is spent in good health; and (ii) the elasticity of health care spending with respect to income converges from 1.1 in 2010 to unity in 2060. 21 Specifically, the AWG risk scenario assumes that: (i) half of the increase in life expectancy is spent in good health; and (ii) the impact of non-demographic drivers on future trends is captured by using an elasticity of
41 The "AWG risk scenario" is a new scenario that combines the assumption that half of the future gains in life expectancy are spent in good health (as for health care) with the cost convergence scenario, aimed at capturing the possible effect of a convergence in real living
standards on LTC spending.24 This scenario puts more pressure on public budgets, and costs
are projected to increase by 1.7 p.p. of GDP over 2010-60 in the EU as a whole, and by 1.9 p.p. of GDP in the EA. The projected increase in terms of p.p. of GDP over 2010-60 is less than 1 p.p. of GDP in Bulgaria, Estonia, Spain, Italy, Cyprus, Latvia and the United Kingdom. By contrast, an increase of 3 p.p. of GDP or more is projected for Belgium, Denmark, Lithuania, Malta and the Netherlands.
The projection results for public spending on education
The ratio of children and young people to the working-age population is expected to shrink over the coming decades, pointing to fewer students relative to the working population. The baseline scenario estimating the pure consequences of expected demographic changes indicates a potential for a small decline in public expenditure on education in the EU as a whole (from 4.6% of GDP in 2010 to 4.5% of GDP in 2060).
However, the baseline projection does not take into account that public expenditure on education as a share of GDP could instead increase, when incorporating changes in education policy aiming at the necessary improvement in education. Specifically, a "EU2020 scenario" was carried out, defined in terms of its two education-related objectives to be achieved by
2020, namely:25 (i) the share of early leavers from education and training should be less than
10%; (ii) the share of 30 to 34-year-olds with tertiary or equivalent educational attainment should be at least 40%. In this scenario where attainment of the EU2020 education targets is assumed to be met, the increase in costs is projected to be 0.2 p.p. of GDP for the EU over 2010-60.
The projection results for public spending on unemployment transfers
The number of unemployed persons in relation to the number of people who are working is expected to shrink over the projection period. On this basis, unemployment benefit spending in the EU is projected to be slightly lower over the long run (moving from 1.1% of GDP in 2010 to 0.7% in 2060 in the EU and from 1.3% of GDP in 2010 to 0.9 % in the EA).
24 The AWG risk scenario assumes that: (i) half of the increase in life expectancy is spent in good health; and (ii) there is an upward convergence of the relative age-gender specific expenditure profiles per beneficiary (as percentage of GDP per capita) of all countries below the corresponding EU27 average to the EU27 average. 25 See http://ec.europa.eu/education/lifelong-learning-policy/doc34_en.htm.
The 2012 projections indicate a lower increase in strictly-age-related public spending in the AWG reference scenario than in the 2009 round…
The increase in the strictly-age-related public expenditure/GDP ratio for the EU27 and the EA is slightly lower compared with the previous projections in the 2009 Ageing Report. Over the period 2010-2060, the increase in the EU is 4.1 p.p. of GDP and in the EA 4.5 p.p., compared with an estimated increase of 4.8 and 5.3 p.p. of GDP, respectively, in the previous 2009
Ageing Report (see Graph 6 and Graph 7).
Graph 6 – Projected change in strictly-age-related expenditure (AWG reference scenario) in ’12 and ’09 compared, p.p. of GDP, 2010-60
FI SK SI RO PT PL AT NL MT HU LU LT LV CY IT FR ES EL IE EE DE DK CZ BG BE SE UK NO EU27EA -6.0 -1.0 4.0 9.0 14.0 19.0 -6.0 -1.0 4.0 9.0 14.0 19.0 2009 AR 2012 A R Higher increase Lower increase
Source: Commission services, EPC.
Compared with the projections in the 2009 Ageing Report, strictly-age-related public expenditure according to the AWG reference scenario is now projected to increase more over the period 2010-2060 in 11 Member States (Belgium, Denmark, Germany, Estonia, France, Hungary, Austria, Poland, Slovakia, Finland and Sweden). By contrast, it is now projected to increase less in 16 Member States (Bulgaria, the Czech Republic, Ireland, Greece, Spain, Italy, Cyprus, Latvia, Lithuania, Luxembourg, Malta, the Netherlands, Portugal, Romania, Slovenia, and the United Kingdom). In some cases, the results are almost identical and the - positive or negative difference - is rather small. This is the case for all those countries where
the observed rates are depicted on the line shown in the graph or very close to it (Graph 6).
The largest downward revisions have occurred in Greece, Luxembourg, Latvia and Spain, reflecting large expenditure-reducing pension reforms in Greece and Spain. Large upward