THESIS PRESENTED TO
ÉCOLE DE TECHNOLOGIE SUPÉRIEURE
IN PARTIAL FULFILLMENT OF THE REQUIREMENTS FOR A MASTER’S DEGREE IN MECHANICAL ENGINEERING
M.Ing
BY
Romain DUMOULIN
ON THE USE OF MOBILE PHONES AND WEARABLE MICROPHONES FOR NOISE EXPOSURE MEASUREMENTS: CALIBRATION AND MEASUREMENT ACCURACY
MONTREAL, MAY1ST2014
BY THE FOLLOWING BOARD OF EXAMINERS:
Dr. Jérémie Voix, Memorandum Director
Mechanical Engineering Department, École de technologie supérieure
Dr. Frédéric Laville, Committee President
Mechanical Engineering Department, École de technologie supérieure
Dr. Annelies Bockstael, External Examiner
Department of Information technology, Ghent University
Dr. Tony Leroux, External Examiner
École d’orthophonie et d’audiologie, Université de Montréal
THIS THESIS WAS PRESENTED AND DEFENDED
IN THE PRESENCE OF A BOARD OF EXAMINERS AND PUBLIC ON APRIL 2ND 2014
visor. I could always count on his support and, his dedication greatly inspired me. Hopefully we’ll cross paths again!
I would like to acknowledge The Research Team in Work Safety and Industrial Analysis for its financial support through an ÉREST-RRSSTQ scholarship.
I would like to thank Eliott Mahou and Rodrigue Sandrin for their help developing the phone application and the measurement acquisition methods, respectively.
I would like to thank Professor Ramakrishnan for his guidance in helping to launch my profes-sional career.
Thanks to my lab-mates at CRITIAS for their help and their friendship. Special thanks to my parents for all of their unconditional love and support.
Finally, and most importantly, I would like to thank my soon-to-be wife Natalie for her love, patience and understanding.
Romain DUMOULIN ABSTRACT
Despite the fact that noise-induced hearing loss remains the number one occupational disease in developed countries, individual noise exposure levels are still rarely known and infrequently tracked. Indeed, efforts to standardize noise exposure levels present disadvantages such as costly instrumentation and difficulties associated with on site implementation. Given their advanced technical capabilities and widespread daily usage, mobile phones could be used to measure noise levels and make noise monitoring more accessible. However, the use of mobile phones for measuring noise exposure is currently limited due to the lack of formal procedures for their calibration and challenges regarding the measurement procedure.
Our research investigated the calibration of mobile phone-based solutions for measuring noise exposure using a mobile phone’s built-in microphones and wearable external microphones. The proposed calibration approach integrated corrections that took into account microphone placement error. The corrections were of two types: frequency-dependent, using a digital filter and noise level-dependent, based on the difference between the C-weighted noise level minus A-weighted noise level of the noise measured by the phone. The electro-acoustical limitations and measurement calibration procedure of the mobile phone were investigated. The study also sought to quantify the effect of noise exposure characteristics on the accuracy of calibrated mobile phone measurements. Measurements were carried out in reverberant and semi-anechoic chambers with several mobiles phone units of the same model, two types of external devices (an earpiece and a headset with an in-line microphone) and an acoustical test fixture (ATF). The proposed calibration approach significantly improved the accuracy of the noise level mea-surements in diffuse and free fields, with better results in the diffuse field and with ATF posi-tions causing little or no acoustic shadowing. Several sources of errors and uncertainties were identified including the errors associated with the inter-unit-variability, the presence of signal saturation and the microphone placement relative to the source and the wearer.
The results of the investigations and validation measurements led to recommendations regard-ing the measurement procedure includregard-ing the use of external microphones havregard-ing lower sensi-tivity and provided the basis for a standardized and unique factory default calibration method intended for implementation in any mobile phone. A user-defined adjustment was proposed to minimize the errors associated with calibration and the acoustical field.
Mobile phones implementing the proposed laboratory calibration and used with external mi-crophones showed great potential as noise exposure instruments. Combined with their potential
as training and prevention tools, the expansion of their use could significantly help reduce the risks of noise-induced hearing loss.
Keywords: noise exposure, noise dosimeter, mobile phone, calibration, acoustic noise mea-surement, noise level, wearable microphones
Romain DUMOULIN RÉSUMÉ
Alors que la perte de l’audition liée au bruit est la première cause de maladie professionnelle dans les pays développés, les niveaux individuels d’exposition au bruit restent souvent incon-nus et rarement évalués. En effet, les campagnes d’exposition au bruit normalisées ont pour principal désavantage le coût de l’instrumentation et les difficultés liées à leur mise en œuvre. Avec leurs capacités techniques avancées et leur omniprésence dans notre vie quotidienne, les téléphones portables représentent une opportunité de rendre la mesure d’exposition au bruit ac-cessible. Cependant, l’utilisation des téléphones portables pour mesurer l’exposition au bruit reste limitée en raison de l’absence de procédures formelles pour leur étalonnage et les défis que représente la procédure de mesure.
Notre recherche a étudié l’étalonnage des téléphones portables pour mesurer de l’exposition au bruit avec le microphone intégré au téléphone et des microphones externes. La méthode d’étalonnage proposée intègre des corrections pour l’erreur associée au placement du micro-phone, et inclus deux types de corrections : dépendant de la fréquence avec un filtre numérique et dépendant du niveau de bruit basée sur la valeur du C-A (Niveau de bruit pondéré C moins niveau de bruit pondéré A). Les limites électro-acoustiques des téléphones portables et la procé-dure d’étalonnage ont été examinées. L’étude a également cherché à quantifier l’effet des car-actéristiques de l’exposition au bruit sur l’exactitude des mesures avec des téléphones calibrés. Les mesures ont été effectuées dans des salles réverbérante et semi- anéchoïque avec plusieurs téléphones portables du même modèle, deux types de appareils externes (une oreillette et des écouteurs avec un microphone) et un mannequin acoustique.
La méthode d’étalonnage proposée a nettement amélioré l’exactitude des mesures de niveau de bruit en champs libre et en champs diffus, avec de meilleurs résultats en champs diffus et pour des positions de mannequin causant peu ou pas d’ombrage acoustique. Plusieurs sources d’erreurs et d’incertitudes ont été identifiées incluant les erreurs associées à la variabilité entre téléphones, à la saturation du signal, la position du microphone par rapport à la source et au porteur du microphone. Les mesures de validation ont mis en avant les limites de la méthode pour traiter la saturation du signal du microphone intégré au téléphone et amènent à plusieurs recommandations concernant les procédures de mesures incluant l’utilisation de microphones externes ayant une sensibilité appropriée.
Les résultats de l’étude fournissent les bases d’une méthode normalisée et unique d’étalonnage « d’usine » destinée à être mis en œuvre dans n’importe quel téléphone portable. Un ajustage
défini par l’utilisateur a été proposé pour réduire les erreurs associées à l’étalonnage et au champ acoustique.
Les téléphones portables utilisés avec des microphones externes et incluant l’étalonnage en laboratoire proposé ont montré un grand potentiel en tant qu’un instrument de mesure de l’exposition au bruit. Combiné avec leur potentiel en tant qu’outils de formation et de préven-tion, l’augmentation de leurs utilisations pourrait considérablement aider à réduire les risques de perte d’audition due au bruit.
Mot-clés : exposition au bruit, dosimètre de bruit, téléphone portable, étalonnage, measure acoustique, niveau de bruit, microphone portable
INTRODUCTION . . . 1
CHAPTER 1 LITERATURE REVIEW . . . 13
1.1 Introduction . . . 13
1.2 Body of the review . . . 14
1.2.1 Design of mobile phones as a SLM . . . 14
1.2.1.1 Audio recording chain . . . 14
1.2.1.2 External microphones . . . 17
1.2.1.3 Audio processing in SLM apps . . . 18
1.2.1.4 Factory default calibration of mobile phones . . . 20
1.2.1.5 Specifics of the operating systems . . . 25
1.2.2 Accuracy of mobile phones as SLMs . . . 29
1.2.2.1 Performance of standardized noise exposure instruments . . . 29
1.2.2.2 Evaluation of the performance of mobile phones as SLMS . . . 33
1.2.3 Noise exposure measurements accuracy with regards to the use of mobile phones . . . 38
1.2.3.1 Overview of the noise exposure measurement sources of errors and uncertainties . . . 38
1.2.3.2 Microphone placement error and nonstandard positions . . . 40
1.2.3.3 Mobile phone noise exposure measurements . . . 43
1.3 Summary of the literature review . . . 44
CHAPTER 2 METHODOLOGY . . . 49
2.1 Acoustical test environments and instrumentation . . . 51
2.1.1 Acoustical environments and sound system . . . 51
2.1.2 Reference measurement system . . . 51
2.1.3 Noise sources . . . 53
2.1.4 Effect of the chambers’ acoustical environment on the reference measurements . . . 56
2.2 Noise measuring app and devices under test . . . 59
2.2.1 Noise measuring app . . . 59
2.2.2 Mobile phones and external microphones . . . 63
2.3 Measurement procedures . . . 66
2.3.1 Frequency response measurements . . . 67
2.3.1.1 Measurements set-up . . . 68
2.3.2 Noise levels measurements . . . 71
2.3.2.1 Measurement set-up . . . 71
2.3.2.2 Factory default calibration measurements . . . 73
2.3.2.3 Laboratory validation measurements . . . 77
2.4 Design and implementation of the calibration algorithms . . . 78
2.4.1 Frequency-dependent calibration algorithm . . . 79
2.4.1.1 Design of IIR and FIR filters . . . 79
2.4.1.2 Implementation of IIR and FIR filters . . . 82
2.4.2 Noise level-dependent calibration algorithm . . . 82
CHAPTER 3 RESULTS . . . 85
3.1 Electro-acoustical limitations of mobile phones and external microphones . . . 86
3.1.1 Mobile phone and external microphones’ frequency responses . . . 86
3.1.2 Saturation of the phone’s audio signal at high noise levels . . . 87
3.2 Factory default calibration measurements . . . 90
3.2.1 Frequency response measurements . . . 91
3.2.2 Noise level corrections measurements . . . 93
3.2.2.1 Differences due to the acoustical field . . . 95
3.2.2.2 Deviations due to the microphone placement relative to the source in the reverberant chamber . . . 98
3.2.2.3 Deviations due to the earpiece placement within the built-in ear simulator . . . 99
3.2.2.4 Deviations due to the headset microphone placement relative to the ATF . . . .100
3.2.2.5 Deviations due to the ATF dressed with a sweater . . . .100
3.3 Design and implementation of the calibration algorithms . . . .101
3.3.1 Design and implementation of frequency-dependent algorithms . . . .101
3.3.1.1 Design of IIR and FIR filters based on the device’s frequency responses . . . .101
3.3.1.2 Mobile phone implementation of the frequency-dependent algorithms . . . .103
3.3.1.3 Effect of the frequency-dependent calibration on the phone noise levels . . . .107
3.3.2 Design and implementation of the noise level-dependent algorithm . . . .109
3.4 Laboratory validation measurements . . . .112
3.4.1 Measurement repeatability . . . .113
3.4.2 Inter-unit variability in noise level measurements . . . .114
3.4.2.1 Inter-unit variability of built-in microphone measurements . . . .114
3.4.2.2 Inter-unit variability of the phone as an acquisition system . . . .116
3.4.3.1 Measurements of Sources 1, 2 and 3 . . . .116
3.4.3.2 Measurements of "real-world" audio recordings . . . .118
3.4.3.3 Microphone placement relative to the ATF: microphone orientation . . . .120
3.4.3.4 ATF position relative to the source . . . .120
3.4.3.5 Acoustical field cross-calibration . . . .121
3.4.4 Built-in microphone noise validation measurements . . . .123
3.4.4.1 Measurements of Sources 1, 2 and 3 . . . .123
3.4.4.2 Measurements of "real-world" audio recordings . . . .125
3.4.4.3 Microphone orientation: phone placed flat and on the edge . . . .126
3.4.4.4 Microphone placement relative to the source . . . .128
3.4.4.5 Acoustical field cross-calibration . . . .129
3.4.5 Earpiece validation measurements . . . .131
3.4.5.1 Measurements of Sources 1, 2 and 3 . . . .131
3.4.5.2 Measurements of "real-world" audio recordings . . . .133
3.4.5.3 Microphone placement relative to the ATF: earpiece placement . . . .133
3.4.5.4 ATF position relative to the source . . . .134
3.4.5.5 Acoustical field cross-calibration . . . .136
3.4.6 Noise dosimeter measurements . . . .137
CHAPTER 4 DISCUSSION . . . .141
4.1 Electro-acoustical limitations of mobile phones and external microphones . . . .142
4.2 Factory default calibration measurements . . . .143
4.3 Design and implementation of the calibration algorithms . . . .145
4.4 Laboratory validation measurements and accuracy of the calibrated devices . . . .148
4.5 Sources of errors and improvement of the measurement accuracy . . . .155
4.6 Basis of a mobile phone calibration methodology . . . .159
4.7 Recommendations for future works and longer-term projects . . . .160
CONCLUSION . . . .165
ANNEX I PUBLICATIONS AND PRESENTATIONS . . . .171
ANNEX II NOISE LEVEL AND NOISE EXPOSURE DESCRIPTORS . . . .185
ANNEX III NOISE EXPOSURE INSTRUMENTATION . . . .191
ANNEX IV NON-STANDARDIZED METHODS FOR THE DETERMINATION OF THE OCCUPATIONAL NOISE EXPOSURE . . . .199
ANNEX V NOISE EXPOSURE AND SPATIAL SAMPLING WITH TRACKING TECHNOLOGIES . . . .205
ANNEX VI NOISE LEVEL CORRECTION ALGORITHM . . . .207 ANNEX VII INTERPOLATION OF NOISE LEVEL CORRECTIONS, VISUAL
EVALUATION OF THE INTERPOLATION METHODS . . . .209 ANNEX VIII NOISE LEVEL CALIBRATION MEASUREMENTS . . . .213 ANNEX IX NOISE LEVEL VALIDATION MEASUREMENTS . . . .217
ANNEX X MATLAB SCRIPTS, CALIBRATION MEASUREMENTS AND
ANALYSIS . . . .221 ANNEX XI DATA SHEET OF THE EARPIECE MICROPHONE . . . .227 REFERENCES . . . .227
Table 1.1 International and american noise instrumentation standards . . . 30 Table 1.2 Difference, in dB, between the sound level meter readings and
the noise levels measured by the 3 best iOS apps, extracted from
SafetyAwakenings (2013). . . 34 Table 1.3 Difference, in dB(A), between the sound level meter readings and
the noise levels measured with the SignalScope Pro app with an
Iphone®3GS, adapted from Brown and Evans (2011) . . . 35 Table 1.4 Standard uncertainties associated with instrumentation for the
different instrument types, adapted from ISO (2008) . . . 39 Table 1.5 Recommended location of the microphone adapted from ISO
(2008). . . 41 Table 1.6 Difference between the noise dose estimated from a real and ideal
noise dosimeter, adapted from Giardino and Seiler (1996) . . . 42 Table 2.1 Standard uncertainty associated with the reference measurement . . . 53 Table 2.2 Main characteristics of noise sources used for the validation
measurements . . . 56 Table 2.3 C-A values calculated for the original source signals and the
measured signals in the anechoic and reverberant chambers. . . 59 Table 2.4 Main "audio" characteristics of the noise measuring app . . . 63 Table 2.5 Factors and measurements parameters investigated with the
frequency response measurements . . . 70 Table 2.6 Characteristics of the noise levels measurements of the three phases
of the study . . . 71 Table 2.7 Factors and measurements parameters investigated during the noise
levels corrections measurements depending on the device being
tested and the acoustical field . . . 76 Table 2.8 Factors and measurements parameters investigated during the
Table 3.1 Reference and phone C-A values measured for Sources 1, 2 and 3 in the reverberant (R) and semi-anechoic (S-A) chambers and at
reference noise level of 95 dB(A) . . . 96 Table 3.2 Noise level corrections for the Source 1,2 and 3, measured in the
reverberant (R) and semi-anechoic (S-A) chambers for a reference
noise level of 80 dB(A) . . . 98 Table 3.3 Deviations due to the ATF dressed with a sweater, measured in the
reverberant (R) and anechoic (S-A) chambers while measure . . . .100 Table 3.4 Difference between noise level measured for Source 1 and Source 3
for the built-in microphone measurements using a mobile phone
with and without a frequency-dependent calibration . . . .108 Table 3.5 Difference between noise level measured for Source 1 and Source 3
for the headset and earpiece measurements using a mobile phone
with and without a frequency-dependent calibration . . . .109 Table 3.6 Standard deviation, in dB(A), of the repeatability noise level
measurements carried out with a level-and frequency-calibrated
phone following the measurements procedures procedure #1and #2 . . . .113 Table 3.7 Standard deviation for the three devices of theLeq,A,1secnoise levels
over a 20 seconds-sequence and for noise levels between 80 and
105dB(A), N=20 (seconds) . . . .114 Table 3.8 Standard deviation, dB(A) of the built-in microphone inter-unit
variability measurements in the reverberant (R) and semi-anechoic
(S-A) chambers for Source 1, 2, 3 sequences (S1, S2, S3) . . . .115 Table 3.9 Standard deviation (dB) of the earpiece inter-unit variability
measurements with Phones #1, 2, 3, 4 in the semi-anechoic (S-A)
and reverberant (R) chambers for Source 1 . . . .116 Table 3.10 Headset overall A-weighted errors while measuring Source 1, 2, 3
(S1, S2, S3) in the semi-anechoic chamber during the
measurements #1 . . . .117 Table 3.11 Headset overall A-weighted errors while measuring Source 1, 2, 3
(S1, S2, S3) during the measurements #2, in the semi-anechoic
(S-A) and reverberant (R) chambers . . . .118 Table 3.12 Headset overall A-weighted errors while measuring "real-world"
on the ATF in the semi-anechoic (S-A) and reverberant (R)
chambers . . . .119 Table 3.13 Headset A-weighted noise levels with the microphone facing the
exterior source minus the A-weighted noise levels measured with
the microphone facing the interior in the semi-anechoic chamber. . . .120 Table 3.14 Headset overall A-weighted errors measured in the semi-anechoic
chamber with the phone implementing the "free field" (FF) and the
"diffuse field" (DF) calibration . . . .122 Table 3.15 Headset overall A-weighted errors measured in the reverberant
chamber with the phone implementing the "diffuse field" (DF) and
the "free field" (FF) factory calibration . . . .122 Table 3.16 Headset overall A-weighted errors while measuring "real-world"
audio recordings noise sources in both semi-anechoic (S-A) and reverberant (R) chambers with the phone implementing the "diffuse
field" (DF) and the "free field" (FF) calibration . . . .123 Table 3.17 Built-in microphone overall A-weighted errors measured during the
measurements #1, in the semi-anechoic (S-A) and reverberant (R)
chambers . . . .124 Table 3.18 Built-in microphone overall A-weighted errors measured during the
measurements #2, in the semi-anechoic (S-A) and reverberant (R)
chambers . . . .124 Table 3.19 Built-in microphone overall A-weighted errors while measuring
"real-world" audio recordings noise sources in the semi-anechoic
(S-A) and reverberant (R) chambers . . . .126 Table 3.20 Built-in microphone A-weighted noise levels with the microphone
placed flat minus the A-weighted noise levels measured with the microphone placed on the edge in the semi-anechoic (S-A) and
reverberant (R) chamber . . . .127 Table 3.21 Mean Square Errors (MSE) of the built-in microphone A-weighted
noise levels for two phone’s orientations "flat" and "on the edge"
measured in the semi-anechoic (S-A) and reverberant (R) chambers . . . .127 Table 3.22 Built-in microphone overall A-weighted errors in the
semi-anechoic chamber with the phone implementing the "free field"
Table 3.23 Built-in microphone overall A-weighted errors in the reverberant chamber with the phone implementing the "diffuse field" (DF) and
the "free field" (FF) factory calibration . . . .130 Table 3.24 Earpiece overall A-weighted errors measured during
the measurements #1 in the semi-anechoic (S-A) and reverberant
(R) chambers . . . .131 Table 3.25 Earpiece overall A-weighted errors measured during
the measurements #2 in the semi-anechoic (S-A) and reverberant
(R) chambers . . . .132 Table 3.26 Earpiece overall A-weighted errors while measuring "real-world"
audio recordings noise sources in the semi-anechoic (S-A) and reverberant (R) chambers and with the phone implementing the
factory calibration associated to each acoustical field . . . .134 Table 3.27 Earpiece overall A-weighted errors measured in the semi-anechoic
chamber with the phone implementing the "free field" (FF) and the
"diffuse field" (DF) factory calibration . . . .137 Table 3.28 Earpiece overall A-weighted errors measured in the reverberant
chamber with the phone implementing the "diffuse field" (DF) and
the "free field" (FF) factory calibration . . . .137 Table 3.29 Noise dosimeter overall A-weighted errors measured in the
semi-anechoic chamber (S-A) with the "Exposed Ear" ATF position and
in the reverberant (R) chamber . . . .138 Table 3.30 Noise dosimeter overall A-weighted errors while measuring
"real-world" audio recordings noise sources in the semi-anechoic chamber
(S-A) and in the reverberant chamber (R). . . .139 Table 4.1 Errors for the three devices measured in the free field and errors
published by Byrne and Reeves (2008) for the three associated noise
Figure 0.1 Concept of Accuracy based on the trueness and the precision
concepts, as defined by ISO 5725-1, ISO (1998) . . . 12 Figure 1.1 Sections of the literature review depending on their relation with
the study’s areas of research . . . 14 Figure 1.2 Hardware and software components of the audio recording path
of mobile phones . . . 15 Figure 1.3 Pictures of external microphones : MicW® i436 microphone
from MicW (2013) on the left and iTestMic® microphone from
Studiosixdigital on the right . . . 18 Figure 1.4 Existing calibration methods found in related work, numerically
computed for a Nokia 5230 mobile phone, adapted from Stevens
(2012) . . . 24 Figure 1.5 Calibration points for our 11 Nokia 5230 handsets (based on
white noise calibration), plus the “average” calibration points for a generic Nokia 5230. Reproduced with the permission from Stevens
(2012) . . . 25 Figure 1.6 Differences between (uncalibrated) Android mobile phones for
noise levels measured with NoiseTube app. Data are extracted by
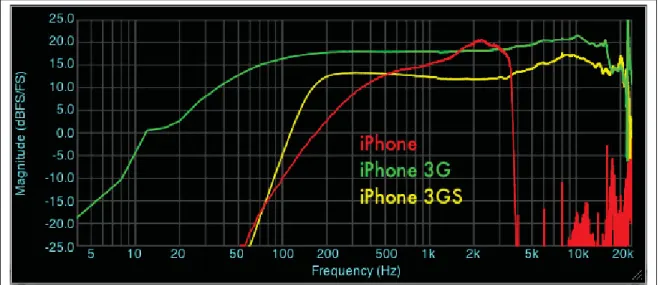
the author from the NoiseTube app calibration database . . . 27 Figure 1.7 Built-in iPhone Microphone Frequency Response Comparison.
Reproduced with the permission from Faberacoustical (2009) . . . 28 Figure 1.8 iPhone 4 Headset Microphone Frequency Response Comparison.
Reproduced with the permission from Faberacoustical (2009) . . . 28 Figure 1.9 Validation measurements for white noise made by the calibrated
Nokia 5230 #0 and a professional SLM. Reproduced with the
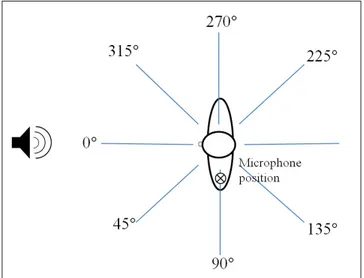
permission from Stevens (2012) . . . 37 Figure 1.10 Incident angles for microphone placement, adapted from Giardino
Figure 1.11 Mean A-weighted microphone placement errors (in dB) for the "Left-Chest" and "Left-Hanging"positions, adapted from Byrne
and Reeves (2008) . . . 45 Figure 2.1 Layout of the Semi-anechoic and reverberant chambers drawn to
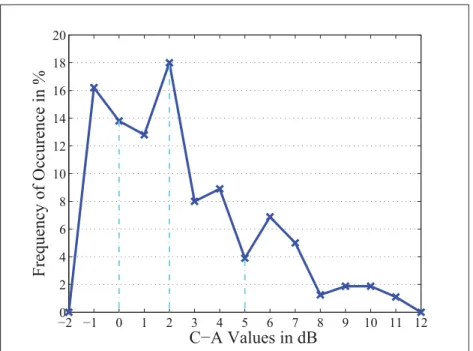
scale including the locations of the loudspeakers . . . 52 Figure 2.2 Histogram of the C-A values of NIOSH100 noise source database
highlighting the 20th, 50th and 80th percentile of the C-A values
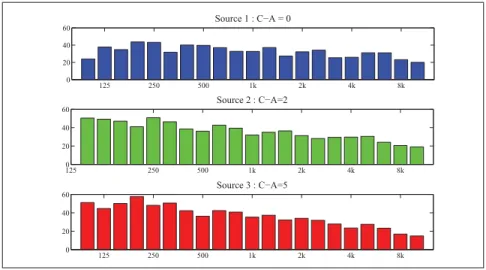
distribution: 0, 2 and 5 respectively . . . 54 Figure 2.3 Noise spectrum of Sources 1, 2 and 3 with C-A value of 0, 2 and 5
respectively . . . 55 Figure 2.4 Sequence of 7 30-seconds signals of Source 1 with the noise level
increasing by 5 dB every time and with a 5 second silence between
each signal . . . 55 Figure 2.5 Frequency content of the ambient noise, the original signals of
Sources 1, 2 and 3 and the measured Sources 1, 2 and 3 with the
reference system in the semi-anechoic chamber . . . 57 Figure 2.6 Frequency content, in third-octave bands of the ambient noise, the
original signals of Sources 1, 2 and 3 and the measured Sources 1,
2 and 3 with the reference system in the reverberant chamber . . . 58 Figure 2.7 Frequency content, in third-octave bands of the original signals of
the noise sources used for the validation and the measured noise
sources with the reference system in the semi-anechoic chamber . . . 58 Figure 2.8 Audio processing components of the mobile phone and the noise
measuring app, red boxes represent the components and classes
that come from the NoiseTube Android app code source . . . 61 Figure 2.9 Unit of ZTE N762 mobile phone with the adapter cable plugged
into the phone’ audio input and the built-in microphone encircled
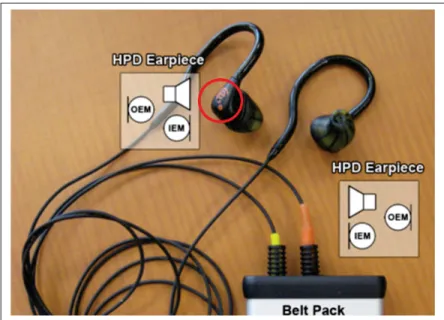
in red . . . 64 Figure 2.10 Sonomax® earpiece from the individual dosimetric hearing
protection with the emplacement of the microphone encircled in
red adapted with the permission from Mazur and Voix (2013) . . . 65 Figure 2.11 Electronic schematic of the adaptor cable with the circuit of the
Figure 2.12 Frequency response of the Sonomax® earpiece microphone,
extracted from Sonion (2009) . . . 66 Figure 2.13 Sonomax® earpiece on the ATF’s built-in ear simulator with the
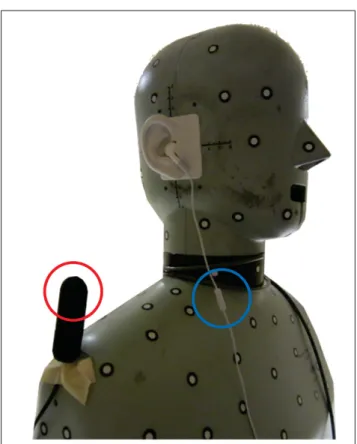
location of microphone encircled in red . . . 66 Figure 2.14 Placement of the Apple iPhone®headset microphone (encircled in
blue), and the standardized noise dosimeter (encircled in red) on
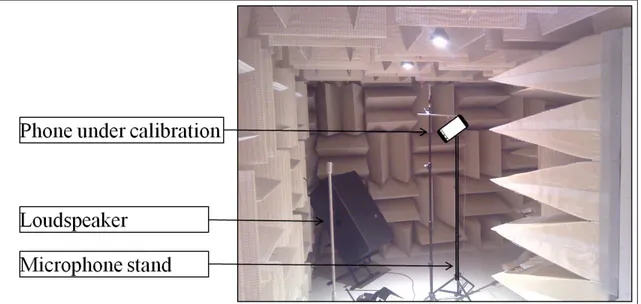
the ATF . . . 67 Figure 2.15 Setup of the calibration measurement in the semi-anechoic
chamber showing a mobile phone under calibration and the
loudspeaker. . . 69 Figure 2.16 ATF position relative to the loudspeaker. . . 69 Figure 2.17 Variations of the earpiece mounting in the vicinity of the ear . . . 70 Figure 2.18 Top view of 2 of the 4 ATF positions relative to the source in the
semi-anechoic chamber . . . 73 Figure 2.19 Top view of two ATF positions relative to the sources in the
reverberant chamber . . . 74 Figure 2.20 Measurement set-up in the reverberant chamber with the ATF
located on the center of the reverberant chamber . . . 75 Figure 2.21 Top view of the built-in microphone orientation in the
semi-anechoic chamber with the mobile phone placed flat . . . 75 Figure 2.22 Side view of the built-in microphone orientation in the
semi-anechoic chamber: mobile phone placed flat (on the left) and on
the edge (on the right) . . . 76 Figure 3.1 Relative magnitude of the frequency of response as subtracted to
the magnitude of the reference system measurement frequency
response, while measuring Source 3 at 90 dB(A) . . . 87 Figure 3.2 Mobile phone noise levels measured in the anechoic chamber while
measuring Source 1 . . . 88 Figure 3.3 Built-in microphone noise levels while measuring Source 1, 2 and
3 in the semi-anechoic chamber . . . 89 Figure 3.4 Frequency responses of the measurements conducted with the
magnitude normalized at the 1 kHz third-octave band noise level
(top bottom) . . . 90 Figure 3.5 Frequency responses of the measurements conducted with
reference microphone plugged into the mobile phone with the
magnitude normalized at the 1 kHz third-octave band noise level . . . 90 Figure 3.6 Frequency responses of the measurements conducted with the
headset with the magnitude normalized at the 1 kHz third-octave
band noise level . . . 91 Figure 3.7 Transfer function and coherence values from the measurements
conducted with the earpiece located on a microphone stand and
for two positions on the ATF . . . 93 Figure 3.8 Transfer function and coherence values calculated from the
measurements conducted with the headset microphone located on
a microphone stand and on the ATF . . . 94 Figure 3.9 Transfer functions calculated from the earpiece measurements with
slight variations of the earpiece placement within the built-in ear
simulator . . . 94 Figure 3.10 Transfer functions calculated from the built-in microphone
measurements of the 4 ZTE N762 mobile phone units . . . 95 Figure 3.11 Transfer function and coherence values calculated from earpiece
measurements in the semi-anechoic and reverberant chambers with
the earpiece on a stand and on the ATF . . . 95 Figure 3.12 3D views of the interpolated noise level corrections measured in
the semi-anechoic (in red) and reverberant (in blue) chambers for the headset (top), built-in (middle), and earpiece (bottom)
microphones. . . 97 Figure 3.13 Built-in noise level measurements measured in the semi-anechoic
(S-A, in dashed line) and reverberant (R) chambers . . . 98 Figure 3.14 Noise level corrections measurements for five variations of
earpiece placement within the built-in ear simulator measured in
the semi-anechoic chamber. . . 99 Figure 3.15 Initial transfer function (in blue) based on the built-in microphone
measurement, truncated-transfer functions, defined from 80 Hz to
Figure 3.16 Initial transfer function based on the built-in microphone measurement and frequency responses of 6th-order IIR filters calculated from the truncated-transfer function, defined from 80
Hz to several truncated-end starting at 10485 Hz until 5635 Hz . . . .104 Figure 3.17 Built-in microphone initial transfer function, defined from 0 to
11025 Hz, and frequency responses of IIR filters for orders from 2 to 14, calculated from the truncated-transfer function (from 80 Hz
to 6700 Hz) . . . .104 Figure 3.18 Headset transfer functions based on the measurement for different
microphone placements and frequency responses of the 12th order IIR filters, calculated from the truncated-transfer functions (from
43 Hz to 7250 Hz) . . . .104 Figure 3.19 Earpiece initial transfer function for the earpiece located on the
ATF and frequency responses of IIR filters for orders from 2 to 14 . . . .105 Figure 3.20 Earpiece initial transfer function for the earpiece located on a stand
and frequency responses of IIR filters for orders from 2 to 14 . . . .105 Figure 3.21 Frequency responses of IIR calculated from the truncated-transfer
functions and frequency responses of FIR filters for orders from 30thto 240thorder based on the initial built-in microphone transfer
function . . . .106 Figure 3.22 Earpiece transfer function and coherence values, frequency
responses of 12thorder IIR filters . . . .106 Figure 3.23 Histogram of the processing time required by the mobile phone
app to compute a Leq,A,1sec over a one-minute-measurement and
depending on the IIR and FIR filters order . . . .107 Figure 3.24 Built-in microphone noise level with a frequency-dependent
calibration (6th order IIR filter), function of the reference noise
level, while measuring Source 1, 2, 3 . . . .108 Figure 3.25 Built-in microphone measured noise level correction values (in
red) and interpolated values with the griddata MATLAB function
and the linear and cubic methods . . . .110 Figure 3.26 Measured built-in microphone noise level correction values (in red)
and interpolated values with the griddata MATLAB function and
Figure 3.27 Measured earpiece noise level correction values (in red) and interpolated values with the v4 method (on the left) and the cubic
method (on the right) . . . .111 Figure 3.28 Built-in microphone, headset and earpiece Leq,A,1sec, measured
during the validation measurements for 6 noise levels . . . .115 Figure 3.29 Headset noise level measurements carried out in the semi-anechoic
chamber, with only a frequency-dependent calibration (IIR calibration) and with frequency and level-dependent calibration
(Full Calibration) . . . .118 Figure 3.30 Headset noise level measurements carried out in the reverberant
chamber, with only a frequency-dependent calibration (IIR calibration) and with frequency and level-dependent calibration
(Full Calibration) . . . .119 Figure 3.31 Headset overall A-weighted errors, averaged over the range of
noise levels, in the semi-anechoic chamber (in red) and in the
reverberant chamber (in blue) . . . .121 Figure 3.32 Built-in microphone noise level measurements in the
semi-anechoic chamber without calibration, with only a frequency-dependent calibration (IIR calibration) and with frequency and
level-dependent calibration (Full Calibration) . . . .125 Figure 3.33 Built-in microphone noise level measurements in the reverberant
chamber with only a frequency-dependent calibration (FIR calibration) and with frequency and level-dependent calibration
(Full Calibration) . . . .126 Figure 3.34 Built-in microphone overall A-weighted errors for various
microphone placement and noise levels, while measuring Source
1 in the semi-anechoic chamber . . . .128 Figure 3.35 Built-in microphone overall A-weighted errors for various
microphone placement and noise levels, while measuring Source
1 in the reverberant chamber . . . .129 Figure 3.36 Earpiece overall A-weighted errors measured in the semi-anechoic
chamber with only a frequency-dependent calibration (FIR
calibration) and with frequency and level-dependent calibration
Figure 3.37 Earpiece noise level measurements, while measuring Sources 1,2, 3 in the reverberant chamber, with only a frequency-dependent calibration (FIR calibration) and with frequency and
level-dependent calibration (Full Calibration) . . . .133 Figure 3.38 Noise level measurements for five variations of earpiece placement
within the built-in ear simulator measured in the semi-anechoic
chamber . . . .135 Figure 3.39 Noise level measurements for five variations of earpiece placement
within the built-in ear simulator measured in the reverberant
chamber . . . .135 Figure 3.40 Earpiece overall A-weighted errors in the semi-anechoic chamber
(in red an orange) and in the reverberant chamber (in blue) . . . .136 Figure 3.41 Noise dosimeter overall A-weighted errors averaged over the range
of noise levels in the semi-anechoic chamber (in red) and in the
reverberant chamber (in blue) . . . .139 Figure 4.1 Built-in microphone noise level correction values measured in
the semi-anechoic chamber (colored dots) and interpolated values
calculated using the v4 method. . . .152 Figure 4.2 User-defined adjustment preliminary flow of questions, associated
ATF Acoustical Test Fixture FFT Fast Fourier Transform FIR Finite Impulse response
HEG Homogeneous noise Exposure Group IIR Infinite Impulse response
HPD Hearing Protection Device NIHL Noise-Induced Hearing Loss RFID Radio Frequency Identification
RMS Root Mean Square
SLM Sound Level Meter
SPL Sound Pressure Level
TF Transfer Function
LEX.8h A-weighted noise exposure level normalized over 8 hours
Lp Sound pressure level in dB
p Effective sound pressure in Pa
pref Reference sound pressure, 20μPa
Despite the increasing presence of hearing conservation programs and noise exposure regula-tions, occupational noise-induced hearing loss (NIHL) remains a problem in developed coun-tries. First, occupational NIHL is still the most common work-related injury in Canada and the United States. In the United States, around 30 million workers are exposed to hazardous noise and the estimated annual cost for workers’ compensation for hearing loss disability is 242 million dollars according to NIOSH (2001). Second, the prevalence of NIHL among teenagers and young adults has increased and recent studies have brought to light NIHL risks in fields that were generally given less consideration such as the entertainment industry. Noise exposure assessments play a key role in the evaluation and prevention of NIHL. These assessments are used to ensure compliance with regulations and determine that hearing conservation programs are implemented including engineering and administrative actions, audiometric tests and pro-vision of hearing protection devices (HPDs). Individual workers’ noise exposure levels are still rarely known and infrequently tracked. This may be because standardized noise exposure cam-paigns require instrumentation that could be costly and are difficult to implement in the field. In complement to these procedures, informal noise surveys carried out with cheaper basic sound level meters do not hold metrological quality. Standardized noise exposure instruments, noise dosimeters and integrating sound level meters ensure the quality of the measurements as they meet standards’ requirements for the main electro-acoustical characteristics including linear-ity, frequency response and directivity. However, their use by small companies, self-employed workers or the general public remain very limited. While Rabinowitz et al. (2011) states that, "monitoring daily occupational noise exposure inside hearing protection with ongoing admin-istrative feedback apparently reduces the risk of occupational NIHL in industrial workers", recent technology used to monitor the daily at-ear noise exposure remains relatively expensive and difficult to access.
According to Ericsson (2013), there are about 1.6 billion people across the globe that have smartphones and the number is forecasted to reach 5.6 billion by 2019. The growth of mobile
technology has led to the development of thousands of types of mobile phone applications, including apps that measure noise levels. Any mobile phone with an operating system that supports programmable applications could possibly be used as an noise exposure instruments since they already feature a built-in microphone and audio hardware components. This trend is in line with the emergence, from around 2005, of low-cost noise exposure instruments, called dose indicators, such as the NI-100® from 3M or the PocketEar® from SoundEar A/S, that provide a basic estimation of the noise dose with a limited quality and without meeting the standards’ requirements. Using mobile phones for measuring noise exposure takes advantage of the ubiquity of mobile phones in people’s lives: mobile phone users almost always have their mobile phones with them including at work and during recreational activities. Without any purchase of additional equipment, one can download and use a sound level meter (SLM) app very easily.
Statement of the Problem
Unlike standardized professional noise exposure instruments, a mobile phone’s microphone and others hardware and software components have not been designed for measuring noise. While mobile phones have technical capabilities to measure noise levels, their widespread use for measuring occupational noise exposure is still limited due to the lack of formal calibration procedures and challenges regarding the measurement procedure. Moreover, design guidelines and standards that define the requirements of traditional noise exposure instruments hardly apply to mobile phone solutions. Standardized noise exposure instruments are linear (level independent) over a wide range of noise levels and have a flat frequency (frequency and level independent) response. Their factory calibration consists in determining the sensitivity level of the instrument based on a standardized calibration procedure. This traditional approach of a unique, frequency and level independent, calibration value, such as the sensitivity at 1 kHz, is not suitable for mobile phone-based solutions since an SLM app may be run on different mobile phones that have different microphones, hardware and software components with vari-able range of quality. The electro-acoustical limitations of the phones’ audio recording chain require new calibration methods and/or the use of dedicated external hardware.
Standardized noise exposure measurements, defined in CSA (2013) or ISO (2008) can fol-low two main sampling approaches, both associated with a specific type of noise exposure instrument. The full-day approach consists in continuous measurements conducted with noise dosimeters over an entire work day. Noise dosimeters units are carried by the worker with the microphone located on top of the shoulder on the side of the most exposed ear. The task-based approach consists in several separate measurements taken during the tasks representative of the working day, conducted with SLMs and integrating SLMs. SLMs are placed at the location where the worker’s head would be and they are either hand-held by an operator or fixed. New challenges related to noise exposure measurements with mobile phones could be identified as:
• Microphone positions recommended in the standards are not adapted for mobile phone built-in microphones;
• The calibrator used for field calibration is not adapted for mobile phone’ built-in micro-phones;
• The measurement procedures associated with mobile phones are not adapted for long-term measurements;
• A mobile phone’s audio recording chain is not suited for taking measurements of high levels of noise.
Therefore, tabulated data of uncertainties associated with the instrumentation and used for the calculation of noise exposure in standards such as CSA (2013) or ISO (2008), are not suitable for mobile phone measurements. Nevertheless, mobile phones have definitively technical ad-vantages over traditional noise exposure instruments: they support programmable applications, they embed various technologies and sensors and they can provide a strong interactivity with the users. A mobile phone-based solution for measuring noise exposure may use these benefits to improve the quality of noise levels measurements.
Background and Need
Cer-tain external microphones have been specifically designed for noise level measurements with mobile phones. They are intended to be used as sound level meters, using the task-based sam-pling approach in the case of noise exposure measurements. They aim to have better acoustics characteristics than the built-in microphones, especially regarding directivity and frequency re-sponse. A few of them also integrate a microphone preamplifier and analogue to digital (A/D) converters and even meet some of the ANSI and ISO Type-2 specifications. Although these external microphones improve the quality of the noise level measurements, their cost and their accessibility remains a barrier for widespread use of mobile phones for measuring noise ex-posure. Finally, the use of other type of external microphones, non-dedicated for noise levels measurements, such as headset in-line microphones or earpiece microphone, have not been investigated.
Most of the SLM mobile phone applications (apps) available through "app stores" (Google Play, Apple app store, Nokia Store) are designed and used for recreational purposes. They usually feature a basic sound level meter that displays noise levels without time integration or data logging. Since the most documented projects come from academics specialized in com-puter science, their research challenges were more focused on mobile sensing issues such as scalability, context-awareness or privacy, rather than noise measurements quality or compli-ance with regulations. A review of the existing apps shows that the most common factory default calibration consist in a single level and frequency-independent correction regardless of the phone model. More elaborated and accurate approaches consist in calibrating a mo-bile phone depending on the phone model or depending on a particular unit. The calibration algorithms, implemented in SLM apps to adjust mobile phone sensitivity can be either level-dependent, frequency-dependent or a combination of both approaches. Level-dependent algo-rithms consist in corrections applied on the to-be corrected phone sound pressure level (SPL) and frequency-dependent algorithms use filters to correct and flatten the frequency response of audio recording signals. While all calibration algorithms described in the literature are based on SPL corrections, neither frequency-dependent algorithms, nor a combinations of both fre-quency and level-dependent algorithms have been investigated in the literature.
In the only study found that discusses in detail factory default calibration of mobile phones, Stevens (2012) presents the different calibration paradigms and algorithms (section 1.2.1.4) and describes his proposed calibration approach for the NoiseTube app with the following characteristics:
• A phone model-dependent calibration; this author assessed that differences between in-dividual units of the same model were small enough so that the calibration can be inde-pendent of the unit used;
• A level-dependent algorithm; a frequency-dependent calibration was found not relevant, as he assessed that the frequency response of the phone model he used was "flat enough"; • No field calibration; as he concluded that differences between two calibration measure-ments conducted with a five months interval with one mobile phone were, again "small enough"..
However, Stevens (2012)’s calibration approach presents several limitations:
• Calibration measurements were conducted with only one artificial white noise source, only in an acoustical free field environment;
• Only a few units of the one phone model were investigated during the calibration mea-surements;
• The microphone placement error due to body acoustical shadowing and reflections, the importance of which is discussed in detail in section 1.2.3, is not taken into account in the calibration compensations;
• The saturation of the audio recording chain at very high noise levels is not specifically considered: NoiseTube app was dedicated for measuring environmental noise sources with a range of noise levels of interest below 90 dB(A).
The few studies that evaluated the quality of mobile phone measurements, detailed in section 1.2.2, were based on noise levels comparisons of an existing app over measurements from a
professional sound level meter. The work by Stevens (2012) with the NoiseTube app is the most extensive investigation. It shows good agreement between the phones and sound level meter measurements up to approximatively 95 dB(A). However, the measurements were con-ducted for one white noise spectrum and with only one particular phone unit and its built-in microphone. The review of the studies shows the lack of a common methodology to evaluate the quality of the mobile phone as SLM. The methodologies employed vary from the mea-surements in laboratory environments with artificial and recorded real-world noise sources to measurements in real-world conditions.
The use of mobile phones for occupational noise exposure measurements has not been studied yet. Although the SLM apps are designed to be used with the phone hand-held, this approach is hardly suitable for long-term continuous noise exposure measurements. There is a need for investigating the phones’ microphone positions (including those of external microphones) and their impact on the measurement quality. Studies with noise dosimeters highlight that microphone placement error is one of the main source of errors. In the study about nonstandard microphone positions for noise dosimeters, Byrne and Reeves (2008) showed the impact of the acoustic field on the microphone placement error: the overall errors due to microphone placement were minor in a diffuse field whereas in a free-field, the errors depended greatly on the microphone position, the noise source location and the noise spectrum. In short, it appears that the quality of a real-world mobile phone noise level measurements relies on:
• The characteristics of the phone’s hardware and software audio components;
• The quality of the SLM app including the calibration algorithm and the quality of the calibration measurements;
• The characteristics of the "real-world" environment and the errors associated with the use of the phone, such as the microphone placement error.
Purpose of the Study
The cost and the usability of standardized noise exposure instruments limit their widespread use in both occupational and recreational noisy environments. Mobile phones can easily act
as sound level meters however the quality of the current solutions have not been sufficiently investigated and proved to justify their use for professional noise exposure measurements. The purpose of this study was to investigate the calibration of mobile phone-based solutions for measuring noise exposure. First, this study investigated the frequency response and the level linearity of mobile phones employed with built-in microphones and with external microphones. Second, a factory default calibration measurements including frequency response and noise levels measurements was investigated. The particularity of the proposed calibration approach, especially for wearable external microphones, was to consider the microphone placement error in the calibration corrections. The primary goals of investigation were:
• The design guidelines for factory default calibration algorithms;
• The impact of the noise characteristics (acoustic field, noise spectrum) and microphone placement on the calibration measurements.
Third, laboratory validation measurements were conducted by varying the noise sources, the acoustical field, the microphone placements and the factory default calibration parameters in order to evaluate how those factors affect the accuracy of calibrated mobile phone measure-ments. The measurement precision of the calibrated measurements was evaluated together with the uncertainties associated with the repeatability and the inter-phone unit variability. An Android-based app that was developed by the author. It implemented the designed fre-quency and level-dependent calibration algorithms, calculated phone noise levels and recorded audio signals. Measurements were carried out in reverberant and semi-anechoic chambers with several mobiles phone units of the same model, two types of external devices (an earpiece and a headset with an in-line microphone) and an acoustical test fixture (ATF). The range of noise levels investigated in the study, from 75 to 105 dB(A) was considered to be representative of the noise levels in industrial and recreational environments implying a high risk of hearing loss.
Research questions
The main research question addressed in this study was: How should a mobile phones-based solution be calibrated for measuring noise exposure? The subquestions were the following:
• How should mobile phone’s electro-acoustical limitations and noise exposure character-istics be taken into account in the design of a mobile phone factory default calibration? • How does the accuracy of calibrated mobile phone noise exposure measurements depend
on the noise characteristics?
• How could the accuracy of mobile phone measurements be improved?
Significance of the Study
The study was the first research work to investigate a mobile phone calibration approach that integrates corrections for the microphone placement error and considers wearable external mi-crophones. The results showed that the proposed calibration approach significantly improved the accuracy of the noise level measurements in diffuse and free fields. Limitations of the approach for handling the built-in microphone signal saturation led to the use of external mi-crophones having more appropriate sensitivity. A user-defined adjustment was proposed to minimize the errors with the calibration. The results of the investigations provided the basis for a standardized and unique factory calibration method intended for implementation in any mobile phone.
Major technical contributions of the study bear on the design and implementation of a fre-quency response linearization with a digital filter and a noise level-dependent calibration algo-rithm as a function of the C-A. It includes:
• a Java™ and Android-based app software;
• Matlab scripts for the analysis of the phone measurement files, the design of a FIR filter and the interpolation of noise level corrections.
Roadmap
Chapter 1 presents a literature review that addresses areas related to the development a mo-bile phone-based solution for measuring noise exposure: the design of a momo-bile phones as SLMs, the studies regarding the accuracy of mobile phones as SLMs and research related to the accuracy of noise exposure measurements in real world environments. Chapter 2 describes the methodology of the study including the noise measuring app developed by the author, the mobiles phones and external microphones used during the study, the procedures of both cali-bration and validation measurements, and finally, the design and implementation of calicali-bration algorithms. Chapter 3 presents all the results of the study. It includes the study of the electro-acoustical limitations of mobile phones and external microphones, the results associated with the design and implementation of the calibration algorithms and the results of the laboratory calibration and validation measurements. Chapter 4 summarizes and discusses the major find-ings of the study. The basis of a mobile phone calibration methodology is described and it also presents the main sources of errors and uncertainties identified in the study within methods to minimize the errors. Finally, recommendations for future works and longer-term projects are discussed.
Definitions and terminology
The definition of the following concepts, written by the author, clarify some of the terminology used in this thesis.
• Noise exposure instruments refers to the instrumentation recommended to use to
mea-sure noise expomea-sure: noise dosimeters (referred to as personal sound expomea-sure meters in certain standards) and the integrating-averaging sound level meters (SLMs);
• Noise exposure measurements corresponds to A-weighted noise level measurements
con-ducted with noise exposure instruments;
• Noise exposure assessment corresponds to a procedure that aims to determine the overall
follow-ing a specific samplfollow-ing strategy and the analysis and presentation of the measurements results;
• Mobile phone is synonymous with smartphone (for the purposes of this thesis), it
cor-responds to a mobile phone that has an operating system with the capability to support programmable applications;
• Overall A-weighted error is the A-weighted noise level measured with the phone
mi-nus the A-weighted noise level measured with the reference measurement system and conducted at the center-of-head with no ATF.
The terminology of the following concepts are used in this thesis. Their definitions are ex-tracted from the International vocabulary of metrology, JCGM (2012):
• Measurement accuracy: closeness of agreement between a measured quantity value and
a true quantity value of a measurand. The concept ‘measurement accuracy’ is not a quantity and is not given a numerical quantity value. A measurement is said to be more accurate when it offers a smaller measurement error;
• Measurement trueness: closeness of agreement between the average of an infinite
num-ber of replicate measured quantity values and a reference quantity value. Measurement trueness is not a quantity and thus cannot be expressed numerically, but measures for closeness of agreement are given in ISO 5725, ISO (1998);
• Measurement precision: closeness of agreement between indications or measured
quan-tity values obtained by replicate measurements on the same or similar objects under specified conditions;
• Measurement error: measured quantity value minus a reference quantity value;
• Measurement repeatability: measurement precision under a set of repeatability
condi-tions of measurement;
• Measurement uncertainty: non-negative parameter characterizing the dispersion of the
• Calibration: operation that, under specified conditions, in a first step, establishes a
rela-tion between the quantity values with measurement uncertainties provided by measure-ment standards and corresponding indications with associated measuremeasure-ment uncertain-ties and, in a second step, uses this information to establish a relation for obtaining a measurement result from an indication;
• adjustment of a measuring system: set of operations carried out on a measuring system
so that it provides prescribed indications corresponding to given values of a quantity to be measured;
• Validation: verification, where the specified requirements are adequate for an intended use;
• Correction: compensation for an estimated systematic effect;
• Sensitivity of a measuring system: quotient of the change in an indication of a measuring
system and the corresponding change in a value of a quantity being measured.
Returning to the concept of accuracy, according to ISO 5725-1, ISO (1998), it consists of the combination of measurement trueness (as defined in ISO 5725-1) and measurement precision, as illustrated in Figure 0.1. Noise level descriptors and noise level-associated terminology are defined and explained in Annex II, including the definition of the sound pressure level, the frequency weightings A and C and the equivalent continuous sound level, also referred to as
Leq.
Limitations
The very limited number of devices being tested (four units of the same phone model, one earpiece and one headset) prevented the generalization of some of the findings to a larger set of mobile phones models. The use of an ATF with the external microphones measurements, as compared to human subjects, limited the results interpretation regarding the investigation of the microphone placement error. Validation measurements were conducted in controlled laboratory environments during a short period of time, thereby, several uncertainties and errors have not been investigated in this study, such as the error due to the instrumental drift caused by aging or the errors associated with measurements in "real-world" environments (contributions
Figure 0.1 Concept of Accuracy based on the trueness and the precision concepts, as defined by ISO 5725-1, ISO (1998)
from wind, the microphone rubbing on clothing,etc.). This study did not investigate the noise exposure assessments or the overall measurement uncertainty that includes for example the uncertainties associated with the sampling of the measurements.
1.1 Introduction
Noise exposure assessments play a key role in the evaluation and prevention of NIHL. These assessments are used to ensure compliance with regulations and determine that hearing conser-vation programs are implemented including engineering and administrative actions, audiomet-ric tests and provision of hearing protection devices (HPDs). NIHL is the number one occupa-tional disease, individual workers’ noise exposure levels are still rarely known and infrequently tracked.This may be because standardized noise exposure campaigns require instrumentation that could be costly and are difficult to implement in the field. Standardized noise exposure instruments, noise dosimeters and integrating sound level meters ensure the quality of the mea-surements as they meet standards’ requirements for the main electro-acoustical characteristics including linearity, frequency response and directivity. However, their use by small compa-nies, self-employed workers or the general public remain very limited. Unlike standardized professional noise exposure instruments, a mobile phone’s microphone and others hardware and software components have not been designed for measuring noise. While mobile phones have technical capabilities to measure noise levels, their widespread use for measuring occu-pational noise exposure is still limited due to the lack of formal calibration procedures and challenges regarding the measurement procedure. Design guidelines and standards that define the electro-acoustical requirements of traditional noise exposure instruments hardly apply to mobile phone solutions.
The literature review will address three areas related to the development a mobile phone-based solution for measuring noise exposure. The first section will address research related to the design of a mobile phones as SLMs. It covers a survey of the hardware and software compo-nents that are involved in the design of mobile phones as SLMs and a review of the current factory default calibrations approaches including the algorithms and the measurements
pro-cedures. The second section focuses on studies regarding the accuracy of mobile phones as SLMs. Finally, the third section will discuss research related to the accuracy of noise exposure measurements in real world environments with an emphasis on the sources of errors and uncer-tainties. Figure 1.1 presents the relations betweens sections of the literature review depending on the three areas of research.
Figure 1.1 Sections of the literature review depending on their relation with the study’s areas of
research
1.2 Body of the review
1.2.1 Design of mobile phones as a SLM
1.2.1.1 Audio recording chain
Overview
The audio recording chain includes all the phone’s hardware and software components in-volved in the recording of an audio signal. With the noise levels calculating from the recorded audio signal, the audio recording chain has an significant impact on the quality of the phone
measurement. Figure 1.2, adapted from Stevens (2012), illustrates the different components of an audio recording chain, as mentioned by Stevens (2012), "labels in italics signify that the parameters or properties of the component in question are unknown or uncontrollable from the perspective of the app" and the boxes with a dashed outline represent components which may or may not be present on a particular device, and whose presence may be undetectable from the perspective of the app".
Figure 1.2 Hardware and software components of the audio recording path of mobile phones
Built-in microphones in mobile phones were originally electret condenser microphones (ECM). According to Akustica (2011), ECM present two main limitations: their large size and their non-homogeneous electro-acoustic characteristics, such as the nominal sensitivity and the back-ground noise level. Since the 2010s, MicroElectrical-Mechanical System (MEMS) micro-phones have become the preferred microphone solution for mobile micro-phones. They are smaller than ECMs and highly homogeneous in phase and sensitivity response. Based on the infor-mations provided by manufacturers, MEMS have a good omni-directional response with a
dynamic range of around 120dB, a signal-to-noise ratio around 60 dB and a flat frequency response from 60-100 Hz to 15-20 kHz. Microphones in mobile phone are very rarely doc-umented and it usually requires a mobile phone tear-down, as outlined on Ifixit.com (2013), to determine the microphone models used within a given phone. However, the microphone characteristics alone without the entire phone’s audio recording chain is of little use: the mi-crophone sensitivity is affected by hardware components such as the A/D converter and the microphone frequency response is affected by the placement of the microphone inside a mo-bile phone. The only microphone characteristic to consider remains the inter-unit variability of the microphone sensitivity, given in the microphone data sheets with a standard deviation in dB or with minimum and a maximum sensitivity values.
Instantaneous voltage output from the microphone is converted by the A/D converter in sam-ples. The sampling rate, and format of the digitalized audio stream are specified through the audio framework of the phone’s operating system that manages the hardware and software components of mobile phones. For SLM apps that use 16-bit PCM (Pulse-Code Modulation) audio bit depth such as NoiseSpy, Kanjo (2009) or NoiseTube, Stevens (2012), instantaneous voltage output from the microphone is converted in samples signed short values between -32768 and + 32767 where + 32767 represents the maximum positive voltage and - -32768 represents the minimum negative voltage. In addition to the basic microphone signal condi-tioning and A/D conversion, mobile phones also integrate specific audio processing such as automatic gain control, noise suppression, echo canceler and equalization. According to An-droid (2013), Automatic Gain Control (AGC) "normalizes the output of the captured signal by boosting or lowering input from the microphone to match a preset level so that the output signal level is virtually constant". The presence or the absence of these features depend on the manufacturer and the operating system requirements, as detailed later in section 1.2.1.5. The audio processing features are sometimes controllable from the application depending on the hardware implementation and the access provided by the operating system of the phone. At the software level, illustrated in Figure 1.3, several objects handle the audio processing: the encoder and the wrapper tackle the encoding and formating of the audio stream into digital
data and the recorder allows the phone applications to control and specify parameters of audio recording signal, such as the format, the sampling rate or the bit depth.
1.2.1.2 External microphones
Built-in microphones can be bypassed using external microphones, plugged into the analog audio input of the phone, the micro USB port (for Android-based smartphones) or the dock connector (for iOS-based devices). External microphones are integrated in a large variety of device such as headset, headphones and Bluetooth™ear-piece. External microphones specif-ically designed for phone acoustic measurements aim to offer better directivity and the fre-quency response than built-in microphones at a fraction of the cost of professional noise ex-posure instruments. For example, the MicW® i436 is an external electret microphone that connects to the mobile phone with an audio connector (Figure 1.3). Although Studiosixdig-ital states that there is no improvement in frequency response with MicW® compared to the iPhone built-in microphone, Faberacoustical (2012b) highlights its flat frequency response and its omni-directionality that is supposedly designed to meet the Class 2 standard for sound level meters. One other advantage highlighted by Faberacoustical (2012b) is that the microphone size allows a field calibration with a sound calibrator and an adapter.
Other external measurement microphones come with hardware components that bypass a sig-nificant portion of mobile phone audio recording path. The iTestMic® microphone by Stu-dioSixDigital integrates a microphone preamplifier, A/D converters, and USB digital audio in-terface. It is designed for iOS-based devices as it uses a dock connector interface (Figure 1.3) and according to Studiosixdigital, it meets ANSI / ISO Type-2 specifications for frequency response, linearity, and directional characteristics.
Figure 1.3 Pictures of external microphones : MicW®i436 microphone from MicW (2013) on the left and iTestMic®
microphone from Studiosixdigital on the right
1.2.1.3 Audio processing in SLM apps
This section presents the main audio processings employed in SLM apps to calculate noise levels excluding the factory default calibration processing described in detail in the following section (§ 1.2.1.4).
The main components of SLM apps are the audio decoder, the filter component, the noise level calculator including the calibration algorithms. In traditional noise exposure instruments, noise exposure metrics, detailed in Annex II, are calculated using either only hardware components for analog instruments or a combination of hardware and software components in digital instru-ments. Annex III provides an overview of the audio processing that leads to the calculation of noise metrics in sound level meters (SLMs), integrating sound level meters and noise dosime-ters. In SLM apps, the calculation of noise metrics mimics the calculation of noise metrics in the noise exposure instruments through digital audio processing implemented in the code of the SLM apps. The calculation of the noise metrics in SLM apps is rarely detailed in commercial apps. The open source code source of the NoiseTube app, Stevens (2012), and WideNoise app, WideTag (2014) allow one to analyze in detail the noise calculation algorithms used.
The audio decoder component process the signal from the A/D converter. The filter component implements the A and C frequency weighting (Annex II). The filters used in the NoiseTube app