with a model-based sensor
Thomas Desaive*, Bernard Lambermont*, Alexandre Ghuysen*, Philippe Kolh*, Philippe Morimont*, Pierre C. Dauby*, Christina Starfinger**,
Christopher E. Hann**, Geoffrey M. Shaw***, J. Geoffrey Chase**
* Cardiovascular Research Center, University of Liege, Liege, Belgium (E-mail: [email protected]) **Center of Bioengineering, University of Canterbury, Christchurch, New Zealand
**Department of Intensive Care Medicine, Christchurch Hospital, Christchurch, New Zealand
Abstract: Estimation of ventricular contractility is clinically important in diagnosing cardiac dysfunction in the critically ill. However, experimental assessment of indexes of ventricular contractility, such as the end-systolic pressure-volume relationship requires a highly invasive maneuver. This research describes the use of a previously validated cardiovascular system (CVS) model and identification process to evaluate the right-ventricle contractility as well as the right ventricular arterial coupling in septic shock. The results show good agreement with the gold-standard experimental assessment (conductance catheter method), and offer the potential to develop a model-based sensor to monitor the coupling in clinical real-time.
Keywords: Cardiovascular, Model, Intensive Care, Sensor, ventricular function, ICU, sepsis
1. INTRODUCTION
When trying to assess ventricular systolic function, the estimation of ventricular contractility is known to be one of the key steps. Determination of ventricular function and contractility are clinically important in assessing and diagnosing cardiac and circulation dysfunction in critically ill patients. In particular, the differential diagnosis of septic shock, different from other causes of reduced cardiac output, is time critical and plays a major role in therapeutic decision making. Hence, such assessments can play a crucial role in the management of the critically ill.
Experimentally, the conductance catheter method allows for the determination of indexes of ventricular contractility, such as the end-systolic pressure-volume relationship (ESPVR). This method requires the recording of several pressure-volume loops during an induced preload reduction (caval occlusion), which is a highly invasive maneuver that disturbs the circulation further and would not be readily performed at the bedside for diagnostic purposes. It is easily seen that this procedure raises significant ethical and medical concerns. Attempts to bypass the preload reduction have been suggested, such as "single-beat" methods (Brimioulle et al., 2003), to avoid this potential risk. However, these studies are not completely reliable as they failed to detect the (known) contractility modifications induced by pharmacologic interventions (Lambermont et al., 2004).
♦ This work was supported by the FNRS (Belgium), the Univ
of Canterbury, the French Community of Belgium (Actions de Recherches Concertées – Académie Wallonie-Europe).
Hence, an accurate replacement measure that is not further invasive would have clinically significant value.
Recently, mathematical models of the cardiovascular system (CVS) have been developed to assist medical professionals in differentiating and diagnosing CVS disturbances, such as pulmonary embolism, changes in positive end expiratory pressure (PEEP) or septic shock (Desaive et al., 2008, Starfinger et al., 2008b, Starfinger et al., 2008d, Starfinger et al., 2008c, Starfinger et al., 2007). These CVS models were able to capture all the fundamental CVS pressure and volume values and trends when compared to measured experimental data. The goal is to use the models and readily available clinical measurements to enable non-invasive patient specific monitoring and diagnosis.
The specific aim of this study is to use this previously described CVS model and identification process (Desaive et al., 2008, Starfinger et al., 2008b, Starfinger et al., 2008d, Starfinger et al., 2008c) to estimate the right ventricular contractility and the right ventricular-arterial coupling. Animal model data is used from a previously published porcine experiment of induced septic shock combined with continuous veno-venous hemofiltration (CVVH) therapy, which thus includes both septic shock and therapeutic dynamics (Lambermont et al., 2006). Hence, this article compares a gold-standard clinical assessment (conductance catheter method) to a non-invasive model-based method. This model-based approach offers a potentially reliable procedure to assess the right ventricle (RV) contractility, as well as the right ventricular-arterial coupling. This method thus opens up a new way to estimate the right ventricle systolic function in humans due to its preload independence.
Equally importantly, it offers the potential to develop a model-based sensor to monitor this metric in clinical real-time and thus use it in determining therapy, using only readily available clinical data.
2. MATERIALS AND METHODS
All experimental procedures and protocols used in this investigation were reviewed and approved by the Ethics Committee of the Medical Faculty of the University of Liege. They were performed in accordance with the Guide for the Care and Use of Laboratory Animals as adopted and promulgated by the U.S. National Institutes of Health (NIH Publication No.85-23, revised 1996). The surgical preparation and experimental protocol are described in (Lambermont et al., 2006) with relevant details repeated here.
2.1 Experimental protocol and physiological measurements
Experiments were performed on 6 healthy pure pietran pigs of either sex weighing from 20 to 30kg. The animals were premedicated and anesthetized as described previously (Lambermont et al., 2006). A micromanometer-tipped catheter (Sentron pressure-measuring catheter, Cordis, Miami, FL, U.S.A.) was inserted into the main pulmonary artery and a 14-mm diameter perivascular flow probe (Transonic Systems, Ithaca, NY, U.S.A.) was adjusted around the main pulmonary artery 2 cm downstream of the pulmonary valve. Left atrial pressure was measured with a micromanometer-tipped catheter and systemic blood pressure was monitored with a micromanometer-tipped catheter inserted into the descending thoracic aorta through the left femoral artery. A 7F, 12-electrode (8-mm interelectrode distance) conductance micromanometer-tipped catheter (CD Leycom, Zoetermeer, The Netherlands) was inserted through the RV infundibulum into the right ventricle and positioned so that all electrodes were in the RV cavity. A 6F Fogarty balloon catheter (Baxter Healthcare Corp., Oakland, Calif) was advanced into the inferior vena cava through a right femoral venotomy. Inflation of this balloon produced gradual preload reduction.
After a 30 min stabilization period, the animals received a 0.5mg/kg endotoxin infusion (Lipopolysaccharide from Escherichia Coli serotype 0127:B8; Sigma Chemical, St Louis, MO, USA) over a 30 min period (from T0 to T30). They underwent, from T60 onwards, a zero-balance continuous veno-venous hemofiltration at a rate of 45ml/kg/h. A 0.7m2 large pore (78 Å) membrane with a cutoff of 80kDa (Sureflux FH 70, Nipro, Osaka, Japan) and a hemofiltration device Baxter BM 25-BM 14 (Baxter Health Care, Munich, Germany) were used. Ultrafiltrate was replaced in the postdilution mode by a bicarbonate-buffered hemofiltration fluid (Na+: 150mM, K+: 3mM, bicarbonate: 30mM) at a temperature of 37°C.
Hemodynamic data included pulmonary artery pressure (PAP) wave, pulmonary blood flow wave, left atrial pressure, systemic arterial pressure, heart rate, RV pressure, RV volume and RV pressure-volume (PV) loops. These parameters were monitored online and recorded every 30 minutes from T0 to T240 during a short apneic phase and
stored for subsequent analysis. All analog signals were sampled at 200 Hz and continuously converted to digital form with an appropriate system (Codas, DataQ Instruments Inc., Akron, OH, USA).
2.2 Data analysis
A four-element windkessel model (WK4) was used to analyze the flow conditions in the pulmonary circulation throughout the experimental process. In this model (Figure 1), a resistor (R2) represents the resistive properties of the
pulmonary vasculature. A capacitor (C) is placed parallel to R2 and describes the compliant properties of the pulmonary
arterial tree. A second resistor (R1) is placed at the input of
the circuit and reflects the characteristic impedance of the proximal pulmonary stem. Finally, an inductance (L) is added in series to accounts for the inertial properties of the blood.
Fig. 1. The four-elements windkessel model (WK4)
The arterial elastance (𝐸𝑎𝐸𝑥𝑝), which reflects RV afterload, was calculated from the WK4 parameters with the formula (Sunagawa et al., 1984):
𝐸𝑎𝐸𝑥𝑝= (𝑅1+ 𝑅2)/[𝑇𝑠+ 𝑅2𝐶(1 − 𝑒−𝑇𝑑/𝑅2𝐶)] (1)
where Ts and Td are respectively the systolic and diastolic
intervals, while R1, R2 and C can be estimated using a
classical, well accepted procedure described previously (Lambermont et al., 1999).
Right ventricular PV loops were obtained using the conductance catheter method. The RV end-systolic elastance (𝐸𝑒𝑠𝐸𝑥𝑝) was determined during a rapid inferior vena cava occlusion maneuver (Dickstein et al., 1995). Preload was reduced by progressive inflation of the Fogarty balloon in the inferior vena cava for no more than 10s to avoid the intervention of a baroreflex mechanism. End-systolic PV relationship was determined by fitting a straight line through the end-systolic PV points.
To assess the right ventricular-arterial coupling, the 𝐸𝑒𝑠𝐸𝑥𝑝/
𝐸𝑎𝐸𝑥𝑝 ratio was computed. Under normal operating
conditions, the right ventricle operates at a maximum efficiency and a submaximal stroke work (𝐸𝑒𝑠𝐸𝑥𝑝/(𝐸𝑎𝐸𝑥𝑝 > 1), while uncoupling occurs when 𝐸𝑒𝑠𝐸𝑥𝑝/𝐸𝑎𝐸𝑥𝑝 < 1 (Fourie et al., 1992, Lambermont et al., 2003a).
2.4 CVS Model
The CVS model is a lumped parameter model of 6-8 elastic chambers with two active chambers for the left and right ventricles. The original model has been extended recently (Desaive et al., 2008, Smith et al., 2004, Smith et al., 2006,
Starfinger et al., 2008a, Starfinger et al., 2008d, Starfinger et al., 2008c) and an overview of the 8 chambers version used in this research is given in Figure 2. Each chamber is characterized by the flow in and out of the chamber, the pressure up- and downstream, the resistances of the heart valves, and inertia of the blood.
Fig. 2. Extended CVS model overview.
The CVS model uses the classical concept of time varying elastance proposed by Suga et al. (Suga et al., 1973) to simulate the cardiac muscle activation. More specifically, the upper and lower limits of the elastance are defined by the systolic pressure–volume relationship (ESPVR) and end-diastolic pressure–volume relationship (EDPVR) (Burkhoff et al., 1988). By combining the ESPVR and EDPVR an equation relating the ventricular pressure (P) to the ventricular volume (V):
𝑃 = 𝑒(𝑡)𝐸𝑒𝑠𝑟𝑣𝑓(𝑉 − 𝑉𝑑) + �1 − 𝑒(𝑡)�𝑃0(𝑒𝜆(𝑉−𝑉0)− 1) (2)
where P0, V0 and λ are respectively, the pressure gradient and
the volume at zero pressure and the curvature, while Eesrvf is
the RV end-systolic elastance and e(t) is the activation
function (Figure 3) that accounts for ventricular activation (Smith et al., 2004, Smith et al., 2006).
Fig. 3. Plot of the activation function e(t).
The pulmonary artery is also described by a simple pressure-volume relationship:
𝑃𝑝𝑎 = 𝐸𝑝𝑎𝑉𝑝𝑎 (3)
where Ppa and Vpa denote the pulmonary artery pressure and
volume respectively. Epa is the arterial elastance. Using
Equations 2 and 3, the identified right-ventricular coupling can be computed as the ratio 𝐸𝑒𝑠𝑟𝑣𝑓/𝐸𝑝𝑎 .
2.5 Integral-based parameter identification
The parameter identification method used in this research has already been shown to rapidly and accurately identify virtually the entire parameter set in the presence of significant measurement noise (Desaive et al., 2008, Hann et al., 2006, Starfinger et al., 2008a, Starfinger et al., 2008d, Starfinger et al., 2008c) and limited measurements (Hann et al., 2009, Hann et al., 2010). It has been successfully tested on experimental animal models of pulmonary embolism (Starfinger et al., 2007), PEEP titrations and volume therapy decision support (Starfinger et al., 2008d, Starfinger et al., 2008c), and septic shock experiments (Desaive et al., 2008, Starfinger et al., 2008b).
During the identification process only the systolic and diastolic values of both ventricles volumes, as well as pressure in the aorta and in the pulmonary artery are used. It is important to note that in this study it was not intended to perfectly match the pressure and volume waveform shapes, but only the minimum (diastolic) and maximum (systolic) values. Hence, it seeks to capture the primary, clinically relevant dynamics for decision support at the bedside, rather than a potentially more perfect physiological picture. Furthermore, important improvements of the identification process have been made recently. In particular, the maximum and minimum volumes are no longer required, while maintaining the same level of identification and diagnostic trend accuracy reported in the prior studies cited (Hann et al., 2009, Hann et al., 2010).
In this model-based approach, the elastance defined in Equation 2 (𝐸𝑒𝑠𝑟𝑣𝑓) is directly identified from the experimental data using the model and the identification
method. The arterial compliance (Cpa) and consequently the
arterial elastance (Epa) in Equation 3 is evaluated from
experimental data with the classical approximation (Chemla et al., 1998, Zhu et al., 1995)
𝐸𝑝𝑎= 1/𝐶𝑝𝑎 =𝑃𝑃𝑆𝑉𝑎 (4)
where PPa denotes the artery pulse pressure and SV the stroke
volume.
The arterial elastance calculated from the Windkessel model's parameters (𝐸𝑎𝐸𝑥𝑝) reflects the afterload. In the model, two parameters may capture this effect. First Epa defined in
equation 4. However, truer to the situation, the mean pulmonary inflow resistance (Rpulin) identified with the model-based identification process, captures this effect as well (Lankhaar et al., 2006, Lankhaar et al., 2008). Moreover, as it is identified from the data, it may better represent the afterload for each subject compared to the approximation in Equation 4.
Hence, this study examines both a non-invasive model-based measure for (𝐸𝑒𝑠𝐸𝑥𝑝/𝐸𝑎𝐸𝑥𝑝 ), comparing both 𝐸𝑒𝑠𝑟𝑣𝑓/𝐸𝑝𝑎 and 𝐸𝑒𝑠𝑟𝑣𝑓/𝑅𝑝𝑢𝑙𝑖𝑛. The goal is to obtain a non-invasive measure
that best captures the gold-standard measure, and is also physiologically representative or relevant. In this case, there are thus two possibilities based on the physiology and how the model captures and approximates those physiological dynamics.
3. RESULTS
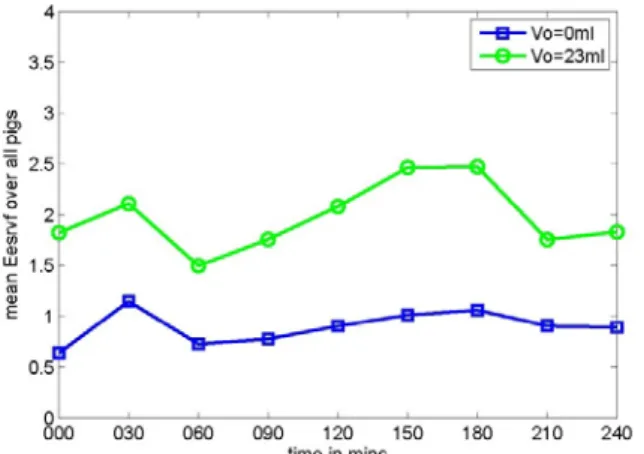
Figure 4 shows the mean (model-based) right ventricle end-systolic elastance (𝐸𝑒𝑠𝑟𝑣𝑓
)
over all pigs during the experiment. This elastance is identified during the identification process and the value depends on the assumed volume at zero pressure (V0) for the ventricle used in themodel. For reasons of simplicity, this value is assumed to be zero (V0 =0 ml) during the identification. However, 𝐸𝑒𝑠𝑟𝑣𝑓
can easily be adjusted for a different and probably more realistic V0 as can be seen in Figure 4 where 𝐸𝑒𝑠𝑟𝑣𝑓 is
depicted for V0 =0 ml and V0 =23 ml, which spans a realistic
range.
Fig. 4. Mean identified right ventricle elastance (𝐸𝑒𝑠𝑟𝑣𝑓) for all 5 analyzed pigs during the endotoxic shock experiment
These identified 𝐸𝑒𝑠𝑟𝑣𝑓 are compared with previously reported values obtained for the same experimental data (Lambermont et al., 2006). Figure 5 shows that the values and the resulting correlation trends match well (R2 = 0.69) with a trend line defined: 𝐸𝑒𝑠𝐸𝑥𝑝 = 0.22 ∗ 𝐸𝑒𝑠𝑟𝑣𝑓+ 0.45. This line does not pass through the origin probably due to experimental errors on 𝐸𝑒𝑠𝐸𝑥𝑝 and no identification of V0 from
the data.
Fig. 5. Experimental vs simulated elastance for all 5 analyzed pigs during the endotoxic shock experiment.
To compare the right ventricular-arterial coupling, we computed the identified coupling with 𝐸𝑒𝑠𝑟𝑣𝑓/𝐸𝑝𝑎 . Even if the simulated and experimental elastances match accurately, we found a very poor correlation for the coupling (R2 = 0.04). For the 𝐸𝑒𝑠𝑟𝑣𝑓/𝑅𝑝𝑢𝑙𝑖𝑛 estimate, Figure 6 shows the time evolution of Rpulin and 𝐸𝑎𝐸𝑥𝑝 . Both trends match closely.
Fig. 6. Rpulin and 𝐸𝑎𝐸𝑥𝑝 for all 5 analyzed pigs during the endotoxic shock experiment.
Figure 7 shows the RV-vascular coupling using 𝐸𝑒𝑠𝑟𝑣𝑓/ 𝑅𝑝𝑢𝑙𝑖𝑛 during the endotoxic shock experiment as a further marker of the impact of sepsis. Furthermore, there is an improved correlation (R2 = 0.37) between the new identified coupling metric and the experimental coupling
.
4. DISCUSSION
The major findings of this research are twofold. First, the results that were obtained previously (Lambermont et al., 2006) are confirmed using the extended CVS model and parameter identification process. In Figure 7 it can be seen how hemofiltration, which starts at 60 min into the experiment, is able to prevent RV-vascular uncoupling (ratio
< 1.0). This effect or behaviour is commonly observed during the late phases of endotoxic shock (Lambermont et al., 2003b).
Figure 7: Mean experimental ( 𝐸𝑒𝑠𝑟𝑣𝑓/𝐸𝑝𝑎 ) and identified (𝐸𝑒𝑠𝑟𝑣𝑓/𝑅𝑝𝑢𝑙𝑖𝑛) right ventricular-arterial coupling as a function of time for all pigs.
In particular, the data shows that in the early phases of endotoxic shock, RV-vascular coupling is preserved by an increase in RV contractility (𝐸𝑒𝑠𝑟𝑣𝑓) as seen in Figure 4. During the later stages and with CVVH, RV-vascular coupling is preserved where a decrease in pulmonary vascular resistance (Rpulin), as seen in Figure 6, is suggested to be the main reason for this result (Lambermont et al., 2006). These results allow for a better understanding of the mechanisms of RV dysfunction during septic shock and thus have the potential to lead to more effective therapies and strategies for treating myocardial depression in septic shock. Second, the results of this research present an important clinical outcome. They show that it is possible to relatively accurately calculate the right ventricular-arterial coupling without the need of an invasive preload reduction by doing this model-based approach. As mentioned previously, the assessment of RV contractility requires the occlusion of the vena cava which raises obvious ethical and medical concerns. This model-based approach uses only a clinically realistic and minimal data set.
The RV end-systolic elastance is directly identified from the model and the available experimental data. Using only minimum and maximum values of arterial pressure and ventricular volume, the identification process gives an accurate measure of the elastance. Moreover, using the pulmonary resistance (Rpulin) to characterize the RV afterload, there is no need to evaluate the arterial elastance by means of the parameters of the windkessel model, which has the main drawback of needing accurate pressure and flow waveforms (Lambermont et al., 1998).
Although a good correlation was found between the experimental and the identified measures of the preload and the afterload, the resulting ratio assessing ventricular-arterial coupling shows a comparatively poor correlation. As it is defined by the ratio of the preload to the afterload, there can be a propagation of the experimental errors. However, defining the RV ventricular-arterial coupling with the model-based Rpulin value and ratio defined, 𝐸𝑒𝑠𝑟𝑣𝑓/𝑅𝑝𝑢𝑙𝑖𝑛, a good
agreement is found with the data from (Lambermont et al.,
2006), but with a significantly smaller data set and no preload reduction.
This outcome shows the importance to use patient-specific identified parameters instead of parameters estimated from the experimental data. This model-based approach thus offers potentially a new and more reliable procedure to assess the right ventricle contractility, as well as the right ventricular-arterial coupling. It also defines a new model-based metric (𝐸𝑒𝑠𝑟𝑣𝑓/𝑅𝑝𝑢𝑙𝑖𝑛) that should be able, with adequate calibration, to monitor coupling in clinical real-time and thus be used in determining therapy. In particular, because every element of this new metric is available at the bedside and can be assessed effectively continuously, it is a metric that can be used at any point in time the clinician wishes to assess, diagnose, and monitor patient condition.
5. CONCLUSIONS
This study shows the ability of the CVS model to adequately and realistically capture the impact of pressure-volume changes during endotoxic shock and with CVVH. Comparable results to previously reported studies are obtained when analyzing the RV-vascular coupling, further validating the here presented methods and approach. This research thus increases our confidence in the clinical applicability and validity of this overall diagnostic monitoring approach.
REFERENCES
Brimioulle, S., Wauthy, P., Ewalenko, P., Rondelet, B. t., Vermeulen, F. o., Kerbaul, F. o. & Naeije, R. 2003. Single-beat estimation of right ventricular end-systolic pressure-volume relationship. Am J Physiol Heart Circ
Physiol, 284, H1625--H1630.
Burkhoff, D., Alexander, J., Jr. & Schipke, J. 1988. Assessment of Windkessel as a model of aortic input impedance. Am J Physiol, 255, H742-53.
Chemla, D., Hebert, J. L., Coirault, C., Zamani, K., Suard, I., Colin, P. & Lecarpentier, Y. 1998. Total arterial compliance estimated by stroke volume-to-aortic pulse pressure ratio in humans. Am J Physiol, 274, H500--H505.
Desaive, T., Lambermont, B., Ghuysen, A., Kolh, P., Dauby, P. C., Starfinger, C., Hann, C. E., Chase, J. G. & Shaw, G. M. 2008. Cardiovascular Modelling and Identification in Septic Shock - Experimental validation.
Proceedings of the 17th IFAC World Congress July 6-11, 2008, Seoul, Korea.
Dickstein, M. L., Yano, O., Spotnitz, H. M. & Burkhoff, D. 1995. Assessment of right ventricular contractile state with the conductance catheter technique in the pig.
Cardiovasc Res, 29, 820-6.
Fourie, P. R., Coetzee, A. R. & Bolliger, C. T. 1992. Pulmonary artery compliance: its role in right ventricular-arterial coupling. Cardiovasc Res, 26, 839--844.
Hann, C. E., Chase, J. G., Desaive, T., Froissart, C. B., Revie, J., Stevenson, D., Lambermont, B., Ghuysen, A., Kolh, P. & Shaw, G. M. Year. Robust parameter identication for model-based cardiac diagnosis in critical care. In: 7th IFAC Symposium on Modelling and Control in Biomedical Systems, 2009 Aalborg, Denmark.
Hann, C. E., Chase, J. G., Desaive, T., Froissart, C. B., Revie, J., Stevenson, D., Lambermont, B., Ghuysen, A., Kolh, P. & Shaw, G. M. 2010. Unique parameter identification for cardiac diagnosis in critical care using minimal data sets. Comput Methods Programs Biomed. Hann, C. E., Chase, J. G. & Shaw, G. M. 2006.
Integral-based identification of patient specific parameters for a minimal cardiac model. Comput Methods Programs
Biomed, 81, 181--192.
Lambermont, B., D'Orio, V., Gerard, P., Kolh, P., Detry, O. & Marcelle, R. 1998. Time domain method to identify simultaneously parameters of the windkessel model applied to the pulmonary circulation. Arch Physiol
Biochem, 106, 245-52.
Lambermont, B., Delanaye, P., Dogne, J. M., Ghuysen, A., Janssen, N., Dubois, B., Desaive, T., Kolh, P., D'Orio, V. & Krzesinski, J. M. 2006. Large-pore membrane hemofiltration increases cytokine clearance and improves right ventricular-vascular coupling during endotoxic shock in pigs. Artif Organs, 30, 560-4.
Lambermont, B., Kolh, P., Detry, O., Gerard, P., Marcelle, R. & D'Orio, V. 1999. Analysis of endotoxin effects on the intact pulmonary circulation. Cardiovasc Res, 41, 275-81.
Lambermont, B., Kolh, P., Dogne, J. M., Ghuysen, A., Tchana-Sato, V., Morimont, P., Benoit, P., Gerard, P., Masereel, B., Limet, R. & D'Orio, V. 2003a. Effects of U-46619 on pulmonary hemodynamics before and after administration of BM-573, a novel thromboxane A2 inhibitor. Arch Physiol Biochem, 111, 217-23.
Lambermont, B., Kolh, P., Ghuysen, A., Moonen, M., Morimont, P., Gerard, P., Tchana-Sato, V., Rorive, G. & D'Orio, V. 2003b. Effect of hemodiafiltration on pulmonary hemodynamics in endotoxic shock. Artif
Organs, 27, 1128-33.
Lambermont, B., Segers, P., Ghuysen, A., Tchana-Sato, V., Morimont, P., Dogne, J. M., Kolh, P., Gerard, P. & D'Orio, V. 2004. Comparison between single-beat and multiple-beat methods for estimation of right ventricular contractility. Crit Care Med, 32, 1886-90.
Lankhaar, J.-W., Westerhof, N., Faes, T. J. C., Marques, K. M. J., Marcus, J. T., Postmus, P. E. & Vonk-Noordegraaf, A. 2006. Quantification of right ventricular afterload in patients with and without pulmonary hypertension. Am J Physiol Heart Circ
Physiol, 291, H1731-1737.
Lankhaar, J.-W., Westerhof, N., Faes, T. J. C., Tji-Joong Gan, C., Marques, K. M., Boonstra, A., van den Berg, F. G., Postmus, P. E. & Vonk-Noordegraaf, A. 2008.
Pulmonary vascular resistance and compliance stay inversely related during treatment of pulmonary hypertension. Eur Heart J, 29, 1688-1695.
Smith, B. W., Chase, J. G., Nokes, R. I., Shaw, G. M. & Wake, G. 2004. Minimal haemodynamic system model including ventricular interaction and valve dynamics.
Medical Engineering \& Physics, 26, 131-139.
Smith, B. W., Chase, J. G., Shaw, G. M. & Nokes, R. I. 2006. Simulating transient ventricular interaction using a minimal cardiovascular system model. Physiol Meas, 27, 165--179.
Starfinger, C., Chase, J. G., Hann, C. E. & Shaw, G. M. 2008a. Simulating the patient-specific adrenaline dose response using a cardiovascular system model.
Cardiovascular Engineering.
Starfinger, C., Chase, J. G., Hann, C. E., Shaw, G. M., Lambermont, B., Ghuysen, A., Kolh, P., Dauby, P. C. & Desaive, T. 2008b. Model-based identification and diagnosis of a porcine model of induced endotoxic shock with hemofiltration. Math Biosci, 216, 132--139. Starfinger, C., Chase, J. G., Hann, C. E., Shaw, G. M.,
Lambert, P., Smith, B. W., Sloth, E., Larsson, A., Andreassen, S. & Rees, S. 2008c. Model-based identification of PEEP titrations during different volemic levels. Comput Methods Programs Biomed, 91, 135--144.
Starfinger, C., Chase, J. G., Hann, C. E., Shaw, G. M., Lambert, P., Smith, B. W., Sloth, E., Larsson, A., Andreassen, S. & Rees, S. 2008d. Prediction of hemodynamic changes towards PEEP titrations at different volemic levels using a minimal cardiovascular model. Comput Methods Programs Biomed, 91, 128--134.
Starfinger, C., Hann, C. E., Chase, J. G., Desaive, T., Ghuysen, A. & Shaw, G. M. 2007. Model-based cardiac diagnosis of pulmonary embolism. Comput Methods
Programs Biomed, 87, 46--60.
Suga, H., Sagawa, K. & Shoukas, A. A. 1973. Load independence of the instantaneous pressure-volume ratio of the canine left ventricle and effects of epinephrine and heart rate on the ratio. Circ Res, 32, 314-22.
Sunagawa, K., Sagawa, K. & Maughan, W. L. 1984. Ventricular interaction with the loading system. Ann
Biomed Eng, 12, 163-89.
Zhu, Y., Dai, J. & Li, J. K.-J. 1995. Total systemic arterial compliance: evaluation of time and frequency domain methods. Bioengineering Conference, Proceedings of