Two Novel Equations to Estimate Kidney Function in Persons Aged 70
Years or Older
Elke S. Schaeffner*,1, Natalie Ebert*,1, Pierre Delanaye2, Ulrich Frei1, Jens Gaedeke3, Olga Jakob4, Martin K. Kuhlmann5, Mirjam Schuchardt6, Markus Tölle6, Reinhard Ziebig7, Markus van der Giet6, and Peter Martus8 1 Division of Nephrology and Intensive Care Medicine, Charité Campus Virchow, Augustenburger Platz 1, 13353 Berlin, Germany. 2 Department of Nephrology-Dialysis-Transplantation, University of Liège, Centre Hospitalier Universitaire du Sart-Tilman, 4000 Liège, Belgium.
3 Division of Nephrology, Charité Campus Mitte, Charité-platz 1, 10117 Berlin, Germany.
4 Institute for Biostatistics and Clinical Epidemiology, Charité Campus Benjamin Franklin, Hindenburgdamm 30, 12203 Berlin, Germany. 5 Department of Nephrology, Vivantes Klinikum im Friedrichshain, Landsberger Allee 49, 10249 Berlin, Germany.
6 Division of Nephrology and Endocrinology, Charité Campus Benjamin Franklin, Hindenburgdamm 30, 12203 Berlin, Germany. 7
Campus Virchow, Augustenburger Platz 1, 13353 Berlin, Germany.
8 Institute of Medical Biostatistics, Eberhard Karls University Tubingen, Silcherstrasse 5, 72078 Tubingen.
Abstract
Background: In older adults, current equations to estimate glomerular filtration rate (GFR) are not validated and may misclassify elderly persons in terms of their stage of chronic kidney disease.
Objective: To derive the Berlin Initiative Study (BIS) equation, a novel estimator of GFR in elderly participants. Design: Cross-sectional. Data were split for analysis into 2 sets for equation development and internal
validation.
Setting: Random community-based population of a large insurance company. Participants: 610 participants aged 70 years or older (mean age, 78.5 years). Intervention: lohexol plasma clearance measurement as gold standard.
Measurements: GFR, measured as the plasma clearance of the endogenous marker iohexol, to compare performance of existing equations of estimated GFR with measured GFR of the gold standard; estimation of measured GFR from standardized creatinine and cystatin C levels, sex, and age in the learning sample; and comparison of the BIS equations (BIS1: creatinine-based; BIS2: creatinine- and cystatin C-based) with other estimating equations and determination of bias, precision, and accuracy in the validation sample.
Results: The new BIS2 equation yielded the smallest bias followed by the creatinine-based BIS1 and Cockcroft-Gault equations. All other equations considerably overestimated GFR. The BIS equations confirmed a high prevalence of persons older than 70 years with a GFR less than 60 mL/min per 1.73 m2 (BIS1, 50.4%; BIS2, 47.4%; measured GFR, 47.9%). The total misclassification rate for this criterion was smallest for the BIS2 equation (11.6%), followed by the cystatin C equation 2 (15.1%) proposed by the Chronic Kidney Disease Epidemiology Collaboration. Among the creatinine-based equations, BIS1 had the smallest misclassification rate (17.2%), followed by the Chronic Kidney Disease Epidemiology Collaboration equation (20.4%).
Limitation: There was no validation by an external data set.
Conclusion: The BIS2 equation should be used to estimate GFR in persons aged 70 years or older with normal or mild to moderately reduced kidney function. If cystatin C is not available, the BIS1 equation is an acceptable alternative.
Primary Funding Source: Kuratorium für Dialyse und Nierentransplatation (KfH) Foundation of Preventive Medicine.
Context
Accurate assessment of kidney function is important for appropriate clinical care. However, most currently used estimates of creatinine clearance were not developed in populations of older adults.
Contribution
Two estimates of glomerular filtration rate (GFR) were developed and validated in a study population of adults aged 70 years or older: 1 based on creatinine only and 1 based on both creatinine and cystatin C measurements. Both showed excellent agreement with directly measured GFR.
Caution
The study was cross-sectional. Only white participants with normal to moderately decreased kidney function were included.
Implication
Two newly developed estimates of GFR may provide more accurate assessment of kidney function in older adults.
—The Editors
Chronic kidney disease (CKD) has increasingly been considered a research and public health priority, with even some discussion of a silent epidemic (1). The initiation of an automatic reporting of the glomerular filtration rate (GFR), the best indicator of kidney function (2), has led to an increase in nephrology referrals, especially among persons identified with only mild to moderately reduced kidney function (GFR, 30 to 59 mL/min per 1.73 m2) (3). This is especially true for older adults, in whom prevalence rates vary in the literature between one third and nearly one half of the general population (4-9), impressive numbers that have raised controversy among experts about the clinical relevance of the CKD diagnosis in this age group. The debate has been heated by the fact that few data exist about normal kidney function in elderly persons (10). The pure assessment of creatinine-based GFR in the elderly is already problematic: Neither the Cockcroft-Gault (11) nor the 2 most frequently used estimating equations, the Modification of Diet in Renal Disease (MDRD) study equation (12) and the Chronic Kidney Disease Epidemiology (CKD-EPI) Collaboration equation (13), were developed in older adults, although the latter incorporated approximately 650 participants in this age group. These equations are based on serum creatinine levels, which are influenced by alterations in muscle mass and dietary protein intake as well as by chronic disease (common conditions in older adults). Equations based on cystatin C, an alternative marker of GFR, may be advantageous at older ages (14-16). However, validation studies using a reference method against a gold standard to measure GFR are scarce. Elderly persons have generally been underrepresented—even in large cross-sectional data sets of equation development for GFR (12, 13, 17, 18)—and the need for an age-adapted equation has been stated repeatedly (19-22).
Accurate assessment of kidney function has several clinical implications, such as adequate adjustment of drug dosing, improved decision making in imaging testing, help in the timing of initiation of renal replacement therapy, evaluation for kidney donation, and the psychological and financial aspect of wrongly labeling someone as having CKD.
The goal of the Berlin Initiative Study (BIS) was to assess kidney function in an elderly population-based cohort by comparing existing equations with a gold standard measurement and to derive a novel estimating equation that would estimate GFR more correctly in persons aged 70 years or older. This is clinically relevant because it would lead to less misclassification of persons with either GFR of 60 mL/min per 1.73 m2 or greater or GFR less than 60 mL/min per 1.73 m2.
METHODS Study Design
The study is a cross-sectional subsample (n = 610) of a longitudinal population-based elderly cohort, the BIS cohort (n = 2073), that finished recruitment in June 2011. The primary goal of this study was to assess exact GFR by iohexol clearance measurement in 600 participants. A detailed description of the study design can be found elsewhere (23). The study was approved by the local ethics committee, and every participant gave written informed consent.
Study Sample
Participants had one of the largest German statutory health insurance (AOK Nordost-Die Gesundheitskasse), all living in Berlin and aged 70 years or older. Exclusion criteria included being younger than 70 years, having different health insurance, and receiving dialysis or a kidney transplant. The baseline visit included a
blood and urine samples. At the baseline visit, persons were also offered a second appointment for exact GFR measurement by means of iohexol clearance. Characteristics of the entire BIS study cohort can be found in Appendix Table 1 (available at www.annals.org).
Examination Protocol of Iohexol Measurement
Participants had to fast for 4 hours before the procedure, and persons with diabetes fasted for 2 hours. They were given exact instructions about food, beverages, and medication that were not allowed on the morning of the examination (coffee, black or green tea, protein-containing food, or nonsteroidal anti-inflammatory drugs). All clearance measurements were started between 8:00 and 10:30 a.m. If a protocol violation occurred, the procedure was rescheduled. Participants with a thyroid-stimulating hormone level less than 0.3 mIU/L or a known iodine allergy were excluded. At the study visit, height, weight, waist-hip ratio, and vital signs were determined. Height was assessed with a wall-mounted stadiometer, weight with a digital scale, and waist and hip circumferences with a 2-meter nonstretch flexible tape. Blood samples for serum creatinine and cystatin C were obtained before iohexol was applied.
Iohexol solution 5 mL, containing 3235 mg of iohexol (Accupaque, GE Healthcare Buchler, Braunschweig, Germany), was administered intravenously into an antecubital, forearm, or hand vein and flushed with 10 mL of normal saline. Blood samples were obtained from the contralateral arm at 30, 60, 90, 120, 150, 180, 240, and 300 minutes after injection. Samples were centrifuged for 10 minutes at 1500 revolutions per minute within 2 hours of collection and transported on dry ice to be stored at -80 °C until further analysis. All 610 iohexol clearance measurements were done at Charité University Hospital (Berlin, Germany) by the same thoroughly trained staff.
Laboratory Methods
Iohexol Samples
Within 7 days, samples were assayed by high-performance liquid chromatography (HPLC). This analysis of the supernatant was done on an HPLC system with a diode-array detector (Hitachi, Mannheim, Germany) and a Chromolith performance HPLC column (RP-18e [100 × 4.6 mm], Merck, Darmstadt, Germany) and a
Chromolith guard-column (RP-18e [5 × 4.6 mm], Merck) (24, 25). Glomerular filtration rate was calculated with the clearance computed from the amount of the marker administered and the area under the receiver-operating characteristic curve of plasma concentration versus time. This was estimated by using a 2-compartment model with early (3 time points until 90 minutes for the fast component) and late (5 time points from 120 minutes onward for the slow component) blood sampling (25). Advantages of iohexol include feasibility, especially in older adults, stability in biological fluids, lack of radioactivity, and rare adverse reactions when given in small doses (when assayed with a sensitive HPLC assay) (26-29). Studies have confirmed the agreement of GFR measurements obtained by this method with those obtained by inulin (26, 30) and Cr-ethylenediaminetetraacetic acid clearance (29, 31). External quality control was provided by Equalis (Uppsala, Sweden).
Other Blood Measures
All serum creatinine samples were analyzed in the same laboratory (Synlab MVZ Heidelberg, Eppelheim, Germany) using the isotope dilution mass spectrometry-traceable enzymatic method (CREA Plus, Roche Diagnostics, Mannheim, Germany) on a Roche modular analyzer P-Module. The interassay coefficients of variation for serum creatinine were 2.3% and 3.4% at mean concentrations of 87.52 µmol/L (0.99 mg/dL) and 331.5 µmol/L (3.75 mg/dL), respectively.
Cystatin C samples were sent to the Charité laboratory, Labor Berlin, and measured using a particle-enhanced nephelometric assay on the BN ProSpec nephelometer (Siemens Healthcare Diagnostics, formerly Dade-Behring, Marburg, Germany). The interassay coefficients of variation for serum cystatin C levels were 1.5%, 3.5%, and 2.4% at mean concentrations of 0.8, 2.3, and 7.4 mg/L, respectively. The manufacturer's reference interval for healthy participants is 0.59 to 1.05 mg/L (after restandardization of cystatin C according to ERM-DA471/IFCC for BN systems). Calibration allows for better comparability between laboratories (32, 33). The particle-enhanced nephelometric assay ERM-DA471/IFCC-traceable cystatin C assay has been available since 2010 and minimizes the variations in the cystatin C calibrators and harmonizes the methods for the
determination of cystatin C concentrations (34). This automated assay is currently known to be the most precise across a wide range of values (35). All cystatin C samples were frozen at -80 °C and analyzed within 4 days in December 2011. Cystatin C is stable at -80 °C (36).
Construction and Validation of the New Equations
Four variables of specific interest were chosen in advance (age, sex, serum creatinine, and serum cystatin C), suggested by existing equations. Ethnicity was not taken into account because our population-based sample group consisted of only white participants. The log transformation was applied to the reference standard, age, creatinine, and cystatin C, according to most of the existing equations. Additional variables (anthropometry, lifestyle, medical history, medication, hemodynamics, and blood and urine laboratory measurements), quadratic terms, and 2-fold interactions were subsequently examined. We selected variables on the basis of their ability to predict GFR, except for age and sex, which were forced into all models. Appendix 1 (available at
www.annals.org) lists the specific variables. Motivated by the CKD-EPI equation, we investigated whether 2 different slopes for creatinine improved the model fit. A 10% cross-validation within the learning sample was applied to exclude overoptimistic models.
In the validation sample, the model chosen on the basis of the learning sample was applied and performance was reported. We compared estimated GFR (eGFR) and the difference of eGFR minus measured GFR (mGFR) graphically. Bias was assessed as the mean and median difference between eGFR and mGFR, with positive values indicating an overestimation of mGFR Precision was assessed as an interquartile range for the difference and an SD of the bias, and accuracy as the percentage of estimates within 15% and 30% of the mGFR (P15, P30). The presented equations, however, were determined using all 570 participants.
The performance of the following creatinine-based estimating equations were analyzed: Cockcroft-Gault adjusted for body surface area (11), abbreviated (isotope dilution mass spectrometry-traceable) 4-variable MDRD (37), and CKD-EPI (13). We also studied the cystatin C-based equations proposed by the CKD-EPI: cystatin C 1 (CysCl), cystatin C 2 (CysC2), and cystatin C 3 (CysC3) (17, 32). For these equations, cystatin C values were reexpressed by the formula -0.105 + 1.13 × cystatin C, accounting for the standardization of cystatin C with ERM-DA471/IFCC as suggested by Inker and colleagues (32). Equations are detailed in Appendix 2 (available at www.annals.org).
The analysis was done using R, version 2.14.0 (R Foundation for Statistical Computing, Vienna, Austria), and SPSS 19.0 (IBM, Armonk, New York).
Statistical Analysis
Descriptive analysis includes means, SDs, medians, and quartiles for continuous variables; absolute frequencies and percentages for categorical variables. Age-dependent percentiles for eGFR are presented by using
quadratically smoothed curves based on 5-year strata. The primary analysis examined how well the new equation performed among persons aged 70 years or older, as evidenced by the degree of bias and misclassification.
The calculations of GFR from a 2-compartment model for iohexol clearance followed the protocol of Schwartz and colleagues (25), taking into account the slow and fast components. In case of lack of fit for the fast component (Appendix 1), the GFR was calculated from the slow component by using the Bröchner-Mortensen equation (38) (n = 37). Participants were excluded if the iohexol readings pointed to corrupted measures (that is, not all 8 measurements of iohexol were available or the mGFR could not be determined by using Schwartz and colleagues' method [25]). The decision to exclude these participants was not based on measurements that define our new equations (creatinine, cystatin C, age, and sex). Participants were subdivided and randomly stratified for age and sex in 2 subsamples of 285 participants each (Appendix Table 2, available at www.annals.org). The first sample was used for development of the new equation (learning sample) and the second for internal validation (validation sample).
Role of the Funding Source
The study was funded by the Kuratorium für Dialyse und Nierentransplatation (KfH) Foundation for Preventive Medicine. The funding source was informed about design and conduct and regularly updated on the
accomplishment of the study but was not involved in the analysis of the data or the decision to submit the manuscript for publication.
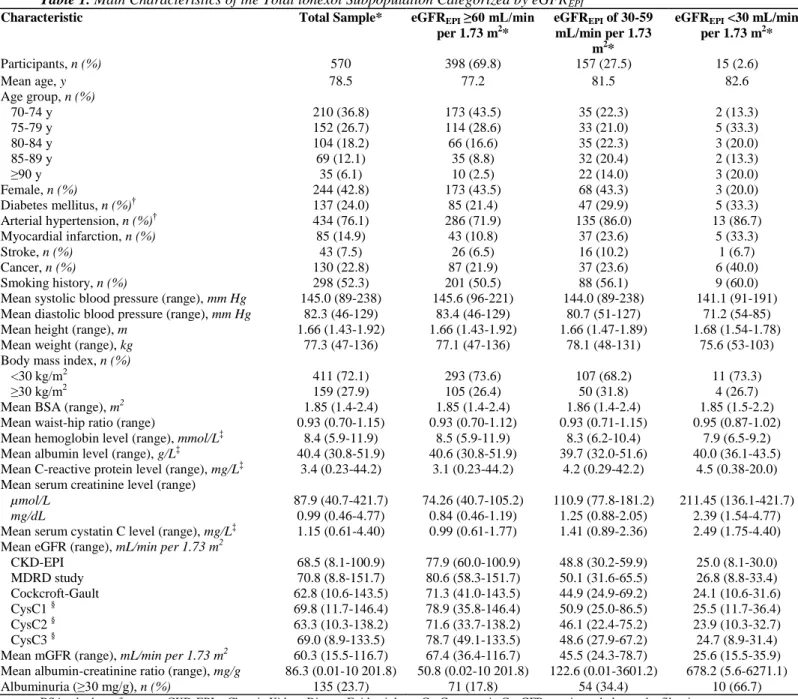
Table 1. Main Characteristics of the Total lohexol Subpopulation Categorized by eGFREPI
Characteristic Total Sample* eGFREPI ≥60 mL/min
per 1.73 m2* eGFREPI of 30-59 mL/min per 1.73 m2* eGFREPI <30 mL/min per 1.73 m2* Participants, n (%) 570 398 (69.8) 157 (27.5) 15 (2.6) Mean age, y 78.5 77.2 81.5 82.6 Age group, n (%) 70-74 y 210 (36.8) 173 (43.5) 35 (22.3) 2 (13.3) 75-79 y 152 (26.7) 114 (28.6) 33 (21.0) 5 (33.3) 80-84 y 104 (18.2) 66 (16.6) 35 (22.3) 3 (20.0) 85-89 y 69 (12.1) 35 (8.8) 32 (20.4) 2 (13.3) ≥90 y 35 (6.1) 10 (2.5) 22 (14.0) 3 (20.0) Female, n (%) 244 (42.8) 173 (43.5) 68 (43.3) 3 (20.0) Diabetes mellitus, n (%)† 137 (24.0) 85 (21.4) 47 (29.9) 5 (33.3) Arterial hypertension, n (%)† 434 (76.1) 286 (71.9) 135 (86.0) 13 (86.7) Myocardial infarction, n (%) 85 (14.9) 43 (10.8) 37 (23.6) 5 (33.3) Stroke, n (%) 43 (7.5) 26 (6.5) 16 (10.2) 1 (6.7) Cancer, n (%) 130 (22.8) 87 (21.9) 37 (23.6) 6 (40.0) Smoking history, n (%) 298 (52.3) 201 (50.5) 88 (56.1) 9 (60.0)
Mean systolic blood pressure (range), mm Hg 145.0 (89-238) 145.6 (96-221) 144.0 (89-238) 141.1 (91-191)
Mean diastolic blood pressure (range), mm Hg 82.3 (46-129) 83.4 (46-129) 80.7 (51-127) 71.2 (54-85)
Mean height (range), m 1.66 (1.43-1.92) 1.66 (1.43-1.92) 1.66 (1.47-1.89) 1.68 (1.54-1.78)
Mean weight (range), kg 77.3 (47-136) 77.1 (47-136) 78.1 (48-131) 75.6 (53-103)
Body mass index, n (%)
<30 kg/m2 411 (72.1) 293 (73.6) 107 (68.2) 11 (73.3)
≥30 kg/m2 159 (27.9) 105 (26.4) 50 (31.8) 4 (26.7)
Mean BSA (range), m2 1.85 (1.4-2.4) 1.85 (1.4-2.4) 1.86 (1.4-2.4) 1.85 (1.5-2.2)
Mean waist-hip ratio (range) 0.93 (0.70-1.15) 0.93 (0.70-1.12) 0.93 (0.71-1.15) 0.95 (0.87-1.02)
Mean hemoglobin level (range), mmol/L‡ 8.4 (5.9-11.9) 8.5 (5.9-11.9) 8.3 (6.2-10.4) 7.9 (6.5-9.2)
Mean albumin level (range), g/L‡ 40.4 (30.8-51.9) 40.6 (30.8-51.9) 39.7 (32.0-51.6) 40.0 (36.1-43.5)
Mean C-reactive protein level (range), mg/L‡ 3.4 (0.23-44.2) 3.1 (0.23-44.2) 4.2 (0.29-42.2) 4.5 (0.38-20.0)
Mean serum creatinine level (range)
µmol/L 87.9 (40.7-421.7) 74.26 (40.7-105.2) 110.9 (77.8-181.2) 211.45 (136.1-421.7)
mg/dL 0.99 (0.46-4.77) 0.84 (0.46-1.19) 1.25 (0.88-2.05) 2.39 (1.54-4.77)
Mean serum cystatin C level (range), mg/L‡ 1.15 (0.61-4.40) 0.99 (0.61-1.77) 1.41 (0.89-2.36) 2.49 (1.75-4.40)
Mean eGFR (range), mL/min per 1.73 m2
CKD-EPI 68.5 (8.1-100.9) 77.9 (60.0-100.9) 48.8 (30.2-59.9) 25.0 (8.1-30.0) MDRD study 70.8 (8.8-151.7) 80.6 (58.3-151.7) 50.1 (31.6-65.5) 26.8 (8.8-33.4) Cockcroft-Gault 62.8 (10.6-143.5) 71.3 (41.0-143.5) 44.9 (24.9-69.2) 24.1 (10.6-31.6) CysC1 § 69.8 (11.7-146.4) 78.9 (35.8-146.4) 50.9 (25.0-86.5) 25.5 (11.7-36.4) CysC2 § 63.3 (10.3-138.2) 71.6 (33.7-138.2) 46.1 (22.4-75.2) 23.9 (10.3-32.7) CysC3 § 69.0 (8.9-133.5) 78.7 (49.1-133.5) 48.6 (27.9-67.2) 24.7 (8.9-31.4)
Mean mGFR (range), mL/min per 1.73 m2 60.3 (15.5-116.7) 67.4 (36.4-116.7) 45.5 (24.3-78.7) 25.6 (15.5-35.9)
Mean albumin-creatinine ratio (range), mg/g 86.3 (0.01-10 201.8) 50.8 (0.02-10 201.8) 122.6 (0.01-3601.2) 678.2 (5.6-6271.1)
Albuminuria (≥30 mg/g), n (%) 135 (23.7) 71 (17.8) 54 (34.4) 10 (66.7)
BSA = body surface area; CKD-EPI = Chronic Kidney Disease Epidemiology; CysC = cystatin C; eGFR = estimated glomerular filtration rate; eGFREPI = glomerular filtration rate estimated by the CKD-EPI equation; MDRD = Modification of Diet in Renal Disease; mGFR =
measured glomerular filtration rate.
* Percentages may not total 100% due to rounding.
†
Diabetes was defined as either hemoglobin A1c >6.5% or prescription of antidiabetic medication. Hypertension was defined as prescription
of antihypertensive medication.
‡
To convert hemoglobin from mmol/L to g/L, divide by 6.21. To convert albumin from g/L to g/dL, multiply by 0.1. To convert C-reactive protein from mg/L to nmol/L, multiply by 9.524. To convert cystatin C from mg/L to nmol/L, multiply by 74.9.
§ Standardized cystatin C values were converted by formula (-0.105 + 1.13 × cystatin C) before being used for the equations CysC1, CysC2, and CysC3 (Appendix 2, available at www.annals.org).
RESULTS
Total lohexol Subsample
The goal to include 600 persons in the iohexol sub-sample was reached: 610 of 2073 participants of the BIS agreed to have iohexol clearance measured. Iohexol clearance measurement was feasible in older adults, and no participant had adverse events. From the 610 participants originally measured, 40 were excluded because of corrupt measurement of the gold standard (27 because of an incomplete number of iohexol measurement points;
12 because of an insufficient fit of the Schwartz model for iohexol measurements; and 1 with an outlying mGFR of 300 mL/min per 1.73 m2, as determined from the iohexol measurements), leaving a sample of 570 for the final analysis (Appendix Table 3, available at www.annals.org).
Table 1 shows the main characteristics of the total iohexol subsample. Mean age was 78.5 years, most were men (57.2%), one quarter had diabetes, more than three quarters had hypertension, and nearly one third was
overweight (body mass index >30 kg/m ). Associations with eGFR (Table 1) and mGFR (Appendix Table 4, available at www.annals.org) were similar. Overall mean mGFR was 60.3 mL/min per 1.73 m2, whereas all means of GFR estimated by using existing equations showed values that were 2.5 to 11.5 mL/min per 1.73 m2 higher.
Equation Development and Description of the BIS Equations
Appendix Table 5 (available at www.annals.org) documents the development of the BIS equations and shows the performance of the models developed in the learning sample. The final BIS2 equation for estimating GFR includes serum creatinine, serum cystatin C, sex, and age: BIS2 = 767 × cystatin C-0.61 × creatinine-0.40 × age-0.57
× 0.87 (if female) (Appendix 2). For practicability, we developed a creatinine-based equation that did not include cystatin C: BIS1 = 3736 × creatinine-0.87 × age-0.95 × 0.82 (if female).
No further variables were included in the equation, according to the criteria described above. Moreover, using 2 different slopes for creatinine (as was done for the CKD-EPI equation) did not improve our equation (Appendix Figure, available at www.annals.org).
Comparison of eGFR Equations and mGFR in the Validation Sample
Figure 1 shows the boxplot of mGFR and eGFR, according to the eGFR equations. The mGFR yielded a median of 61 mL/min per 1.73 m2, as did both new BIS equations. Apart from Cockcroft-Gault adjusted for body surface area (62 mL/min per 1.73 m2) and the CysC2 equation (63 mL/min per 1.73 m2), all other equations considerably overestimated mGFR (MDRD, 73 mL/min per 1.73 m2; CKD-EPI, 73 mL/min per 1.73 m2; CysC1, 70 mL/min per 1.73 m2; and CysC3, 69 mL/min per 1.73 m2) (Appendix Table 6, available at www.annals.org).
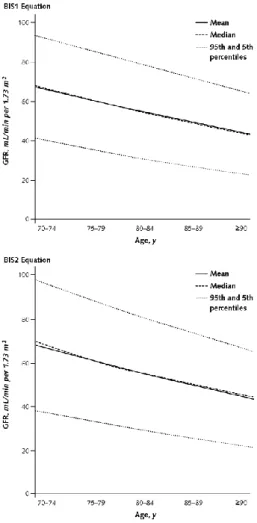
Age dependence of GFR estimated by the BISl and BIS2 in the study sample is displayed in Figure 2 and shows a very similar pattern of eGFR decline with increasing age. Above the age of 75 years, mean eGFR decreased below the cutoff of 60 mL/min per 1.73 m2.
Table 2 illustrates the bias of existing equations using different statistical parameters. Apart from the BIS2 equation, all other equations had a much larger proportion of false-negatives (wrongly considered >60 mL/min per 1.73 m2) than false-positives (wrongly considered <60 mL/min per 1.73 m2). The total number of
misclassifications was smallest for BIS2, followed by the CysC2 equation and BISl (33, 43, and 49, respectively, vs. at least 58 for the other equations). Except for the comparison of BISl with CKD-EPI, all other statistical tests showed significantly fewer total misclassifications. Accordingly, the P15 and P30 values were largest for the BIS equations, followed by the CysC2 equation.
Appendix Table 7 (available at www.annals.org) compares the BIS models with published models more detailed in terms of bias and correlation. Among the creatinine-based equations, the CKD-EPI and new BISl equations had the best performance (models 2 and 6). The Cockcroft-Gault equation showed very small bias. However, the overall finding was that cystatin C was superior to creatinine with respect to correlation with mGFR (models 7, 8, 9, and 10 vs. 1, 2, 4, and 5).
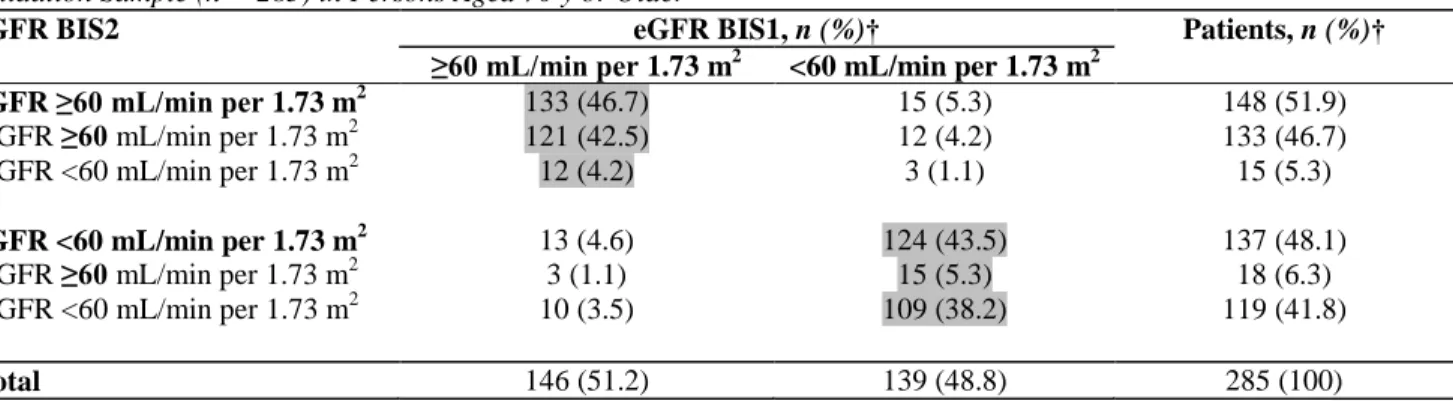
Tables 3 to 5 compare reclassification rates for different equations. The BIS1 classifies 55 more participants to a GFR less than 60 mL/min per 1.73 m2 than does the CKD-EPI, and the BIS2 equation classifies 53 more participants to a GFR less than 60 mL/min per 1.73 m2 than does the CysC3 equation (Tables 3 and 4). Table 5 shows that both BIS equations do not differ systematically (15 participants with higher GFRs estimated by BIS2 and 13 participants with higher GFRs estimated by BISl).
Figure 3 shows the performance for the eGFR equations in the validation sample. Limits of agreement and systematic error were smallest for the BIS2 equation.
Boxes indicate medians (line inside box), quartiles (upper and lower margins of box). Antennae are defined by the rule upper-lower box margin ± 1.5 × interquartile range. Circles indicate outliers. The dotted line represents
the GFR cutoff of 60 mL/min per 1.73 m. For estimating equations, refer to Appendix 2 (available at
www.annals.org). Standardized cystatin C values were converted by formula (-0.105 + 1.13 × cystatin C) before being used for the equations CysC1, CysC2, and CysC3. BIS = Berlin Initiative Study; BSA = body surface area; CKD-EPI = Chronic Kidney Disease Epidemiology; CysC = cystatin C; eGFR = estimated glomerular filtration rate; GFR = glomerular filtration rate; MDRD = Modification of Diet in Renal Disease; mGFR = measured glomerular filtration rate.
Figure 1. Comparison of mGFR with eGFR equations in the validation sample.
Table 2. Bias, Precision, and Accuracy in the Validation Sample (n = 285) for eGFR Equations in Persons Aged 70 y or Older Equation Mean Bias* SD of Difference* Median Bias* First Quartile* Third Quartile* P30, %† P15, %† Wrongly Considered <60 mL/min per 1.73 m2, n (%) Wrongly Considered >60 mL/min per 1.73 m2, n (%) Total Misclassified, n (%) P Value‡ BIS1 0.11 9.20 0.80 -5.03 6.11 95.1 69.5 27 (17.9) 22 (16.4) 49 (17.2) NA Cockcroft-Gault adjusted for BSA
2.74 11.66 2.53 -4.06 9.21 87.4 59.3 29 (19.2) 36 (26.9) 65 (22.8) 0.006 MDRD study 11.21 11.38 11.29 3.85 17.68 70.9 39.3 3 (2.0) 63 (47.0) 66 (23.2) 0.035 CKD-EPI 8.94 10.12 9.69 2.45 15.49 77.9 43.5 4 (2.6) 54 (40.3) 58 (20.4) 0.22 BIS2 0.09 8.06 0.87 -4.40 4.98 96.1 78.9 18 (11.9) 15 (11.2) 33 (11.6) NA CysC2§ 3.22 10.71 2.05 -3.23 8.61 89.1 63.9 15 (9.9) 28 (20.9) 43 (15.1) 0.041 CysC3§ 9.32 9.84 9.22 3.46 14.42 81.4 47.0 4 (2.6) 54 (40.3) 58 (20.4) 0.001
BIS = Berlin Initiative Study; BSA = body surface area; CKD-EPI = Chronic Kidney Disease Epidemiology; CysC = cystatin C; eGFR = estimated glomerular filtration rate; MDRD = Modification of Diet in Renal Disease; mGFR = measured glomerular filtration rate; NA = not applicable; P15 = number of participants with percentage difference at most 15%; P30 = the number of participants with percentage difference
at most 30%.
* Bias was defined as difference between eGFR and mGFR for each equation. Mean, SD, median, and quartiles refer to these differences. †P30 and P15 refer to percentage differences [(eGFR - mGFR) / mGFR × 100],
‡ P values refer to the sign test (2-sided), comparison of total misclassified participants in BIS1 (upper part) and BIS2 (lower part). § Standardized cystatin C values were converted by formula (-0.105 + 1.13 × cystatin C) before being used for the equations CysC2 and CysC3 (Appendix 2, available at www.annals.org).
Table 3. Comparison of the BIS1 With CKD-EPI Equation in Estimating GFR Stages and Comparison With
mGFR in the Validation Sample (n = 285) in Persons Aged 70 y or Older*
eGFR BIS1 eGFR CKD-EPI, n (%) Patients, n (%)
≥60 mL/min per 1.73 m2 <60 mL/min per 1.73 m2
eGFR ≥60 mL/min per 1.73 m2 146 (51.2) 0 146 (51.2)
mGFR ≥60 mL/min per 1.73 m2 124 (43.5) 0 124 (43.5)
mGFR <60 mL/min per 1.73 m2 22 (7.7) 0 22 (7.7)
eGFR <60 mL/min per 1.73 m2 55 (19.3) 84 (29.5) 139 (48.8)
mGFR ≥60 mL/min per 1.73 m2 23 (8.1) 4 (1.4) 27 (9.5)
mGFR <60 mL/min per 1.73 m2 32 (11.2) 80 (28.1) 112 (39.3)
Total 201 (70.5) 84 (29.5) 285 (100)
BIS = Berlin Initiative Study; CKD-EPI = Chronic Kidney Disease Epidemiology; eGFR = estimated glomerular filtration rate; GFR = glomerular filtration rate; mGFR = measured glomerular filtration rate.
* The following applies to Tables 3 to 5: Cells above the shaded diagonal cells represent disagreements in which GFR category was higher with the BISl than with the CKD-EPI (Table 3), the BIS2 than with the CysC3 (Table 4), and the BIS2 than with the BIS1 (Table 5). Cells below the shaded diagonal cells represent disagreements in which GFR category was lower.
Example: Agreement between BIS1 and CKD-EPI equations can be seen by noting the marginal frequencies of the 4 quadrants (n = 146, n = 0, n = 55, and n = 84) which refer to the 4 combinations of BIS 1 and CKD-EPI ≥60 mL/min per 1.73 m2 or <60 mL/min per 1.73 m2.
Accuracy of both equations can be seen from inspecting the detailed numbers referring to mGFR. Thus, 22 of 146 participants with eGFR ≥60 mL/min per 1.73 m2 were misclassified by both equations. When the 55 participants, who were classified differently by the 2 equations,
were split by mGFR (left bottom), it can be seen that BISl was superior to CKD-EPI in 32 of 55 participants and CKD-EPI was superior to BISl in 23 of 55 participants. The table is designed following the template by Levey et al (13).
Table 4. Comparison of BIS2 With CysC3 Equation in Estimating GFR Stages and Comparison With mGFR in
the Validation Sample (n = 285) in Persons Aged 70 y or Older*
eGFR BIS2 eGFR CysC3, n (%)† Patients, n (%)
≥60 mL/min per 1.73 m2 <60 mL/min per 1.73 m2
eGFR ≥60 mL/min per 1.73 m2 148(51.9) 0 148(51.9)
mGFR ≥60 mL/min per 1.73 m2 133 (46.7) 0 133 (46.7)
mGFR <60 mL/min per 1.73 m2 15(5.3) 0 15 (5.3)
eGFR <60 mL/min per 1.73 m2 53 (18.6) 84 (29.5) 137 (48.1)
mGFR ≥60 mL/min per 1.73 m2 14 (4.9) 4 (1.4) 18 (6.3)
mGFR <60 mL/min per 1.73 m2 39(13.7) 80 (28.1) 119(41.8)
Total 201 (70.5) 84 (29.5) 285(100)
BIS = Berlin Initiative Study; CysC = cystatin C; eGFR = estimated glomerular filtration rate; GFR = glomerular filtration rate; mGFR = measured glomerular filtration rate.
* See the footnote in Table 3.
† Standardized cystatin C values were converted by formula (-0.105 + 1.13 × cystatin C) before being used for the equation CysC3 (Appendix 2, available at www.annals.org).
Table 5. Comparison of BIS2 With BIS1 Equation in Estimating GFR Stages and Comparison With mGFR in the
Validation Sample (n = 285) in Persons Aged 70 y or Older*
eGFR BIS2 eGFR BIS1, n (%)† Patients, n (%)†
≥60 mL/min per 1.73 m2 <60 mL/min per 1.73 m2
eGFR ≥60 mL/min per 1.73 m2 133 (46.7) 15 (5.3) 148 (51.9)
mGFR ≥60 mL/min per 1.73 m2 121 (42.5) 12 (4.2) 133 (46.7)
mGFR <60 mL/min per 1.73 m2 12 (4.2) 3 (1.1) 15 (5.3)
eGFR <60 mL/min per 1.73 m2 13 (4.6) 124 (43.5) 137 (48.1)
mGFR ≥60 mL/min per 1.73 m2 3 (1.1) 15 (5.3) 18 (6.3)
mGFR <60 mL/min per 1.73 m2 10 (3.5) 109 (38.2) 119 (41.8)
Total 146 (51.2) 139 (48.8) 285 (100)
BIS = Berlin Initiative Study; eGFR = estimated glomerular filtration rate; GFR = glomerular filtration rate; mGFR = measured glomerular filtration rate.
DISCUSSION
Using the BIS cross-sectional database of 570 evaluable persons with iohexol clearance measurements, we developed 2 new equations: 1 based on creatinine only (the BIS1) and 1 based on creatinine and cystatin C (the BIS2) to estimate GFR in elderly participants aged 70 years or older. Compared with current creatinine-based or creatinine- and cystatin C-based equations, the new BISl and BIS2 equations showed better precision and excellent agreement with mGFR, especially in a population with an eGFR greater than 30 mL/min per 1.73 m2 (CKD stages 1 to 3). This is important because a validated equation to estimate GFR in older adults, especially in cases of normal or only moderately reduced kidney function, has been lacking.
Quadratically smoothed estimated GFR, by age, for men and women of the iohexol population of the BIS. For estimating equations, refer to Appendix 2 (available at www.annals.org). BIS = Berlin Initiative Study; GFR = glomerular filtration rate.
Several results were striking and may indicate that older adults are a unique population in which traditional assumptions are not necessarily true. We show that in elderly participants, the MDRD study equation yielded higher eGFRs across CKD stages than did the CKD-EPI and especially the Cockcroft-Gault equation. This contrasts with the situation in younger adults in whom implementation of the CKD-EPI equation has reduced CKD prevalence (13) but agrees with current results seen in older adults (39, 40). The MDRD study equation is known to overestimate GFR in elderly persons with reduced muscle mass (41). Accordingly, prevalence rates of GFR less than 60 mL/min per 1.73 m2 estimated by the Cockcroft-Gault equation were much higher than those estimated by the MDRD study equation, as has been shown earlier in large data sets (42, 43). The higher prevalence rates of reduced GFR compared with the estimates by the MDRD and CKD-EPI equations were surprising. The MDRD study population is considerably younger and does not include persons older than 70 years, but the CKD-EPI Collaboration study does include older adults. Potential explanations for the different prevalence rates could be that the initial CKD-EPI Collaboration study conditions were more heterogeneous than those of the BIS in terms of samples, marker used for measuring clearance, methodology and way of measuring GFR (plasma and urine clearance), and calibration of serum creatinine. This may explain a larger variation of the data, but whether it relates to bias remains speculative.
The most striking result was that incorporation of cystatin C in the equation decreased the effect of age and sex. This confirms the independence of cystatin C from age-and sex-associated conditions (14, 16, 36) and may thus make it the preferred laboratory variable to be included in a GFR-estimating equation in an elderly population where reduction in muscle mass is common. Advantages of cystatin C to identify a moderate decline in renal function in elderly persons have been described (44). However, the implementation of an equation that includes cystatin C may be considerably more expensive than those that include creatinine.
Among the other current equations, the Cockcroft-Gault exhibited the smallest bias compared with mGFR. This agrees with a previous study evaluating renal function by using iohexol in a sample of 222 patients aged 65 to 88 years that also presented the Cockcroft-Gault equation as an unbiased estimate (45). However, in terms of precision, the Cockcroft-Gault equation was disappointing because of 23% misclassification.
One strength of the study is that it used primary data of mGFR by using 1 gold standard in a fairly large population-based sample of vulnerable persons with a mean age of 78.5 years. Data in the literature support the notion that plasma clearance has the potential for higher precision than urinary clearance (46, 47). We only found 1 other study that measured iohexol clearance in a large sample of elderly patients (48). However, this study investigates hospitalized patients only and differs considerably in terms of methodology of clearance measurements. A further strength of the BIS is its design of prospective data collection, including isotope dilution mass spectrometry-traceable creatinine as well as standardized cystatin C values. Iohexol samples were collected by the same well-trained staff and analyzed in Berlin within 7 days of collection. These methodological advantages and the potential homogeneity of the BIS population may have contributed to the high precision of the BIS2 equation. Given the high cost of cystatin C analysis, we also derived an alternative creatinine-based equation (BIS1). Several limitations deserve mention. First, our data have not been validated in an external validation sample. An equation always performs best in the data set from which it was derived (49), especially with regard to bias. Therefore, a future external validation by an independent investigator is needed. Second, the subsample of 610 participants was not randomly drawn from the entire cohort of 2073 but was asked to have iohexol measured after enrollment in the BIS, potentially introducing selection bias. When the MDRD study equation was used (Appendix Table 6), the prevalence of eGFR less than 60 mL/min per 1.73 m in our iohexol subsample was approximately 7% less than the prevalence rates in other community-dwelling elderly cohorts (7, 50). The rate of participants with albuminuria was similar to another representative sample (51). Thus, we were
able to measure GFR in older adults with normal or mild to moderately reduced GFR, which are the population that has generated the most debate about possible CKD misclassification. Further, we believe that potential responder bias would not have had a considerable effect on equation development. For reasons of feasibility and precision in an elderly cohort with a mean age of 78.5 years, we measured only plasma clearance and not urine clearance. One could argue that when plasma clearance is used, only an overestimation of true GFR exists, especially in persons with reduced kidney function (52). However, early studies suggest that tubular secretion of iohexol is negligible (53, 54). An overestimation would increase the magnitude of the difference between our mGFR and eGFRs. Third, BIS includes only white participants with mild to moderately reduced kidney function; thus, we cannot necessarily extend these results to other ethnicities or to patients with more severe kidney function. Fifth, we use iohexol and not iothalamate, which was the gold standard for development of the MDRD study and CKD-EPI equations and thus cannot rule out differences in measurement because of diverse markers. Finally, the high prevalence rates of GFR less than 60 mL/min per 1.73 m2 may not reflect true CKD. Because this is a cross-sectional analysis, we do not have repeated creatinine measurements in our sample to indicate chronicity. The high prevalence rates may continue the debate about current cutoffs used to define CKD in older adults (55). Whereas our cross-sectional analysis cannot answer this question, we hope that longitudinal follow-up data from BIS will help resolve whether CKD staging in older adults needs to be redefined.
In summary, iohexol measurements revealed lower GFRs than predicted by current equations used to estimate GFR in participants aged 70 years or older who have normal or mild to moderately reduced kidney function. The newly developed BIS equations may provide more precise and accurate tools for estimating GFR in this age group.
From Charité University Medicine, Campi Virchow, Mitte, and Benjamin Franklin, Institute of Biostatistics and Clinical Epidemiology, Vivantes Klinikum im Friedrichshain, Labor Berlin, Institute of Laboratory Medicine, Clinical Chemistry and Pathobiochemistry, Berlin, Germany; University of Liège, Centre Hospitalier
Universitaire du Sart-Tilman, Liège, Belgium; and Institute of Medical Biostatistics, UKT Tübingen, Eberhard Karls University Tübingen, Tübingen, Germany.
The figure differs from Bland-Altman plots in choosing eGFR instead of mean eGFR and mGFR for the x-axis. This type of display emphasizes the predictive nature of the equation for eGFR. Moreover, the fit of both the bias and the limits of agreement were done by cubic regression. Thus, estimates may be less accurate for extremely low or high values of eGFR. Local estimation was not feasible because of the moderate sample size. For estimating equations, refer to Appendix 2 (available at www.annals.org). Standardized cystatin C values were converted by formula (-0.105 + 1.13 × cystatin C) before being used for the equation CysC2. BIS = Berlin Initiative Study; CKD-EPI = Chronic Kidney Disease Epidemiology; CysC = cystatin C; eGFR = estimated glomerular filtration rate; GFR = glomerular filtration rate; MDRD = Modification of Diet in Renal Disease; mGFR = measured glomerular filtration rate.
Acknowledgment
The authors thank their colleagues at the 13 study sites in Berlin for providing the necessary infrastructure for the study and Dirk Wiesenthal, MSc (bioinformatics), for statistical programming. They also thank the health insurance fund AOK Nordost-Die Gesundheitskasse for its continuous cooperation and technical support and the participants of the BIS for their participation and commitment.
Grant Support: By the Kuratorium fur Dialyse und Nierentransplatation (KfH) Foundation of Preventive Medicine and the Dr. Werner Jackstädt Foundation.
Potential Conflicts of Interest: Disclosures can be viewed at
www.acponline.org/authors/icmje/ConflictOfInterestForms.do?rnsNum=M12-0477.
References
1. Stenvinkel P. Chronic kidney disease: a public health priority and harbinger of premature cardiovascular disease. J Intern Med. 2010;268:456-67. [PMID: 20809922]
2. Smith H. Comparative physiology of the kidney. In: Smith H, ed. The Kidney: Structure and Function in Health and Disease. New York: Oxford Univ Pr; 1951.
3. Hemmelgarn BR, Zhang J, Manns BJ, James MT, Quinn RR, Ravani P, et al; Alberta Kidney Disease Network. Nephrology visits and health care resource use before and after reporting estimated glomerular filtration rate. JAMA. 2010;303:1151-8. [PMID: 20332400]
4. O'Hare AM, Bertenthal D, Covinsky KE, Landefeld CS, Sen S, Mehta K, et al. Mortality risk stratification in chronic kidney disease: one size for all ages? J Am Soc Nephrol. 2006;17:846-53. [PMID: 16452492]
5. Garg AX, Papaioannou A, Ferko N, Campbell G, Clarke JA, Ray JG. Estimating the prevalence of renal insufficiency in seniors requiring long-term care. Kidney Int. 2004;65:649-53. [PMID: 14717937]
6. Hallan SI, Dahl K, Oien CM, Grootendorst DC, Aasberg A, Holmen J, et al. Screening strategies for chronic kidney disease in the general population: follow-up of cross sectional health survey. BMJ. 2006;333:1047. [PMID: 17062598]
7. Coresh J, Selvin E, Stevens IA, Manzi J, Kusek JW, Eggers P, et al. Prevalence of chronic kidney disease in the United States. JAMA. 2007;298:2038-47. [PMID: 17986697]
8. Campbell KH, O'Hare AM. Kidney disease in the elderly: update on recent literature. Curr Opin Nephrol Hypertens. 2008;17:298-303. [PMID: 18408482]
9. Zhang QL, Rothenbacher D. Prevalence of chronic kidney disease in population-based studies: systematic review. BMC Public Health. 2008;8:117. [PMID: 18405348]
10. Rule AD, Amer H, Cornell LD, Taler SJ, Cosio FG, Kremers WK, et al. The association between age and nephrosclerosis on renal biopsy among healthy adults. Ann Intern Med. 2010;152:561-7. [PMID: 20439574]
11. Cockcroft DW, Gault MH. Prediction of creatinine clearance from serum creatinine. Nephron. 1976;16:31-41. [PMID: 1244564] 12. Levey AS, Bosch JP, Lewis JB, Greene T, Rogers N, Roth D. A more accurate method to estimate glomerular filtration rate from serum creatinine: a new prediction equation. Modification of Diet in Renal Disease Study Group. Ann Intern Med. 1999;130:461-70. [PMID: 10075613]
13. Levey AS, Stevens LA, Schmid CH, Zhang YL, Castro AF 3rd, Feldman HI, et al; CKD-EPI (Chronic Kidney Disease
Epidemiology Collaboration). A new equation to estimate glomerular filtration rate. Ann Intern Med. 2009;150: 604-12. [PMID:
19414839]
14. Finney H, Bates CJ, Price CP. Plasma cystatin C determinations in a healthy elderly population. Arch Gerontol Geriatr. 1999;29:75-94. [PMID: 15374079]
15. Johnson D. Evaluation of renal function: use of cystatin C measurement in evaluating kidney function. Nephrology (Carlton). 2005;10(Suppl 4):S 157-67.
16. Fliser D, Ritz E. Serum cystatin C concentration as a marker of renal dysfunction in the elderly. Am J Kidney Dis. 2001;37:79-83. [PMID: 11136171]
17. Stevens LA, Coresh J, Schmid CH, Feldman HI, Froissart M, Kusek J, et al. Estimating GFR using serum cystatin C alone and in combination with serum creatinine: a pooled analysis of 3,418 individuals with CKD. Am J Kidney Dis. 2008;51:395-406. [PMID: 18295055]
18. Rule AD, Larson TS, Bergstralh EJ, Slezak JM, Jacobsen SJ, Cosio FG. Using serum creatinine to estimate glomerular filtration rate: accuracy in good health and in chronic kidney disease. Ann Intern Med. 2004;141:929-37. [PMID: 15611490]
19. Van Pottelbergh G, Vaes B, Morelle J, Jadoul M, Wallemacq P, Degryse J. Estimating GFR in the oldest old: does it matter what equation we use? Age Ageing. 2011;40:401-5. [PMID: 21454345]
20. Botev R, Mallié JP, Wetzels JF, Couchoud C, Schück O. The clinician and estimation of glomerular filtration rate by creatinine-based formulas: current limitations and quo vadis. Clin J Am Soc Nephrol. 2011;6:937-50. [PMID: 21454722]
21. Shastri S, Tighiouart H, Kate R, Rifkin DE, Fried LF, Shlipak MG, et al. Chronic kidney disease in octogenarians. Clin J Am Soc Nephrol. 2011;6: 1410-7. [PMID: 21511839]
22. Delanaye P, Cavalier E, Mariât C, Maillard N, Krzesinski JM. MDRD or CKD-EPI study equations for estimating prevalence of stage 3 CKD in epidemiological studies: which difference? Is this difference relevant? BMC Nephrol. 2010;11:8. [PMID: 20515483] 23. Schaeffner ES, van der Giet M, Gaedeke J, Toile M, Ebert N, Kuhlmann MK, et al. The Berlin Initiative Study the methodology of exploring kidney function in the elderly by combining a longitudinal and cross-sectional approach. Eur J Epidemiol. 2010;25:203-10. [PMID: 20094758]
24. Cavalier E, Rozet E, Dubois N, Charlier C, Hubert P, Chapelle JP, et al. Performance of iohexol determination in serum and urine by HPLC: validation, risk and uncertainty assessment. Clin Chim Acta. 2008;396:80-5. [PMID: 18687322]
25. Schwartz GJ, Furth S, Cole SR, Warady B, Munoz A. Glomerular filtration rate via plasma iohexol disappearance: pilot study for chronic kidney disease in children. Kidney Int. 2006;69:2070-7. [PMID: 16612328]
26. Brown SC, O'Reilly PH. Iohexol clearance for the determination of glomerular filtration rate in clinical practice: evidence for a new gold standard. J Urol. 1991;146:675-9. [PMID: 1875470]
27. Gaspari F, Perico N, Matalone M, Signorini O, Azzollini N, Mister M, et al. Precision of plasma clearance of iohexol for estimation of GFR in patients with renal disease. J Am Soc Nephrol. 1998;9:310-3. [PMID: 9527409]
28. Arvidsson A, Hedman A. Plasma and renal clearance of iohexol—a study on the reproducibility of a method for the glomerular filtration rate. Scand J Clin Lab Invest. 1990;50:757-61. [PMID: 2293336]
29. Kruteén E, Back SE, Nilsson-Ehle I, Nilsson-Ehle P. Plasma clearance of a new contrast agent, iohexol: a method for the assessment of glomerular filtration rate. J Lab Clin Med. 1984;104:955-61. [PMID: 6438261]
30. Gaspari F, Perico N, Ruggenenti P, Mosconi L, Amuchastegui CS, Guerini E, et al. Plasma clearance of nonradioactive iohexol as a measure of glomerular filtration rate. J Am Soc Nephrol. 1995;6:257-63. [PMID: 7579093]
31. Brandström E, Grzegorczyk A, Jacobsson L, Friberg P, Lindahl A, Aurell M. GFR measurement with iohexol and 5 lCr-EDTA. A comparison of the two favoured GFR markers in Europe. Nephrol Dial Transplant. 1998;13:1176-82. [PMID: 9623550]
32. Inker LA, Eckfeldt J, Levey AS, Leiendecker-Foster C, Rynders G, Manzi J, et al. Expressing the CKD-EPI (Chronic Kidney Disease Epidemiology Collaboration) cystatin C equations for estimating GFR with standardized serum cystatin C values [Letter]. AmJ Kidney Dis. 2011;58:682-4. [PMID: 21855190]
33. Delanaye P, Pieroni L, Abshoff C, Lutteri L, Chapelle JP, Krzesinski JM, et al. Analytical study of three cystatin C assays and their impact on cystatin C-based GFR-prediction equations. Clin Chim Acta. 2008;398:118-24. [PMID: 18805407]
34. Grubb A, Blirup-Jensen S, Lindström V, Schmidt C, Althaus H, Zegers I; IFCC Working Group on Standardisation of Cystatin
C (WG-SCC). First certified reference material for cystatin C in human serum ERM-DA471/IFCC. Clin Chem Lab Med. 2010;48:1619-21.
[PMID: 21034257]
35. Newman DJ. Cystatin C. Ann Clin Biochem. 2002;39:89-104. [PMID: 11928770]
36. Séronie-Vivien S, Delanaye P, Piéroni L, Mariât C, Froissart M, Cristol JP; SFBC "Biology of renal function and renal failure"
working group. Cystatin C: current position and future prospects. Clin Chem Lab Med. 2008;46:1664-86. [PMID: 18973461]
37. Levey AS, Coresh J, Greene T, Stevens LA, Zhang YL, Hendriksen S, et al; Chronic Kidney Disease Epidemiology
Collaboration. Using standardized serum creatinine values in the modification of diet in renal disease study equation for estimating
glomerular filtration rate. Ann Intern Med. 2006;145:247-54. [PMID: 16908915]
38. Bröchner-Mortensen J. A simple method for the determination of glomerular filtration rate. Scand J Clin Lab Invest. 1972;30:271-4. [PMID: 4629674]
39. van den Brand JA, van Boekel GA, Willems HL, Kiemeney LA, den Heijer M, Wetzels JF. Introduction of the CKD-EPI equation to estimate glomerular filtration rate in a Caucasian population. Nephrol Dial Transplant. 2011;26: 3176-81. [PMID: 21325352]
40. Van Pottelbergh C, Gurina N, Degryse J, Frolova E. Prevalence of impaired renal function in the elderly in the St. Petersburg District: results of the Crystal study. Adv Gerontol. 2011;24:108-13. [PMID: 21809629]
41. Stevens LA, Coresh J, Feldman HI, Greene T, Lash JP, Nelson RG, et al. Evaluation of the modification of diet in renal disease study equation in a large diverse population. J Am Soc Nephrol. 2007;18:2749-57. [PMID: 17855641]
42. Coresh J, Astor BC, Greene T, Eknoyan G, Levey AS. Prevalence of chronic kidney disease and decreased kidney function in the adult US population: Third National Health and Nutrition Examination Survey. Am J Kidney Dis. 2003;4l: 1-12. [PMID: 12500213] 43. Wasén E, Isoaho R, Manila K, Vahlberg T, Kivelä SL, Irjala K. Estimation of glomerular nitration rate in the elderly: a comparison of creatinine-based formulae with serum cystatin C. J Intern Med. 2004;256:70-8. [PMID: 15189368]
44. Shlipak MG, Praught ML, Sarnak MJ. Update on cystatin C: new insights into the importance of mild kidney dysfunction. Curr Op in Nephrol Hypertens. 2006;15:270-5. [PMID: 16609294]
45. Spinier SA, Nawarskas JJ, Boyce EG, Connors JE, Charland SL, Goldfàrb S. Predictive performance of ten equations for estimating creatinine clearance in cardiac patients. Iohexol Cooperative Study Group. Ann Pharmacother. 1998;32: 1275-83. [PMID: 9876806]
46. Stevens LA, Levey AS. Measured GFR as a confirmatory test for estimated GFR. J Am Soc Nephrol. 2009;20:2305-13. [PMID: 19833901]
47. Agarwal R. Ambulatory GFR measurement with cold iothalamate in adults with chronic kidney disease. Am J Kidney Dis. 2003;41:752-9. [PMID: 12666061]
48. Segarra A, de la Torre J, Ramos N, Quiroz A, Garjau M, Torres I, et al. Assessing glomerular filtration rate in hospitalized patients: a comparison between CKD-EPI and four cystatin C-based equations. Clin J Am Soc Nephrol. 2011; 6:2411-20. [PMID: 21852668] 49. Rule AD. The CKD-EPI equation for estimating GFR from serum creatinine: real improvement or more of the same? [Editorial]. Clin J Am Soc Nephrol. 2010;5:951-3. [PMID: 20448068]
50. Hemmelgarn BR, Zhang J, Manns BJ, Tonelli M, Larsen E, Ghali WA, et al. Progression of kidney dysfunction in the community-dwelling elderly. Kidney Int. 2006;69:2155-61. [PMID: 16531986]
51. Garg AX, Kiberd BA, Clark WF, Haynes RB, Clase CM. Abuminuria and renal insufficiency prevalence guides population screening: results from the NHANES III. Kdney Int. 2002;61:2165-75. [PMID: 12028457]
52. Stolz A, Hoizey G, Toupance O, Lavaud S, Vitry F, Chanard J, et al. Evaluation of sample bias for measuring plasma iohexol clearance in kidney transplantation. Transplantation. 2010;89:440-5. [PMID: 20177346]
53. Frennby B, Sterner G, Almén T, Hagstam KE, Jacobsson L. Determination of low glomerular filtration rate using iohexol clearance. Invest Radiol. 1994;29 Suppl 2:S234-5. [PMID: 7928242]
54. Olsson B, Aulie A, Sveen K, Andrew E. Human pharmacokinetics of iohexol. A new nonionic contrast medium. Invest Radiol. 1983;18:177-82. [PMID: 6408018]
55. Glassock RJ, Winearls G An epidemic of chronic kidney disease: fact or fiction? Nephrol Dial Transplant. 2008;23:1117-21. [PMID: 18359870]
Author Contributions:
Conception and design: E.S. Schaeffner, N. Ebert, M.K. Kuhlmann, M. van der Giet, P. Martus.
Analysis and interpretation of the data: E.S. Schaeffner, N. Ebert, P. Delanaye, U. Frei, J. Gaedeke, O. Jakob, M.K. Kuhlmann, M. Schuchardt, M. Tölle, R. Ziebig, M. van der Giet, P. Martus.
Drafting of the article: E.S. Schaeffner, N. Ebert, P. Martus.
Critical revision of the article for important intellectual content: E.S. Schaeffner, N. Ebert, P. Delanaye, U. Frei, J. Gaedeke, O. Jakob, M.K. Kuhlmann, M. Schuchardt, M. Tölle, R. Ziebig, M. van der Giet, P. Martus. Final approval of the article: E.S. Schaeffner, N. Ebert, P. Delanaye, U. Frei, J. Gaedeke, O. Jakob, M.K. Kuhlmann, M. Schuchardt, M. Tölle, R. Ziebig, M. van der Giet, P. Martus.
Provision of study materials or patients: E.S. Schaeffner, N. Ebert, J. Gaedeke, M. van der Giet. Statistical expertise: E.S. Schaeffner, P. Delanaye, O. Jakob, P. Martus.
Obtaining of funding: E.S. Schaeffner, N. Ebert, J. Gaedeke, M.K. Kuhlmann, M. van der Giet, P. Martus. Administrative, technical, or logistic support: E.S. Schaeffner, N. Ebert, U. Frei, M. Schuchardt, R. Ziebig, M. van der Giet.
Collection and assembly of data: E.S. Schaeffner, N. Ebert, M. Tölle, M. van der Giet.
APPENDIX 1: FURTHER DETAILS
Comparison of Learning and (Internal) Validation Sample
Appendix Table 2 compares the clinical characteristics between the learning sample and internal validation sample. Mean mGFR was 60.1 mL/min per 1.73 m2 (SD, 16.1) in the learning sample and 60.4 mL/min per 1.73 m2 (SD, 17.0) in the validation sample. As expected, no differences between the 2 samples were seen.
Specific Variables for Selection Into the Models
Additional variables (body weight, body height, body mass index, waist-hip ratio, smoking history [yes or no], alcohol consumption [daily, less than twice per week, less than once per month], diabetes [yes or no], myocardial infarction [yes or no], stroke [yes or no], cancer [yes or no], lipid-lowering drugs, analgesic drugs,
antihypertensives, antidiabetics, antiarrhythmics, blood pressure, pulse, serum albumin, C-reactive protein, urea, uric acid, albumin-creatinine ratio, cholesterol, high-density and low-density cholesterol, triglycerides,
hemoglobin A1c, calcium, phosphorus, and hemoglobin), quadratic terms, and 2-fold interactions were examined.
Comparison of Slope With the CKD-EPI Equation
The change of slope for creatinine incorporated in the CKD-EPI equation (13) could only partially be reproduced at lower creatinine values in our elderly population. Also, this was pronounced only for men (Appendix Figure). After inclusion of cystatin C, no need for a change of creatinine slope was apparent, which seems to be in
accordance with the results of Stevens and colleagues (17). However, differences in slope may also depend on the respective level of GFR within the population of interest.
Comparing Equations
The combination of cystatin C and creatinine provided the best results only if age and sex were included. This was also true for all existing cystatin C-based equations as well as for the newly developed BIS equation models (models 8, 10, 12, and 14). In equations including cystatin C, the influence of age and sex was diminished compared with equations not including cystatin C (models 2 and 5 vs. 8 and 10). The BIS2 equation exhibited the smallest bias compared with all other models. The coefficients for age in our equations (models 2, 8, and 12) were much larger than those for age in other equations (models 5, 4, 10, and 14), indicating a greater influence of age in the elderly population than in younger persons.
In terms of R2 but not of bias, the CysC3 equation by Stevens and colleagues (17) (model 14) demonstrated
similar validity to ours (model 12).
For details on comparing equations, see Appendix Table 7.
Additional Statistical Measures of Fit for BIS Equations
According to our study protocol, we estimated R2 for our new BIS equations for eGFR including 95% confidence
limits. Confidence limits for R2 values and root mean-square error were calculated by bootstrap resampling.
Details of the Calculation of mGFR Using the Method of Schwartz and Colleagues and the Approach of Bröchner-Mortensen
In Schwartz and colleagues' approach (25), slow and fast sequential components of the GFR are defined, which sum to the entire mGFR The calculation of the slow component is based on the measurements at 120, 150, 180, 240, and 300 minutes after injection of iohexol. The calculation of the fast component is based on the
measurements at 30, 60, and 90 minutes after injection minus the values predicted by extrapolation of the slow component.
For both components, a half-logarithmic model is used. This model assumes an exponential decay of
measurement values over time. Leaving the time axis as it is and taking logarithms for the measurements lead to a linear regression equation. For both, the slow and fast component lack of fit was defined by Pearson correlation (R > -0.85) in the half-logarithmic regression model.
Bröchner-Mortensen showed that the fast component, which is much smaller and depends on the first 3 measurements, may be estimated by the slow component with high precision (38). Thus, we used the following strategy in case of insufficient fit of the half-logarithmic models:
Participants were excluded if not all 8 measurements of iohexol were available or if the exponential decay of measured iohexol concentration over time could not be confirmed (Pearson correlation of log iohexol versus time > -0.85). However, in case of corrupted measurements for the fast component and valid measurements for the slow component, the Bröchner-Mortensen equation was used to calculate the mGFR. In case of corrupted measurements for the slow component, participants were excluded from the construction and validation of the equation.
APPENDIX 2: ESTIMATING EQUATIONS
The following equations were used to estimate GFR (creatinine was measured in mg/dL, and cystatin C was measured in mg/L):
BIS1: 3736 × creatinine-0.87 × age-0.95 × 0.82 (if female)
BIS2: 767 × cystatin C-0.61 × creatinine-0.40 × age-0.57 × 0.87 (if female) CKD-EPI:
Female ≤62 µmol/L (≤0.7 mg/dL): 144 × (creatinine/ 0.7)-0.329 × 0.993age Female >62 µmol/L (>0.7 mg/dL): 144 × (creatinine/ 0.7)-1.209 × 0.993age Male ≤80 µmol/L (≤0.9 mg/dL): 141 × (creatinine/ 0.9)-0.411
× 0.993age Male >80 µmol/L (>0.9 mg/dL): 141 × (creatinine/ 0.9)-1.209 × 0.993age Cockcroft-Gault: (140 - age) × weight/(72 × creatinine)
Creatinine: 55.7 × creatinine-0.79 (model 1)
Creatinine, age, sex (Stevens et al [17]): 221 × creatinine-1.12 × age-0.27 × 0.76 (if female) Creatinine, cystatin C: 61.6 × cystatin C-0.67 × creatinine-0.23 (model 11)
Creatinine, cystatin C (Stevens et al [17]): 80.6 × cystatin C-0.82 × creatinine-0.41 CysC1: 76.7 × cystatin C-1.19
CysC2: 127.7 × cystatin C-1.17 × age-0.13 × 0.91 (if female)
CysC3: 177.6 × creatinine-0.65 × cystatin C-0.57 × age-0.20 × 0.82 (if female) Cystatin C: 63 × cystatin C-0.97 (model 7)
Cystatin C, age, sex: 493 × cystatin C-0.95 × age-0.46 × 0.93 (if female) (model 8) MDRD: 175 × creatinine-1.154 × age-0.203 × 0.742 (if female)
(Model numbers in parentheses refer to Appendix Table 7.)
Appendix Table 1. Comparison of the Participants' Main Characteristics in the Total BIS Cohort and the
lohexol Subpopulation
Characteristic Total
Sample, n
Cohort Total BIS Cohort Total BIS Cohort
Minus lohexol Subpopulation lohexol Subpopulation Participants, n (%) 2073 2073 1503 (72.5) 570 (27.5) Mean age, y 80.4 81.1 78.5 Age group, n (%) 70-74 y 575 (27.7) 365 (24.3) 210 (36.8) 75-79 y 478 (23.1) 326 (21.7) 152 (26.7) 80-84 y 427 (20.6) 323 (21.5) 104 (18.2) 85-89 y 385 (18.6) 316 (21.0) 69 (12.1) ≥90 y 208 (10.0) 173 (11.5) 35 (6.1) Female, n (%) 2073 1089 (52.5) 845 (56.2) 244 (42.8) Diabetes mellitus, n (%)* 2073 539 (26.0) 402 (26.7) 137 (24.0) Arterial hypertension, n (%)* 2073 1613 (77.8) 1179 (78.4) 434 (76.1) Myocardial infarction, n (%) 2073 285 (13.7) 200 (13.3) 85 (14.9) Stroke, n (%) 2051 177 (8.5) 134 (8.9) 43 (7.5) Cancer, n (%) 2073 465 (22.4) 335 (22.3) 130 (22.8) Smoking history, n (%) 2073 1031 (49.7) 733 (48.8) 298 (52.3)
Mean systolic blood pressure (range), mm Hg 2069 145.4 (74.0-245.0) 145.6 (74.0-245.0) 145.0 (89.0-238.0) Mean diastolic blood pressure (range), mm Hg 2069 81.3 (43.5-149.0) 80.9 (43.5-149.0) 82.3 (46.0-129.0)
Mean height (range), m 2070 1.64 (1.39-1.98) 1.64 (1.39-1.98) 1.66 (1.43-1.92)
Mean weight (range), kg 2071 75.0 (40.0-136.0) 74.1 (40.0-131.0) 77.3 (47.0-136.0)
Body mass index, n (%) 2070
<30 kg/m2 1522 (73.5) 1111 (73.9)† 411 (72.1)
≥30 kg/m2 548 (26.5) 389 (25.9)† 159 (27.9)
Mean BSA (range), m2 2070 1.81 (1.24-2.49) 1.80 (1.24-2.49) 1.85 (1.35-2.40)
Mean waist-hip ratio (range) 2067 0.93 (0.52-1.25) 0.92 (0.52-1.25) 0.93 (0.70-1.15)
Mean hemoglobin level (range), mmol/L‡ 2008 8.39 (5.22-12.54) 8.37 (5.22-12.54) 8.43 (5.90-11.86)
Mean albumin level (range), g/L‡ 2069 39.9 (28.2-51.9) 39.8 (28.2-51.3) 40.4 (30.8-51.9)
Mean C-reactive protein level (range), mg/L‡ 2059 3.53 (0.10-64.00) 3.57 (0.10-64.00) 3.41 (0.23-44.21) Mean serum creatinine level (range)
µmol/L 2072 89.9 (34.5-421.7) 89.7 (34.5-377.5) 90.6 (39.8-421.7)
mg/dL 2072 1.02 (0.39-4.77) 1.01 (0.39-4.27) 1.03 (0.45-4.77) Mean albumin-creatinine ratio (range), mg/g 2058 71.5 (0.01-10 201.8) 66.0 (0.01-9261.3) 86.3 (0.01-10 201.8)
Albuminuria (≥30 mg/g), n (%) 2058 544 (26.4) 409 (27.2) 135 (23.7)
BIS = Berlin Initiative Study; BSA = body surface area.
* Diabetes was defined as either hemoglobin A1c >6.5% or prescription of antidiabetic medication. Hypertension was defined as prescription
of antihypertensive medication. † Values are missing for 3 participants.
‡ To convert hemoglobin from mmol/L to g/L, divide by 6.21. To convert albumin from g/L to g/dL, multiply by 0.1. To convert C-reactive protein from mg/L to nmol/L, multiply by 9.524.
Appendix Table 2. Comparison Between Learning and Validation Samples
Characteristic Learning Sample (n = 285) Internal Validation Sample (n = 285)
Mean age (SD), y 78.5 (6.2) 78.5 (6.1) Age group, n (%) 70-74 y 105 (36.8) 105 (36.8) 75-79 y 76 (26.7) 76 (26.7) 80-84 y 52 (18.2) 52 (18.2) 85-89 y 35 (12.3) 34 (11.9) ≥90 y 17 (6.0) 18 (6.3) Female, n (%) 122 (42.8) 122 (42.8) Diabetes, n (%)* 76 (26.7) 61 (21.4) Hypertension, n (%)* 225 (78.9) 209 (73.3) Smoking history, n (%) 145 (50.9) 153 (53.7)
Mean height (range), m 1.66 (1.43-1.90) 1.66 (1.47-1.92)
Mean weight (range), kg 78.0 (47.0-131.0) 76.7 (50.0-136.0)
Mean body mass index (range), kg/m2 28.1 (19.0-45.5) 27.7 (19.1-47.1)
Mean BSA (range), m2 1.86 (1.35-2.39) 1.85 (1.41-2.40)
Mean waist-hip ratio (range) 0.94 (0.70-1.12) 0.93 (0.70-1.15)
Mean mGFR (range), mL/min per 1.73 m2 60.1 (17.6-110.7) 60.4 (15.5-116.7)
Mean serum creatinine level (range)
µmol/L 88.7 (40.7-279.3) 87.2(45.1-421.7)
mg/dL 1.00 (0.46-3.16) 0.99(0.51-4.77)
Mean serum cystatin C level (range), mg/L† 1.15 (0.65-3.77) 1.14(0.61-4.40)
BSA = body surface area; mGFR = measured glomerular filtration rate.
* Diabetes was defined as either hemoglobin Alc >6.5% or prescription of antidiabetic medication. Hypertension was defined as prescription
of antihypertensive medication.
† To convert serum cystatin C from mg/L to nmol/L, multiply by 74.9.
Appendix Table 3. Characteristics of the Total lohexol Subpopulation (n = 570) Characteristic Median First Quartile Third Quartile
Age, y 76.9 73.5 82.6
Female sex, % 43 NA NA
Height, m 167 160 172
Weight, kg 77.0 68.0 85.0
BSA* 1.86 1.72 1.97
Serum creatinine level
µmol/L 80.4 68.1 98.1
mg/dL 0.91 0.77 1.11
Serum cystatin C level, mg/L† 1.05 0.91 1.29
mGFR, mL/mm per 1.73 m2‡ 60.7 48.9 71.5
BSA - body surface area; mGFR - measured glomerular filtration rate; NA - not applicable. * Dubois formula: body surface = 0.20247 X height0"725 X weight0"425.
† To convert serum cystatin C from mg/L to nmol/L, multiply by 74.9.
Appendix Table 4. Main Characteristics of the Total lohexol Population Categorized by mGFR
Characteristic Total Sample mGFR ≥60
mL/min per 1.73 m2 mGFR of 30-59 mL/min per 1.73 m2 mGFR <30 mL/min per 1.73 m2 Participants, n (%) 570 297 (52.1) 256 (44.9) 17 (3.0) Mean age, y 78.5 76.5 80.4 84.3 Age group, n (%) 70-74 y 210 (36.8) 142 (47.8) 67 (26.2) 1 (5.9) 75-79 y 152 (26.7) 85 (28.6) 63 (24.6) 4 (23.5) 80-84 y 104 (18.2) 48 (16.2) 52 (20.3) 4 (23.5) 85-89 y 69 (12.1) 19 (6.4) 45 (17.6) 5 (29.4) ≥90 y 35 (6.1) 3 (1.0) 29 (11.3) 3 (17.6) Diabetes mellitus, n (%)* 137 (24.0) 67 (22.6) 64 (25.0) 6 (35.3) Arterial hypertension, n (%)* 437 (76.7) 204 (68.7) 218 (85.2) 15 (88.2) Myocardial infarction, n (%) 85 (14.9) 28 (9.4) 52 (20.3) 5 (29.4)
Mean systolic blood pressure (range), mm Hg 145.0 (89.0-238.0) 145.6 (96.0-221.5) 145.0 (89.0-238.0) 134.5 (91.0-191.5)
Mean diastolic blood pressure (range), mm Hg 82.3 (46.0-129.0) 83.7 (46.0-128.5) 81.4 (51.5-129.0) 72.0 (54.0-91.0)
Mean hemoglobin level (range), mmol/L† 8.4 (5.9-11.9) 8.6 (5.9-10.7) 8.3 (6.2-11.9) 7.6 (6.5-9.1)
Mean albumin level (range), g/Lf 40.4 (30.8-51.9) 40.8 (32.0-50.1) 39.9 (30.8-51.9) 38.9 (35.1-44.9)
Mean C-reactive protein level (range), mg/L† 3.4 (0.23-44.2) 3.2 (0.23-44.2) 3.6 (0.25-42.2) 5.2 (0.38-20.0)
Mean serum creatinine level (range)
µmol/L 87.9 (40.7-421.7) 71.7 (40.7-105.2) 100.1 (46.0-218.4) 187.8 (99.0-421.7)
mg/dL 0.99 (0.46-4.77) 0.81 (0.46-1.2) 1.13 (0.52-2.5) 2.12 (0.46-4.8)
Mean serum cystatin C level (range), mg/L† 1.15 (0.61-4.40) 0.93 (0.61-1.44) 1.31 (0.82-2.36) 2.39 (1.38-4.40)
Mean albumin-creatinine ratio (range), mg/g 86.3 (0.01-10 201.8) 23.6 (0.01-765.4) 125.5 (0.01-10 201.8) 607.5 (5.6-6271.1)
Albuminuria (≥30 mg/g), n (%) 135 (23.7) 49 (16.5) 75 (29.3) 11 (64.7)
mGFR = measured glomerular filtration rate.
* Diabetes was defined as either hemoglobin Alc >6.5% or prescription of antidiabetic medication. Hypertension was defined as prescription
of antihypertensive medication.
† To convert hemoglobin from mmol/L to g/L, divide by 6.21. To convert albumin from g/L to g/dL, multiply by 0.1. To convert C-reactive protein from mg/L to nmol/L, multiply by 9.524. To convert cystatin C from mg/L to nmol/L, multiply by 74.9.
Appendix Table 5. BIS Models (Log Scale, Learning Sample, n = 285) in Persons Aged 70 y or Older
Model Model Fit
RMSE (95% Cl)* R2 (95% Cl)*
Creatinine 0.187 (0.171-0.203) 0.590 (0.507-0.674)
Creatinine, age, sex 0.150(0.134-0.166) 0.738 (0.667-0.808)
Cystatin C 0.145 (0.132-0.159) 0.753 (0.698-0.808)
Cystatin C, age, sex 0.138 (0.127-0.149) 0.778 (0.727-0.828)
Creatinine, cystatin C 0.139 (0.126-0.153) 0.773 (0.723-0.824)
Creatinine, cystatin C, age, sex 0.121 (0.110-0.133) 0.828 (0.785-0.871)
BIS = Berlin Initiative Study; RMSE = root mean-square error.
Appendix Figure. Models with change of slope for creatinine.
Appendix Table 6. Descriptive Analysis of mGFR and eGFR Equations in the Validation Sample and Total
lohexol Subpopulation
Equation Validation Sample (n = 285) Total lohexol
Subpopulation (n = 570) Mean, mL/min per 1.73 m2* Median, mL/min per 1.73 m2* SD, mL/min per 1.73 m2* 25th Percentile, mL/min per 1.73 m2* 75th Percentile, mL/min per 1.73 m2* GFR Prevalence <60 mL/min per 1.73 m2, n (%) GFR Prevalence <60 mL/min per 1.73 m2, n (%) mGFR 60.49 61.16 16.75 49.14 71.71 134 (47.0) 273 (47.9) BIS1 60.60 60.92 13.70 50.67 70.53 139 (48.8) 287 (50.4) BIS2 60.57 61.31 14.50 50.94 71.73 137 (48.1) 270 (47.4) Cockcroft-Gault adjusted for BSA
63.23 62.38 18.60 51.75 74.41 127 (44.6) 257 (45.1) MDRD 71.69 72.55 19.24 58.91 86.02 74 (26.0) 158 (27.7) CKD-EPI 69.43 73.08 17.31 57.91 84.40 84 (29.5) 172 (30.2) CysC1† 70.31 69.87 21.95 56.04 85.46 90 (31.6) 183 (32.1) CysC2† 63.71 63.08 19.31 50.79 75.86 121 (42.5) 243 (42.6) CysC3† 69.81 68.82 19.72 57.11 84.67 84 (29.5) 181 (31.8)
BIS = Berlin Initiative Study; BSA = body surface area; CKD-EPI = Chronic Kidney Disease Epidemiology; CysC = cystatin C; eGFR = estimated glomerular filtration rate; MDRD = Modification of Diet in Renal Disease; mGFR = measured glomerular filtration rate. * Bias was defined as difference between eGFR and mGFR for each equation. Mean, SD, median, and percentiles refer to these differences. † Standardized cystatin C values were converted by formula (-0.105 + 1.13 × cystatin C) before being used for the equations CysC1, CysC2, and CysC3 (see Appendix 2).