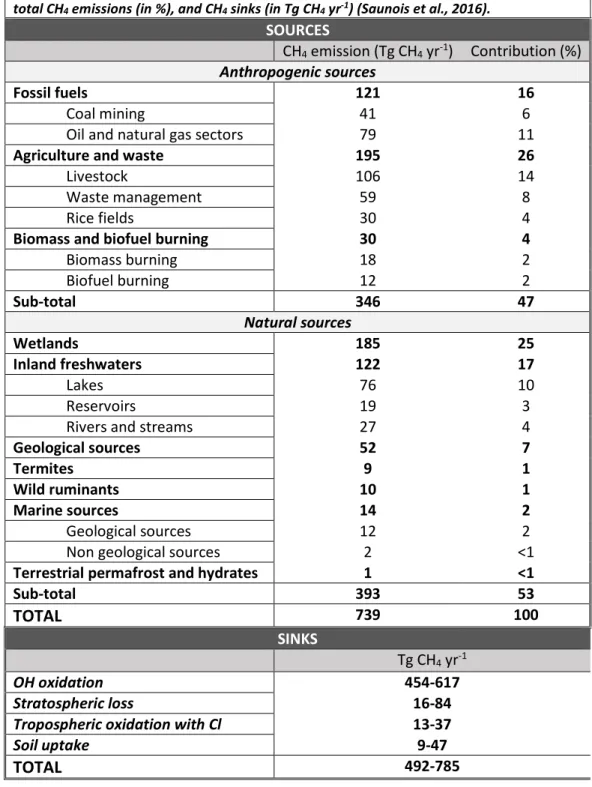
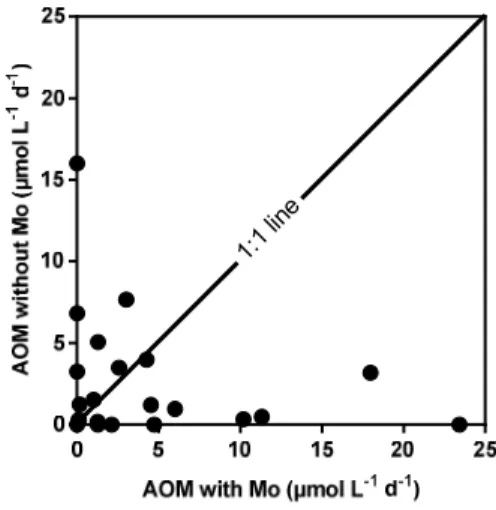
Biogeochemical processing of greenhouse gases (methane and nitrous oxide) in meromictic lakes
Texte intégral
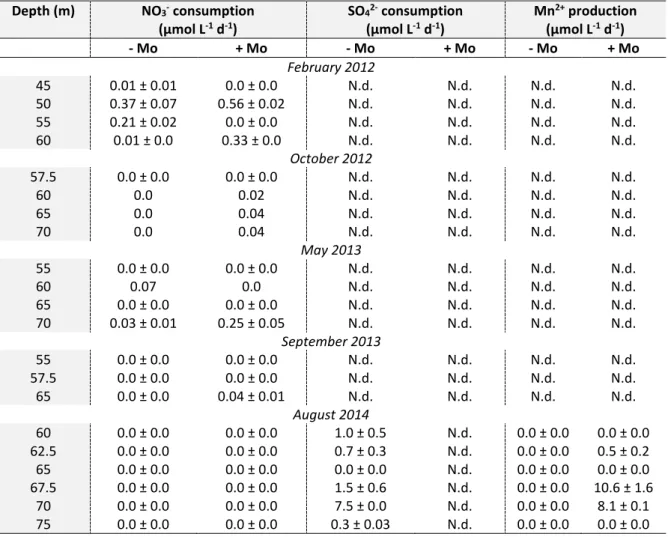
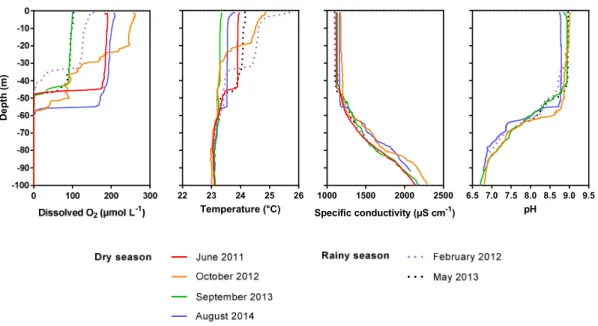
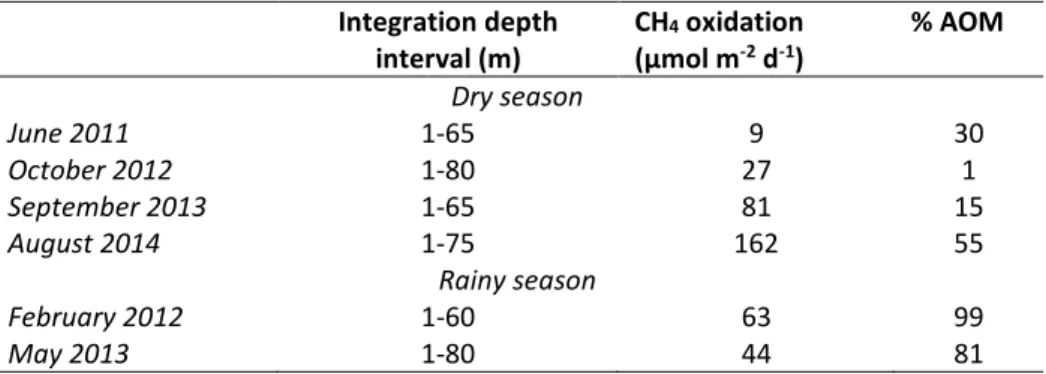
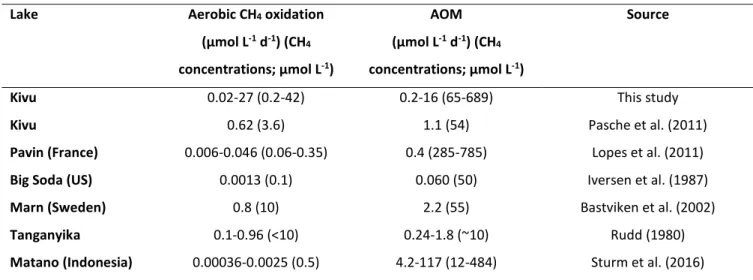
Figure

Documents relatifs
La chasse au Renne et au Cerf fut donc très différente en raison de plusieurs paramètres qui sont liés à la physiologie et à l’éthologie de chacune des deux espèces, et
Cruse and colleagues reported 1 that a new electroencephalography (EEG)-based tool was able to show that 3 out of 16 vegetative state (VS) patients performed a motor imagery
Les différents constats de ce projet de fin d’études : évolution de la conception de l’environnement, difficultés rencontrées dans l’obtention des marchés publics, mise
I think that Bourdieu does violence to Wittgenstein’s thinking regarding the identification of the sources of illusions conveyed in our language: In
Les huiles essentielles sont insolubles dans l’eau, elles doivent être dispersées dans un peu d’alcool ou de préférence de bain moussant, de base neutre pour le bain ou de
The impact of PM10 exposure on lung function decline was contrasted to tobacco smoking by comparing patterns of associations at the gene- and pathway level, as well as
In this Letter, we explore a high-resolution (R= 6000) simple stellar population (SSP) the- oretical spectral energy distribution (SED) li- brary searching for spectral indices
Autrefois, et jusqu’à ce jour dans certaines familles, le mariage était souvent une « affaire »arrangée ou du moins « facilité »par la classe d’âge des aînés .Il va de soi
