POLICY BRIEF
SUSTAINING LOCAL LIVELIHOODS OF FOREST – DEPENDENT
VILLAGES AND FOREST MANAGEMENT UNDER THE OPERATION
OF EAST-WEST ECONOMIC CORRIDOR IN VIETNAM AND LAOS
By HCE Team
Correspondent: Hoang Thanh Long, Dao Duy Minh, Manivanh LOBRIAYAO, Bui Duc Tinh
Hue College of Economics, Hue University 100 – Phung Hung, Hue City, Vietnam Email: [email protected]
I. Introduction
• East-West Economic Corridor (EWEC) is economic
development program initiated by Mekong
Subregion countries
• After 10 years of operation, EWEC has made
significant
contribution
to
socio-economic
development, but also caused impacts on local
livelihoods and natural forest resources
II. Key findings
1. Greater connection and regional trading activities
2. Increased considerably income and social welfares
of forest dependent villagers with EWEC
3. Highly efficiency on forest community-based
management
4. Pressures on natural resources, particularly
natural forest resources
III. EWEC benefits and drawbacks
1. Total goods export turnover
transported on EWEC : US$ 1,351
mil in 2008 (7.5 times higher than
that of 2002)
Table 1: The export- import value between Vietnam and Laos
through the Lao Bao Border Gate in EWEC
(Unit: $ million)
2010 2011 2012 2013 2014
1. Export-import value 261.84 413.83 364.85 504.53 485.55
Export 34.25 57.78 72.08 61.85 47.14
Import 227.59 356.05 292.77 442.68 438.41
2. Main export goods 34.24 57.77 72.07 61.84 47.13
Consumable goods 17.12 28.89 36.04 30.92 23.57
Construction materials 10.27 17.33 21.62 18.55 14.14
Agricultural products 6.85 11.55 14.41 12.37 9.42
3. Main import goods 134.97 206.45 151.35 285.41 346.02
Timber 61.96 133.86 93.99 254.56 319.38
Gypsum 3.65 3.41 3.88 3.82 2.24
Copper 69.36 69.18 53.48 27.03 24.4
2. EWEC has been creating opportunities
for households’ income improvement
Activities
Unaffected Affected
Comparison in 2015
2005 2015 2005 2015
Value % Value % Value % Value % Value % Sig. Cultivation 12.06 54.964 39.20 54.820 14.13 52.416 47.02 56.275 1.69 4.312 0.788 Animal raising 3.78 17.237 9.52 13.314 4.49 16.644 5.95 7.114 -4.35 -45.704 0.336 Non-timber exploitation 1.99 9.085 12.53 17.519 3.41 12.655 20.33 24.334 5.15 41.147 0.464 Service 2.54 11.550 3.79 5.297 1.51 5.611 1.07 1.286 -2.85 -75.331 0.002 Others 1.57 7.163 6.47 9.050 3.42 12.674 9.19 10.991 1.51 23.411 0.588 Total 21.95 100 71.50 100.00 0 26.95 100.00 0 87.66 100.00 0 1.16 0.914
Table 2: Households’ income structure between 2005 and 2015 Unit: million VND/year/household
3. Benefits from forest
community-based management
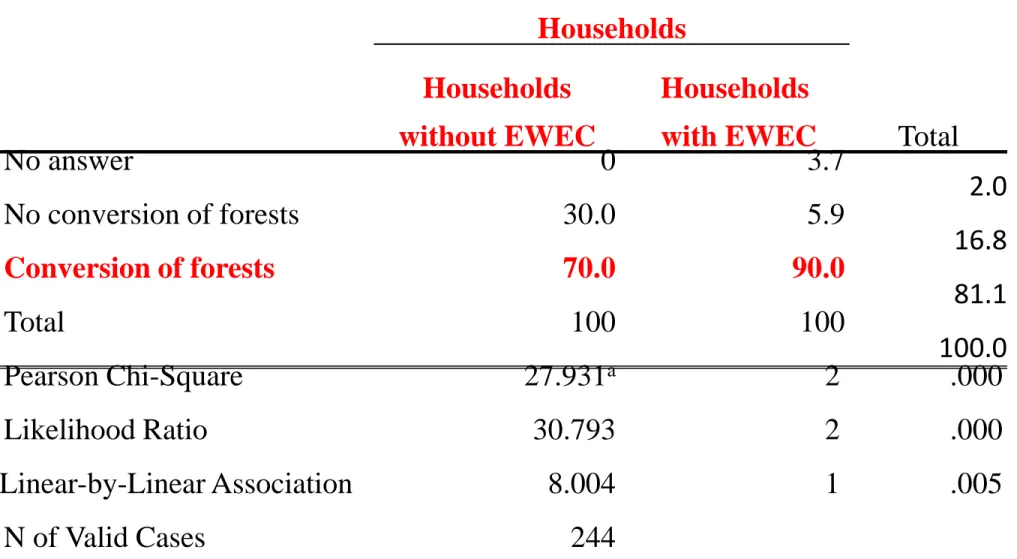
4. Increasing forest and
agricultural land converted into
cash-crops land
Table 3: Ratio of household converted forest land into cash crops Households Total Households without EWEC Households with EWEC No answer 0 3.7 2.0 No conversion of forests 30.0 5.9 16.8 Conversion of forests 70.0 90.0 81.1 Total 100 100 100.0 Pearson Chi-Square 27.931a 2 .000 Likelihood Ratio 30.793 2 .000 Linear-by-Linear Association 8.004 1 .005 N of Valid Cases 244
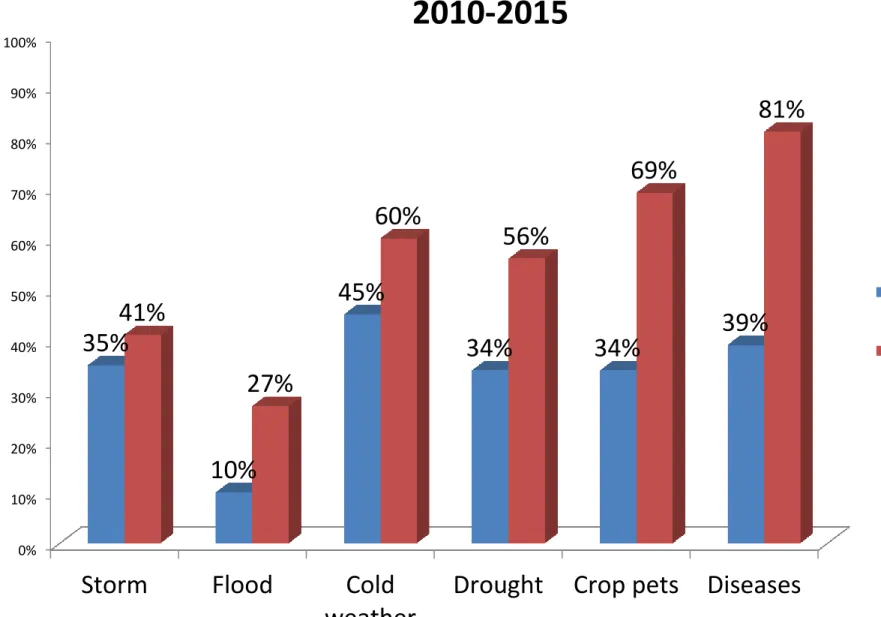
5. Potential risks and
uncertainties, inequity
Figure 1. The proportion of households encountered shocks in
2010-2015
0% 10% 20% 30% 40% 50% 60% 70% 80% 90% 100%Storm Flood Cold weather
Drought Crop pets Diseases 35% 10% 45% 34% 34% 39% 41% 27% 60% 56% 69% 81% Dak Krong Huong Hoa
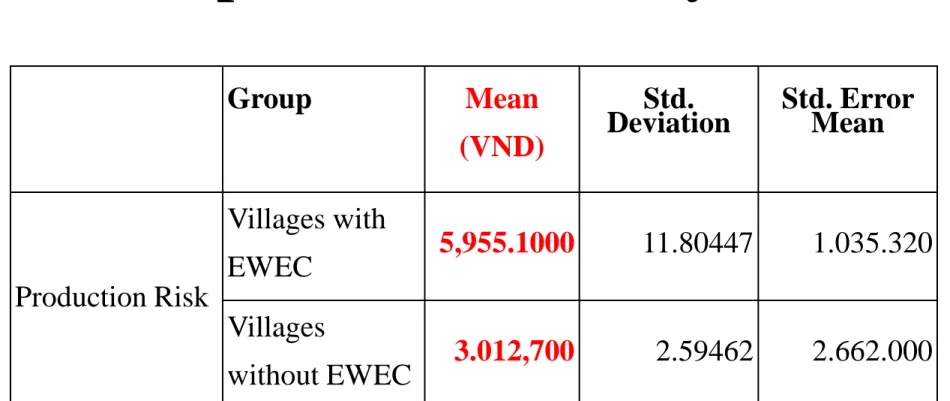
Table 4: Comparing damaged cost
due to production risks by EWEC
Group Mean
(VND)
Std.
Deviation Std. Error Mean
Production Risk
Villages with
EWEC 5,955.1000 11.80447 1.035.320
Villages
without EWEC 3.012,700 2.59462 2.662.000