Unlversit6 de Sherbrooke
3U5b0077115'40
.3
AN ANNOTATED AND CLASSIFIED BIBLIOGRAPHY OF
SOFTWARE METRICS PUBLICATIONS
1988 TO 1994
^-by
Qiang Ma
A thesis submitted to the Departement de mathematiques et d'informatique in partial fulfillment of the requirements for the degree of mature es sciences (M.Sc.)
FACULTE DES SCIENCES
UNIVERSITE DE SHERBROOKE
Sherbrooke, Quebec, Canada, September 1996
1*1
National Library of Canada Acquisitions and Bibliographic Services 395 Wellington Street Ottawa ON K1AON4 Canada Bibliotheque nationale du Canada Acquisitions et services bibliographiques 395, rue Wellington Ottawa ON K1AON4 CanadaYour file Volre reference
Our file Notre reference
The author has granted a
non-exclusive licence allowing the National Library of Canada to reproduce, loan, distribute or sell copies of this thesis in microform,
paper or electronic formats.
The author retains ownership of the
copyright in this thesis. Neither the
thesis nor substantial extracts from it may be printed or otherwise
reproduced without the author's permission.
L'auteur a accorde une licence non exclusive permettant a la
Bibliotheque nationale du Canada de
reproduire, preter, distribuer ou vendre des copies de cette these sous
la forme de microfiche/fihn, de
reproduction sur papier ou sur fonnat electronique.
L'auteur conserve la propriete du droit d'auteur qui protege cette these.
Ni la these ni des extraits substantiels de celle-ci ne doivent etre imprimes
ou autrement reproduits sans son autonsation.
0-612-21799-X
ABSTRACT
With the growth of the software industry, the measurement of software plays an ever increasing role. In order to provide software metric researchers and practi-tioners with references so they can quickly identify the references of particular interest to them, over 60 of the many publications on software metrics that have appeared since 1988 are classified into four tables that comprise, respectively, (1)
Metrics through the Life Cycle, (2) Classic Metrics, (3) Programming Language
Metrics, and (4) New Metrics. Table 1 serves as a complete list of all the classified
publications while Table 2, Table 3 and Table 4 are subsets of Table 1. The subset
tables present more detailed information than Table 1. The bibliographic reference section contains brief summaries of the publications in the classified tables. As a continuation of the 1988 survey done by V. Cote, P. Bourque, S. Oligny and N. Rivard through the paper, Software metrics: an overview of recent results", this project was conducted to discover the current trends in software metrics practice, and to report the trend movement from the 1988 paper until now by comparison of the results from the two surveys. All the table comparisons from the two surveys are given in percentages. As a survey, we are fully aware of the limitations of our collection out of the wealth of the publications in the software metrics field, but we are confident that our survey is a good indicator of the practice in the software metrics field.
ACKNOWLEDGMENTS
This thesis in written in memory of the late Vianney Cote, my original research director. I thank him for introducing me to the software metrics area and choosing this significant topic.
I thank my current directors of research, Jean Goulet and Plerre Bourque for directing my thesis and making its completion possible. I thank Jean Goulet for his correction of the final version of this thesis. I thank Pierre Bourque for his detailed advice and verification of my classification by reviewing the tables based on the table classification schema. I thank Guy Custeau for offering useful suggestions. I thank my lovely baby, Jared, for giving me the night time to complete this thesis. I thank my husband, Hal, for his continuing support of my studies.
TABLE OF CONTENTS
ABSTRACT ... 11 ACKNOWLEDGMENTS ... iii TABLE OF CONTENTS...iv LIST OF TABLES ... v CHAPTER 1 INTRODUCTION ...1CHAPTER2 REFERENCE TABLES AND SCHEMA...5
2.1 Metrics through the Life Cycle ...5
2.2 Classic Metrics ... 10
2.3 Programming Language Metrics ... 13
2.4 New Metrics ...14 CHAPTER 3 COMPAmSON ...19 3.1 Comparison of Table 1 ...19 3.2 Comparison of Table 2 ...21 3.3 Comparison of Table 3 ...22 3.4 Comparison of Table 4 ...23
CHAPTER 4 ANNOTATED BIBLIOGRAPHY ...24
CHAPTER 5 SUMMARY ...47
TEXT REFERENCES ...49
LIST OF TABLES
TABLE 1 Metrics Through The Life Cycle ...9
TABLE 2 Classic Metrics ...11
TABLE 3 Programming Language Metrics ...13
TABLE 4 New Metrics ... 15
TABLE 5 Comparison of Life Cycle Metrics Tables ...20
TABLE 6 Comparison of Classic Metrics Tables ...21
CHAPTER 1
INTRODUCTION
When you can measure what you are speaking about, and express it in numbers, you know something about it; but when you cannot measure it, when you cannot express it in numbers, your knowledge is of a meager and unsatisfactory
kind.
(Lord Kelvin, Popular Lectures and Addresses, 1889)
Measurement lies at the heart of many systems which govern our lives [FENT91]. Measurements in economic systems determine price and pay increases. Measurements in radar systems enable us to detect aircraft through clouds. Measurements in medical systems enable the diagnosis of specific illnesses. But measurement is not solely the domain of professional technologists. We all use it in everyday life. We can measure the height of our children to make sure we buy the right size clothes. We can calculate the total bill in a shop to make sure we are given the right change.
Since software has entered almost every corner of society, the need for measurement in the software field is unavoidable in order to confirm the accuracy and the quality of the software. For example, the need to measure the cost of various processes within software production, the need to measure the productivity of staff in order to determine pay settlements for different divisions, the need to measure the quality of the software products which are developed, the need to measure attributes of existing products and current processes to be able to make
predictions about future ones, etc.
Therefore, software metrics as a unit of measurement of a software product or software related process is used to govern software development and management into a discipline, an engineering activity [HAME85][FENT91]. In this study, by
'software metrics publication , we mean all publications related to software measurement, software metrics, and statistical and mathematical software engineering models. A publication on validation of metrics is also considered as a software metrics publication. Due to the large number of publications in the software metrics field, this survey is unable to include a list of all of them. Only selected publications are used.
The first step of the project was to collect papers through inter library search with the key words software metrics", "software engineering", "quality assurance",
'software measurement . Over three hundred papers came out of the initial search. During the process of writing this thesis, some of the papers were added to the selection from some key software journals, like the Journal of Systems and Software, or IEEE Transactions on Software Engineering. In deciding how to reduce the total number of papers, we examined more closely in how much detail software metrics is covered, and we selected the papers based on the criteria that their central theme should be software metrics.
This resulted in over 60 publications on software metrics that have appeared since 1988 being summarized and classified in order to accomplish the following two goals:
1). Provide software metrics researchers and practitioners with reference information so they can quickly identify the publications of particular interest to them.
Although software metrics is still a relatively new field in software engineering, it has already been catching the attention of researchers and practitioners for some time. Many publications have appeared since the groundwork on software metrics in the seventies. In order to shed some light for researchers and practitioners on the
publications on software metrics since 1988, and omit some unnecessary steps in their research and practice, selected publications are classified into tables and annotated. By reading the annotations and tables presented in this survey, it is the
aim of this project:
• to help beginners find the starting point to navigate in the field of software metrics;
• to guide them from the general topic to the specific;
• to help software metrics professionals find out what is available for their work, examples offered and valuable lessons learned, by their fellow colleagues;
• to help the software metrics researchers and practitioners choose the unexplored topics as their research interest in the domain of software metrics by observing the current literature survey results.
2). Compare the results of this literature survey with the survey published in the
1988 paper.
This survey is a continuation of the project done by V. Cote, P. Bourque, S. Oligny and N. Rivard through the paper, "Software metrics: an overview of recent results" in 1988 [COTE88]. By comparison of the results, this project was conducted to discover the current trends in software metrics practice, to report the trend movement from the 1988 paper until now, and predict the future trends. Three of our tables can be directly compared with the tables from that survey : "Metrics Through The Life Cycle", "Classic Metrics", and "Programming Language Metrics". Only two of the papers of the current survey are from early
1995, so the current survey is labeled "1994".
This survey is organized into five chapters. Chapter 2 contains the explanation of the table classification schema used in the study, and the tables resulting from it.
Chapter 3 is a comparison of the 1988 and 1994 surveys. In Chapter 4, table
references are annotated. In Chapter 5, a summary of this study is presented. Finally, the text references end the whole survey. Table references contain all the publications appearing in the tables. For each table reference, a brief summary is
written to give the reader a general feel of that publication. Text references contain the publications appearing only in the body text, and not in any table. If a software metrics publication appears in both a table and the body of the text, it is only included in the table references. All the publications are identified with a four letter code together with a two digit year specification, e.g., FENT90, which appears both in the body text and. in the Label column of the tables. An extra letter (A7B/C) is introduced for the sake of code uniqueness. In the short summary of the reference entry, we state the main characteristics of that paper, so the reader can understand the classification. For example, by looking at the words "Halstead's Software Science Volume and Effort and McCabe's Cyclomadc Complexity" in
[BOWM90], the reader will see why this paper belongs to the "Classic Metrics' table, under the columns "HSS" and <<MCCM.
CHAPTER 2
REFERENCE TABLES AND SCHEMA
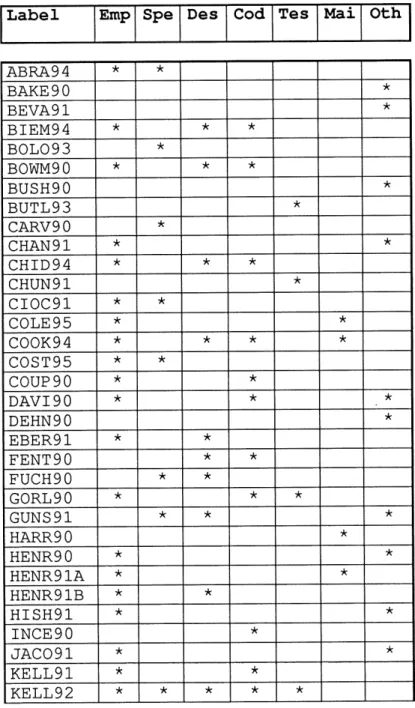
There exist many schema for metrics classification. One chooses the different schema according to one's need. Here, we are going to explain each schema used in our four classified tables: Metrics through the Life Cycle (Table 1), Classic Metrics (Table 2), Programming Language Metrics (Table 3) and New Metrics (Table 4). Metrics through the Life Cycle (Table 1) serves as the complete list of all the
references appearing in this survey. All the other tables (Classic Metrics, Programming Language Metrics and New Metrics) are subsets and cross references to Table 1. These tables classify the papers each with a different perspective, based on each table's classification schema.
Every entry in the subset tables can be found in Table 1, but not all the entries of Table 1 can be found in a subset table, especially some of the entries listed under the "Others" column of Table 1. There is also some overlapping between subset tables. For example, Table 2 covers the papers mainly on classic metrics while Table 4 concerns the "new metrics". If for example an entry in Table 4 exploits a classic metric to some significant degree, a researcher interested in the classic metric might find some valuable ideas or definitions there, so it will be listed in Table 2
also.
2.1. Metrics through the Life Cycle
(Emp), Specification (Spe), Design (Des), Coding (Cod), Testing (Tes), Main-tenance (Mai) and Others (Oth).
The Empirical column would be checked if the paper includes some empirical
validation with real data or includes a detailed discussion of an industrial case study. An empirical paper contains measurement conducted on source data. An empirical paper can be a report from a real measurement practice, projects or a paper on metrics with some data collection and statistical analysis. Software metrics publications are generally empirical due to the nature of the field. It is natural that most papers on measurement should have measurement data since their aim is to measure certain aspects of software based on a given data set. For example, in a software quality metrics publication, some actual measure on software must be present, otherwise, there will be no sound evidence of the quality of the software.
Example: [GORL90] describes an experiment of debugging effort estimation using
software metrics, therefore, it is checked under Empirical. [CHAN91] not only contains d description of some software reliability growth models but also presents them with statistical samples. Therefore it is checked under Empirical also.
We often consider the software life cycle as consisting of several phases, each phase having a defined starting point and ending point. While in practice the phases tend to overlap, it is important to define each phase and the activities in each phase as accurately as possible in order to define precisely those metrics that are
phase-dependent [CONT86].
Here one waterfall model [JONE90] is adapted to our phase definition and the columns of Specification (Spe), Design (Des), Coding (Cod), Testing (Tes) and
Maintenance (Mai) correspond to each of these phases. The papers checked under each of them are the ones that contain metrics dealing with the issues existing in that particular phase. For example, a paper checked under the Maintenance column could contain some discussion on functional metrics, but its main purpose is to present a metric (or metrics) on the issue of maintenance . In this case, it will be checked under Maintenance only. But if the discussion on functional metrics shows some real depth, then it Is checked under Specification also.
Specification - This phase should produce a complete description of the required functions and non functional characteristics of the software. It should also address the question of resource needs and preliminary budget estimates.
Example: [BOL093] supports a metric-driven approach to software development by
incorporating, with relative ease, the metric computation into the software specification environment. Therefore, it is checked under Specification.
Design - This phase should specify the overall system configuration, the implementation language, major modules and their interfaces, configuration control and data structures, and a testing plan. It should produce more detailed module specifications including their expected size, the necessary communication among modules, algorithms to be used, interface data structures, and internal control structures. It should highlight important constraints relative to timing or storage, and include a plan for testing the individual modules.
Example : [OFFU93] deals with metrics on module coupling. Since coupling is a design
issue, it is checked under Design.
Coding - This phase should produce an implementation of the modules in the chosen language. The papers appearing under this column are also often listed under the Design column. For example, coupling and complexity are issues in both the design and coding phases, so the papers dealing with them will often be checked under the Coding and Design columns. Papers listed under the Coding
column can often be found in the Programming Language Metrics Table (Table
3). If a paper deals with the measurement of some particular programming
language, then it will be listed not only under this coding column but also in Table
3. Sometimes a publication presents some measure on code, like lines of code,
without specifying any language; it will then be checked under the Coding column in Table 1, but it will not be in Table 3.
Example: [L090] discusses the size estimation for expert systems applications. It covers the topics of lines of code, function points^ and software science. A COBOL'based
program is used for the analysis of sizing. It is listed under the Design and Coding columns in Table 1, and the COBOL column in Table 3. [CHID94] measures programs coded in C and Smalltalk so it is checked in Table 1 and in Table 3.
Testing - This phase should make sure that the product does exactly what it is
supposed to do. It should confirm the quality of the product (indirectly of the
process also), find and eliminate any residual errors from previous stages, validate the software as a solution to the original problem, demonstrate the presence of all
specified functionality in the product, and estimate the operational reliability of the system.
Example: [MYER92] proposes a parameterized metric to measure the complexity of software testing, so it is checked under Testing.
Maintenance - The maintenance effort revisits all the other stages of the software life cycle. Changes may be required to eliminate errors in the product, to provide additional capabilities or to allow the product to be used in a new environment. Each modification requires some planning, specification, design, coding and testing. Some modifications may require very little effort at a given stage, but just as much attention must be given to correct methodology in maintenance as in the original development. Some changes, however, will involve so much effort that they amount to a new development project.
Example: [LEWI89] introduces a methodology for integrating maintainability into
software early in the development process using metrics. Therefore it is checked under
M.aintena.nce.
Others - Since Table 1 serves as a complete list of the references, the Others column will cover the metrics papers included in this survey that are not phase specific, like process and resource metrics. It could also be that the papers are about general issues like quality, predictability and usability. It could also cover the foundation works in software metrics and general comments on metrics without exploration of a particular one.
Example: In the theoretical report paper [RENG91]> metrics as indicators of usability
based on performance are identified and assigned to generic groups. Usability metrics based on performance are proposed. Since usability metrics cannot be directly classified into a specific phase of the life cycle, we classify it under the <<0thers>> column.
Table 1. Metrics Through The Life Cycle
Label Emp Spe Des Cod Tes Mai Oth ABRA94 BAKE 90 BEVA91 BIEM94 BOL093 BOWM90 BUSH90 BUTL93 CARV90 CHAN91 CHID94 CHUN91 CIOC91 COLE95 COOK94 COST95 COUP 90 DAVI90 DEHN90 EBER91 FENT90 FUCH90 GORL90 GUNS 91 HARR90 HENR90 HENR91A HENR91B HISH91 INCE90 JAC091 KELL91 KELL92 •A; * * * * * * * * * * * * * * * * * * * * * * * * * * * * * * * * * * * * * * * * * *• * * * * * * * * * * * * * * * * * * * * * * * *
Label Emp Spe Des Cod Tes Mai Oth KHOS94 LAKS91 LEWIS 9 L090 LUBI90 MALA90 MAYR91 MORE 93A MORE 93B MUNS90 MUNS91 MUNS92 MUNS93 MYER92 OFFU93 OMAN 94 PFLE93 REDM90 REIF90 RENG91 RISI94 SAMA91 SCHN91 SEARS 3 SELB91 SHEP91 SHEP94 STARS 4 VOAS93 WRIG91 ZAGE93 * * * * * * * * ^ * * * * * * * * * * * * * * *• * * * * * * * * * * * * * * * * * * * * * * * * * * * * * * * * * * * * * * * * •* * * * * * 2.2. Classic Metrics
We consider Halstead's software science (HSS), McCabe's cyclomatic complexity
(MCC), lines of code (LOG), and Albrecht's function points (AFP) as "classic'
metrics [COTE88]. The reason is that they are the earliest of the well-established metrics. Many other metrics have been created since then, as can be seen in the publications listed in the "New Metrics" table.
All the publications of Table 2 discuss in detail the above metrics. This table is a
subset of the entries in Table 1. The Classic Metrics table (Table 2) is divided into Label, HSS, MCC, LOG andAFP.
Table 2. Classic Metrics Label HSS MCC LOC AFP ABRA94 BOWM90 COOK94 COUP 90 HENR90 HENR91B INCE90 KELL91 KHOS94 LAKS91 LEWIS 9 L090 LUBI90 MUNS90 MUNS92 MUNS93 MYER92 OMAN 94 REDM90 REIF90 SAMA91 SHEP94 WRIG91 * * ^ * * * * * * * * * * * * * * * * * * * * * * * * * * * * * * * * * * * * * * * * * * * * * * *
Here is a brief definition of the above classic metrics:
Software science considers a computer program to be a collection of tokens that can be classified as either operators or operands. All software science measures are functions of counts of these tokens [CONT86].
Example: [MUNS90] partly uses Halstead's metric to form a new metric. Since Halstead's software science is used for measuring in this paper, it is checked under HSS. McCabe's cyclomatic complexity is designed to measure the number of distinct paths through a particular program by representing the program with a graph and
counting the number of nodes and edges [HENR91B].
Example: [BOWM90] performs a simple experiment to determine if the training on
software complexity metrics integrated into an advanced COBOL programming class has any effect on program complexity based on Halstead's Software Science and McCabe's Cyclomatic Complexity. Therefore, it is checked under both HSS andMCC. A line of code is any line of program text that is not a comment or blank line, regardless of the number of statements or fragments of statement in the line. This specifically includes all lines containing program headers, declarations, and executable and non-executable statements [CONT86] .
Example: [LUBI90] measures software size by distinct lines of code. Therefore, it is checked under LOC.
Function points is used to measure the functionality delivered by the software to the user, in terms of the data it uses and generates. By counting the number of external inputs, external outputs, logical internal files, external interface files and external inquiry types delivered by the software, and by classifying them according to their complexity, a function point count is obtained. The measure is then adjusted for processing complexity using a multiplier obtained from rating a set of variables which characterize the software. The adjusted function point measure is the product of the unadjusted function point count and the processing complexity
adjustment factor [L090].
Example: [ABRA94] studies the measurement processes and scale transformations of function points. Therefore, it is checked under AFP.
2.3. Programming Language Metrics
The Programming Language Metrics table (Table 3) classifies the publications that present some measurements of code in specific programming languages. Any publication that mentions its data source coming from program coding in a specific programming language will be listed under the corresponding column in
this table. This table is divided into Label, Assembler (Ass), COBOL (Cob),
FORTRAN (For), Pascal (Pas), C (C) and Others (Oth).
The "Others" column covers programming languages which do not appear in the other columns (Ass, Cob, For, Pas, and C) in this table, such as ADA, Smalltalk, C++, etc. The publications listed in this table are a large subset of those listed under the Coding column in Table 3.
Example: [HENR91A] conducts an experiment on an actual product consisting of 193
procedures comprising about 15000 lines of C code, so it is listed under the C column in
Table 3.
Table 3. Programming Language Metrics
Label ASS Cob For Pas c Oth
BOWM90 CHID94 COLE95 COUP 90 DAVI90 PENT 90 GORL90 HENR91A KELL91 KELL92 KHOS94 L090 LUBI90 MAYR91 MUNS92 OFFU93 OMAN 94 REDM90 * * * * * * * * * * * * * * * * * * * * * * * * * * * * * •A-* * * * 13
Label ASS Cob For Pas c Oth RISI94 SAMA91 SCHN91 SELB91 WRIG91 ZAGE93 * * * * * * * * 2.4. New Metrics
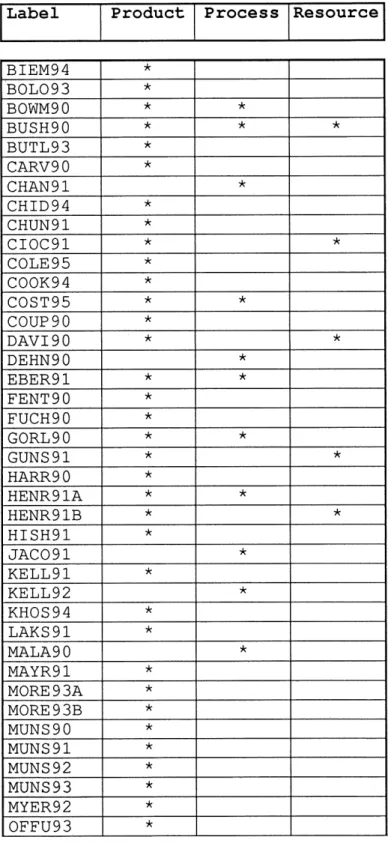
Far from limiting themselves to the classic metrics, researchers and practitioners have developed new ones. The strongest incentive behind this is probably the need for measuring specific things in a given situation and the fact that we don't know what to measure [COTE88]. Based on Fenton's framework [FENT91], the New Metrics table (Table 4) is divided into four columns: Label, Process, Product, and Resource. Since this table includes all the metrics other than classic metrics, it covers most entries from Table 1.
Product refers to deliverables, artifacts or generally documents which arise from the software life cycle. Product metrics are the metrics that measure length, functionality, modularity, reuse, redundancy, and syntactic correctness of documents, module coupling and cohesiveness of design and code, understandahility of a specification document, maintainability of source code, complexity, usability and portability of software, etc. We also consider that the classic metrics (HSS, MCC,
LOC and AFP) are product metrics.
Example: [HARR90] develops a new model of software maintenance based upon a
quantitative decision rule which determines whether a given software module can be
effectively modified, or if it should instead be rewritten. Since maintainability belongs
to the measurement domain of product metrics, this paper is checked under Product.
Table 4. New Metrics
Label Product Process Resource BIEM94 BOL093 BOWM90 BUSH90 BUTL93 CARV90 CHAN91 CHID94 CHUN91 CIOC91 COLE95 COOK94 COST95 COUP 90 DAVI90 DEHN90 EBER91 FENT90 FUCH90 GORL90 GUNS 91 HARR90 HENR91A HENR91B HISH91 JAC091 KELL91 KELL92 KHOS94 LAKS91 MALA90 MAYR91 MORE 93A MORE 93B MUNS90 MUNS91 MUNS92 MUNS93 MYER92 OFFU93 * * * * * •/< * * * * * * * * * ^ * * * * * * * * * * * ^ * * *• * * * * * * * * * * * * * * * * * * * * 15
\m
Label Product Process Resource
OMAN 94 RENG91 RISI94 SAMA91 SCHN91 SEAR93 SELB91 SHEP91 SHEP94 STAR94 VOAS93 WRIG91 ZAGE93 * * * * * * * * * * * * ^ * * •* * * *
Process are software related activities which normally have a time factor. This means that they could simply be a time slice of any software project. Examples of processes include reasonably well-defined and coherent activities like constructing a specification document or developing a software system from requirements through its release to the customer.
Process metrics are the metrics used to measure process activities. Therefore, process metrics could be the metrics on time, effort, number of incidents of a specified type arising during the process. Process metrics could also be the measure of the cost, controllability, observability and stability of a process. Here, time refers to the duration of the process. Effort is measured by total staff-hours, -days, -weeks, etc., to complete a given task. This is usually recorded manually, and high precision should not be expected, particularly where staff divide their time between many different activities. Effort alone is inadequate as a measure of cost, since, for example, clerical effort to process incident reports will generally be charged at a lower rate than the time of highly-skilled staff who can diagnose and repair faults. Incidents refer to the number of requirement changes, number of specification faults found and number of bugs found during the process. Usually, cost is measured in monetary terms, and when we are concerned with the cost of developing and maintaining software, this can often be calculated as effort times labor rate, plus indirect costs and overhead. Some process metrics results cannot be calculated independently of one another.
Example: [GORL90] deals with debugging effort. Therefore it is checked under Process. [SELB91] quantifies ratios of coupling and strength and uses them to identify
error-prone system structures. Since coupling is an issue of product, it is checked under product. Since errors are incidents, it is checked under process also.
Resource refers to the miscellany of items considered as inputs to software production. Examples include pesonnel (individuals or teams), materials (including offices), tools (software, hardware) and methods. All of them have a market price. Elements which are considered to be resources for some processes are clearly products of other processes. This is true of software tools. For example a CASE tool is clearly a major product of the software company which developed it, whereas it is a resource for a company which uses it in its own design process.
Although generally tools may be considered as entities which are both products and
resources, it will be quite clear from the context that only one view is relevant. In the case of personnel considered as resource, we are especially interested in the attributes ofproductivity. We can only meaningfully talk about the productivity of a programmer with respect to some activity such as coding a particular program or coding during a particular period of time. Other apects of interest of personnel as individuals are experience, age or, as teams, size, structure, and communication skills. Example: [HENR91B] evaluates two design languages using software quality metrics. These languages are the software tools used in the design stage. Therefore, it is listed under Resource.
[BUSH90] gives a rationalized, theoretical overview of the subject of software
measurement, and a classification scheme (product, process and resource). Since it covers all three kinds of new metrics, it is checked under each of them.
[CIOC91] uses a measurement technique in an experiment which assesses comprehension and misinterpretation of requirements specifications. Since requirements specifications are the activities of product, and misinterpretation is an issue of resource, it is checked under product and resource.
[DAVI90] investigates subjective entropy, a new information-theoretic measure of program comprehensihility which accounts for semantics and pragmatics involved in programmer-program interaction. Since comprehensibility lies in the domain of resource metrics, it is checked under resource metrics. Semantic! are an issue of product, so it is also checked under product.
[STAR94] presents a set of metrics which measures the software issues from product,
process and resource perspectives. Therefore^ it is checked under product, process and
resource.
CHAPTER 3
COMPARISON
There are 64 publications classified in this survey and 124 in the 1988 survey. This
chapter will compare the findings in this survey with those in the 1988 survey. Since the table schema of the two surveys vary, the comparison will be done on the common ground. The results are presented in percentages. All the comparison tables have three columns: Metrics, 1994 and 1988. The Metrics column specifies the metrics compared, and the values in the 1994 and 1988 columns are the percentages of the presence of the corresponding metrics in that year's survey. We refer to the current survey as "1994" in this chapter.
3.1. Comparison of Table 1
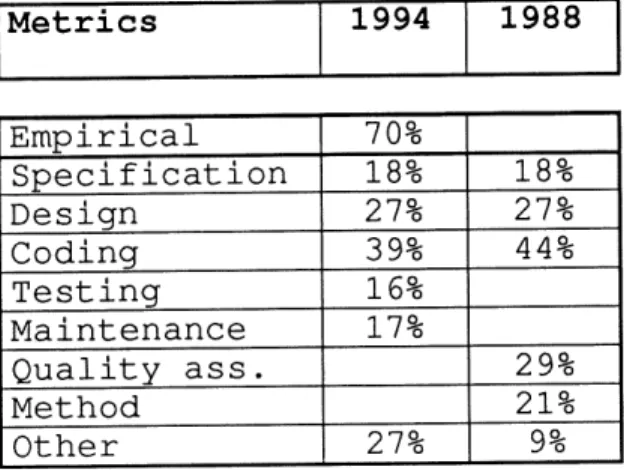
Comparison of Table 1 (Metrics through the Life Cycle) is given in Table 5. The
data is calculated according to the following formula:
number of checks in one individual phase column total number of references in the survey
By observing the data, we see that the percentages of specification and design metrics remain stable, and that the percentage of coding metric publications is declining. Some categories cannot be compared, due to the differences in the classification schema of the two surveys.
Table 5. Comparison of Life Cycle Metrics Tables Metrics 1994 1988 Empirical Specification Design Coding Testing Maintenance Quality ass. Method Other 70CT T8%-27% 39% 16% 17% 27% 18% 27% 44% 29% 21% 9%
First, it should be noted that most of the metric papers in the 1994 survey are empirical papers. It means that software practitioners are more careful about the applicability of their metrics. All the metrics validations and sample measurement results are the proof that the field of software metrics is becoming more rigorous. Since the 1988 survey, we would expect an increasing number of design metrics. But this is not happening. The following factors might be the reasons for this. First, broader interests among software metrics practitioners: rather then limiting themselves to the refining of the design metrics, they are exploring metrics from all possible angles of software. In other words, the metric practitioners are keen as to how software metrics can improve software. This is understandable since software metrics are still in an early stage of evolution, and need to define their territory. Software maintenance has been recognized as the single most expensive factor in a software project's life [LEWI89]. As the complexity level of a piece of software increases, the code becomes difficult to understand and therefore more likely to contain errors. Code containing errors must be modified, but that maintenance is non-trivial since the code is difficult to comprehend. To compound the problem further, it has been shown that programs cannot be made more maintainable by simply changing their code. This is the ripple effect of software maintenance which must be controlled at the earliest possible point in the life cycle. This reality
promotes maintenance metrics.
3.2. Comparison of Table 2
Comparison of Table 2 (Classic Metrics) is given in Table 6. The data is calculated
according to the following formula:
number of checks in one classic metric column total number of references in the classic metrics
There is a declining percentage of the publications on classic metrics: 60% (74 out
of 124) of the papers in the 1988 survey deal with classic metrics with only 36% (23 out of 64) in this survey.
Table 6. Comparison of Classic Metrics Tables Metrics 1994 1988^ HSS MCC LOG AFP 74% 74% 52% 17% 45% 42% 40% 15%
According to the data, function point publications still remain low in number as in the 1988 survey, and the even usage of Halstead's software science, McCabe>s cyclomatic complexity and lines of code has been broken. In the current survey, the metrics most used are HalsteacTs software science and McCabe's cyclomatic complexity, followed by lines of code and function points.
The increase of the number of publications on Halstead's software science and McCabe's cyclomatic complexity could be due to the increasing interest in quality and complexity metrics, since McCabe's theory applies graph theoretic measures to
software, associating the complexity of the control flow graph to the complexity of the program, while Halstead's theory develops measures based on the counts of operators and operands in the program [KELL91]. As the software industry becomes more and. more standardized, modularity, reusability, reliability and maintainability have been the key issues. These issues influence the quality and complexity of the software. Lower complexity is an important contribution to software quality.
3.3. Comparison of Table 3
Comparison of Table 3 (Programming Language Metrics) is given in Table 7. The
data is calculated according to the formula:
number of checks in one language metric column
total number of references in the programming language metrics
Table 7. Comparison of Programming Language Metrics Tables
Metrics 1994^ ^.988 Ass Cob For Pas c PL/1 Oth ~Q% 21% 13% 25% 63% 46% 21% 19% 40% 17% 17% 10% 35%
There are 24 entries in Table 3 of the current survey and 48 in the Code Metrics table of the 1988 survey (the table names vary).
In the 1988 survey, the most studied language is FORTRAN, followed by
Assembler, COBOL, C , Pascal and PL/1, while in the current survey, C is the
most studied, followed by Pascal, COBOL, FORTRAN, and Assembler. The most attractive programming language for metrics practitioners has shifted from
FORTRAN to C. This shift also embodies the popular programming language
shifting in the real world. With the increased usage of languages such as Ada and Smalltalk, there should be more measurement done on them.
3.4. Comparison of Table 4
Since the new metrics classification schema differs in the current survey and in the 1988 survey, a direct comparison cannot be done. But by the number of entries in the New Metrics tables in the two surveys, it is clear that papers on new metrics are
being published at about the same level in the two surveys: 84% (54 out of 64) in
the current one and 74% (92 out of 124) in 1988. Therefore, we can see that the interest in generating new metrics and publishing on them is still high among researchers and practitioners.
There are two important reasons for this interest. First, classic metrics have been practiced and tested for roughly two decades. It is time to explore something new. New metrics open a new horizon beyond the territory of classic metrics. It is from these new metrics that new ideas in software measurement are being discovered and promoted to classic metrics as time goes on. Second, we are living in an information age: new concepts appear quite often. Take graphical user interfaces for example, it was not a necessity in the past. But now one can hardly find a commercial software product without such an interface. The requirement of a graphical user interface generates a need for specific measurement metrics, such as layout and usability measurements. We believe that the new metrics will still be the focus of software metrics.
CHAPTER 4
ANNOTATED BIBLIOGRAPHY
In this chapter, all the metric papers that appear in the tables are presented in the following format: 1) paper identification code; 2) name of the author(s), title, and journal; page, year; and 3) a brief summary and classification information. The papers are listed alphabetically according to the paper identification code.
Let>s take [ABRA94] as an example to see how each entry is presented:
1) paper identification code:
[ABM94]
2) name of the authors, title, and journal:
Alain Abran and Pierre N. Robillard, "Function points: a study of their measurement processes and scale transformations^ Journal of Systems and Software, Vol.25, pl
71-184, 1994.
3) brief summary and classification notes
This paper studies the underlying measurement model in function points in order to reveal the true nature of these metrics and their usefulness in fields other than their initial management information system domain. Statistical data of function points is also provided in table format.
The first sentence not only gives the summary of the paper: this paper studies the underlying measurement model in function points in order to reveal the true nature of
these metrics and their usefulness in fields other than their initial management
information system domain, but also gives the information necessary for classification: it is a paper on function points, therefore, it should be checked under
AFP in the Classic Metrics Table; since function point deals with specification
issues (this information being common knowledge, it is not specified here), it
should also be checked under SPE in the Metrics through the Life Cycle table. The
second sentence, Statistical data of function points is also provided in table format.,
tells us that it is an empirical paper, therefore it should be checked under EMP in
the Metrics through the Life cycle table.
To classify an entry in the metrics table, the reader needs to go back to Chapter 2 to review the table classification schema, and apply the schema to the entry to find a proper column and table for it. The reader might also need some background common knowledge such as the fact that function point is a metric on the specification of software, as in [ABRA.94]. Our classic metrics section only presents short definitions of each classic metric because we take for granted that those are very well known metrics among metrics practitioners. Obviously, there is not a clear cut decision for each paper classification, and the reader might, in some cases, classify certain papers difFerently from what is presented here.
[ABRA94]
Alaln Abran and Pierre N. Robillard, "Function points: a study of their measurement processes and scale transformations", Journal of Systems and Software, Vol.25, pl71-184, 1994.
This paper studies the underlying measurement model in function points in order to reveal the true nature of these metrics and their usefulness in fields other than their initial management information system domain. Statistical data of function points is also provided in table format.
[BAKE90]
Albert L. Baker, James M. Bieman, Norman Fenton, David A. Gustafson, Austin Melton and Robin Whitty, "A philosophy for software measurement", Journal of Systems and Software, Vol. 12, p277-281, 1990.
It introduces the application of measurement theory to software measures on a theoretical level only. It describes implications of the theory to validation and to
the development of structural measures, and shows that useful measures can be developed under the measurement theory framework.
[BEVA91]
Nigel Bevan, Jurek Kirakowski and Jonathan Maissel, "What Is Usability?" Human Aspects in Computing: Design and Use of Interactive Systems and Work with Terminals. 1991.
This paper relates different approaches to usability based on the product, user, ease-of-use, actual usage and the context of use; and proposes a definition of usability. Diagnostic evaluation of usability problems may be based on the analysis of user interaction or on the comparison of product attributes with guidelines. This paper is a general theory on usability; no particular metric is given.
[BIEM94]
James M. Bieman and Linda M. Ott, "Measuring functional cohesion", IEEE Transactions on Software Engineering, Vol.20, No.8, p644-657, 1994.
The set of metrics proposed in this paper examines the functional cohesion of procedures using a data slice abstraction. The analysis identifies the data tokens that lie on more than one slice as the "glue" that binds separate components together. Cohesion is measured in terms of the relative number of glue tokens. An application of these sets of metrics is also presented. There is no specific mention of the programming language used.
[BOL093]
Germinal Boloix, Paul G. Sorenson and J. Paul Tremblay, "Software metrics using a metasystem approach to software specification". Journal of Systems and Software,
Vol.20, p273-294, 1993.
The authors believe that metrics can assist in the transformation from a source specification to a target specification. The goal of this paper is to support a metric-driven approach to software development by incorporating, with relative ease, the metric computation into the software specification environment. As representative examples to implement the theory presented in this paper, metrics for data flow diagrams, structure charts, and resource flow graphs are described and analyzed.
[BOWM90]
Brent J. Bowman and William A. Newman, "Software metrics as a programming training tool", Journal of Systems and Software, Vol. 13, pl39-147, 1990.
An experiment is performed to determine if training has any effect on program complexity, development time and quality based on Halstead's Software Science Volume and Effort and McCabe's Cyclomatlc Complexity number metrics after training on software complexity metrics has been integrated into an advanced COBOL programming class. A simple experiment was performed to determine if the training had any effect on program complexity, development time, and several dimensions of quality. The nonparametric Mann-Whitney U test was performed to determine whether statistically significant differences existed between the means and standard deviations of the measurement data. The results of using complexity metrics as a training tool are positive. Since design has a major contribution to complexity (another element could be coding) , it is checked under Design. Since complexity is an issue of Product, it should be under Product. Since time is an issue of Process, it should be under Process also.
[BUSH90]
Martin E. Bush and Norman E. Fenton, "Software measurement: a conceptual framework , Journal of Systems and Software, Vol. 12, p223-231, 1990.
A conceptual framework that gives a rationalized overview of the subject of software measurement is presented and the classification scheme (product, process and resource) is explained theoretically. This paper gives rise to a systematic classification of the subject matter of software measurement.
[BUTL93]
Ricky W. Butler and George B. Finelli, "The unfeasibility of quantifying the
reliability of life-critical real-time software", IEEE Transactions on Software Engineering, Vol. 19, No. 1, p3-12, January 1993.
This paper affirms that the quantification of life-critical software reliability is
unfeasible using statistical methods when these methods are applied to standard software or fault tolerant software.
[CARV90]
D. L. Carver, D. W. Cordes, and Nancy Gauder, "Object-based measurement in the requirements specification phase", Empirical Foundations of Information and Software Science V, p369-p377, 1990, Plenum Press, New York.
In this paper, the authors develop measurements that provide a characterization of the difficulty of the proposed system at the early stage of requirements definition. The characterization measurements are from an object-oriented perspective. They are based on solution objects, actions, and the level of interaction among the objects. These characterizations provide objective measures that can be used as input to the early evaluation of problem difficulty that is required when cost and time estimates must be formulated.
[CHAN91]
Francis C. L. Chan, Paul P. Dasiewicz and Rudolph E. Seviora, "Metrics for evaluation of software reliability growth models", Proceedings,. 1991 International
Symposium on Software Reliability Engineering, pl 63-167, 1991.
It presents three metrics which have been helpful in assessing the applicability and
predictive validity of reliability growth models. These metrics are the relative fitting error metric, the short term predictive validity metric and the long term predictive validity metric. The application of these metrics is illustrated on the estimation of the field reliability of telecommunication switching systems.
[CHID94]
Shyam R. Chidamber and Chris F. Kemerer, "A metrics suite for object oriented design , IEEE Transactions on Software Engineering, Vol.20, No.6, p476-493,
1994.
This research presents a new set of software metrics for object oriented design. Data is collected from C and Smalltalk implementations.
[CHUN91]
Chi-Ming Chung, "Integration metrics and softsvare testing". International Journal of Information and Management Sciences, p59-71, December 1991.
Since most testing strategies and metrics are derived from similar program factors, such as control flow or data flow factors, software development methodologies can
be developed by considering both testing and metrics factors to be utilized in testing and measurement of software to form a more effective software development tool. Path complexity techniques are proposed for integrating metrics and software testing. A diagram is given to illustrate the utilization of software metrics and testing methodologies to control software quality. Two test criteria: intra level first and inter level first are presented. The idea of the most complicated path is also illustrated.
[CIOC91]
Frank A. Cioch, "Measuring software misinterpretadon". Journal of Systems and Software, Vol.14, p85-95, 1991.
A distinction is made between software comprehension and misinterpretation. The measurement technique is used in an experiment which assesses comprehension and misinterpretation of requirements specifications. The results of the experiment suggest that the impact of the specification language on comprehension can differ from its impact on misinterpretation. The comprehension and misinterpretation by personnel are measured using a number scale. Experience of the personnel plays a key role in this measurement.
[COLE95]
Don Coleman, Bruce Lowther and Paul Oman, "The application of software maintainability models in industrial software systems", Journal of Systems and Software, Vol.29, p3-16, 1995.
This article reviews two early attempts at softsvare maintainability assessment and describes five recently developed models. Two of these are then applied to industrial software systems, and the results are evaluated. Each of the two models are shown to be effective in evaluating Industrial software systems at the component, subsystem, and system levels. Sample data from C programs is included.
[COOK94]
Curtis R. Cook and Andreas Roesch, "Real-time software metrics". Journal of Systems and Software, Vol.24, p223-237, 1994.
This article describes the software metrics analysis of the 1 Oth release of a real-time
telephone switching system developed by a German telecommunications firm. A metrics program that computes the standard software complexity metrics plus information flow metrics was developed. It reports that the information flow metrics characterize the complexity of the real-time parts of the software better than the standard software complexity metrics like lines of code, McCabe>s cyclomatic complexity and Halstead's software science. Since this is the 10th release of the product, it will be classified into the maintenance phase of the life cycle. It will also be classified into design and coding in the life cycle as we consider
that complexity always goes hand in hand with design and coding.
[COST95]
Rita J. Costello and Dar-Biau Liu, "Metrics for requirements engineering", Journal of Systems and Software, Vol.29, p39-63, 1995.
This article is an introduction to work in progress at The Aerospace Corporation and California State University, Ling Beach, in the area of metrics for requirements engineering. The first in a planned series of papers on metrics for full life cycle system and software engineering, it describes the role of metrics in an integrated approach to system and software engineering, introduces the basic components of complete metric definitions, and discusses the use of metrics in comprehensively assessing objective aspects of the requirements engineering process and its products. Statistical data from requirements, which include total requirement, volatility, requirement change reason etc., are presented graphically.
[COUP90]
Daniel Coupal and Pierre N. Robillard, "Factor analysis of source code metrics", Journal of Systems and Software, Vol. 12, p263-269, 1990.
Conventional metrics based on Halstead s software science and McCabe's cyclomatic complexity have been studied extensively. A statistical procedure for validating these metrics is presented on the factor analysis approach. This model also proposes a methodology to analyze large software projects with a single set of metrics. Data used are from commercial software and previous articles by the authors, coded in FORTRAN, C, Pascal, COBOL, PL/1 and Modula-2.
[DAVI90]
John Stephen Davis, Melody J. Davis and Monlque M. Law, "Comparison of subjective entropy and user estimates of software complexity". Empirical Foundations of Information and Software Science V, Plenum Press, New York,
1990.
This paper investigates subjective entropy, a new information-theoretic measure of program comprehensibility which accounts for semandcs and pragmatics involved in programmer-program interaction. Subjective Entropy is used in this paper to measure the comprehensibility of the software dBase III and Lotus 1-2-3, using student programs. This result reflects the usability of these two languages by measuring the comprehensibility of the programs.
[DEHN90]
Khosrow Dehnad, "Software metrics from a user's perspective". Journal of Systems and Software, Vol.13, pl 1 1-115,1990.
A quantitative approach for the evaluation of the quality of a software package is proposed. The method is based on the principle that poor quality is closely associated with certain losses. Users, consciously or sub-consciously, view these losses as the true software quality metrics. A quality model is developed that combines all these metrics into a single metric which measures the total loss to a user due to the poor quality of a package. It measures the quality of the software product through the factors affecting the user's perception.
[EBER91]
C. Ebert and A. Riegg, "A Framework for selecting system design metrics", Proceedings, 1991 International Symposium on Software Reliability Engineering,
pl2-19, 1991.
A framework for selecting design metrics is built, based on the classification of design aspects. The selection of appropriate metrics and their integration into a CASE tool allow the tracing of design aspects through the decision making process. This CASE tool is tested based on real data from industry.
[FENT90]
Norman E. Fenton, "Software metrics: theory, tools and validation", Software
Engineering Journal, January 1990.
This paper is the report of the Alvey project in the U. K. This project has a major goal of developing rigorous techniques for analyzing and measuring structural properties of systems which are coded in many languages: COBOL, FORTRAN, Pascal, C, Ada, etc. A new metric family called VINAP Is developed to meet the goal. This paper also frankly describes the achievements and failures of the project, the lessons to be learnt and, in particular, how the very perception of software measurement changed fundamentally during the project.
[FUCH90]
Norbert Fuchs, Ka Lun Tse and Robin Whitty, "Cost management with metrics of specification: The COSMOS Project", Approving Software Products, Elsevier Science Publishers, B.V. North-Holland, IFIP, 1990.
This is a report from the COSMOS project. COSMOS represents a new approach to obtaining objective Information about the evaluation of software products during the early stages of the life cycle. Non-trivial information about product structure is captured from formal specifications and designs for cost management.
[GORL90]
Narasimhaiah Gorla, Alan C. Benander and Barbara A. Benander, "Debugging effort estimation using software metrics", IEEE Transactions on Software Engineering, Vol.16, No. 2, p233-231, February 1990.
Measurements of 23 style characteristics, and other program measures are collected from student COBOL programs by a program analyzer. These measurements, together with debugging time data, are analyzed using several statistical procedures. A debugging effort estimator was developed to estimate debug times.
[GUNS91]
Dirk Gunsthovel and Tom Bosser, "Predictive metrics for usability". Human Aspects in Computing: Design and Use of Interactive Systems and Work with Terminals, 1991.
A model of cognitive skills is presented as a basis for calculating various indicators of usability, mainly relating to the complexity of user procedures. This model was developed to model the factors relevant for usability, i.e. tasks, functionality and
procedural user knowledge, in an efficient form, applicable for usability evaluation in an early design stage. The main objective is to derive information about the usability of a product as early as possible, based on requirements specifications and a functional specification of the product.
[HARR90]
Warren Harrison and Curtis Cook, "Insights on improving the maintenance process through software measurement", Proceedings, Conference on Software Maintenance 1990, p37-45, 1990.
It develops a new model of software maintenance based upon an objective decision rule which determines whether a given software module can be effectively modified, or if it should instead be rewritten. A metric is defined to provide a measure of program evolution over a given release cycle.
[HENR90]
Sallie Henry and John Lewis, "Integrating metrics into a large-scale software development environment". Journal of Systems and Software, Vol. 13, p89-95,
1990.
This paper presents an experiment that introduces a nondisruptive method for integrating metrics into a large-scale commercial software development environment. This paper considers that the key to integrating quality into software stems from the relationship between code complexity and errors. Theories on software complexity are presented by some classical metrics: lines of code, HalsteacTs software science indicators, McCabe's cyclomatic complexity, etc. The error predictor equations presented here are valid only at a higher level, which restricts their use, but the technique to generate them is completely general.
[HENR91A]
Sallie Henry and Steve Wake, "Predicting maintainability with software quality
metrics", Software Maintenance: Research and Practice, Vol. 3, pl29-143. 1991. In this paper, maintenance is defined as the correction of errors in a program. It details a study of the use of software quality metrics to determine high complexity components in a software system. By the use of a history of maintenance done on a particular system, it is shown that a predictor equation can be developed to identify
components which need maintenance activities. This same equation can also be used to determine which components are likely to need maintenance in the future. The software system used in the experiment consists of 193 procedures comprising
about 15 000 lines of C code.
[HENR91B]
S. Henry and R. Goff, "Comparison of a graphical and a textual design language using software quality metrics", Journal of Systems and Software, Vol. 14,
pl33-146,1991.
There are two popular trends in attacking the software reliability problem on two fronts: first by design methodologies, languages, and tools as a precheck on quality and second by measuring the quality of produced software as a postcheck. This research attempts to unify the approach to creating reliable software by providing the ability to measure the quality of a design prior to its implementation. It evaluates two design languages to prove that the human brain works more effectively in images than in text. It also covers some briefings on classic metrics like lines of code, McCabe's cyclomadc complexity and HalsteacTs software
science.
[HISH91]
Jun Hishitani, Shigeru Yamada and Shunji Osaki, "Reliability assessment measures based on software reliability growth model with normalized method", Journal of Information Processing, Vol.14, No.2, pl78-183, 1991.
It is very important to assess software reliability quantitatively by using failure time data observed during software testing. This paper discusses a method of assessing
software reliability on the basis of a software reliability model described by a
nonhomogeneous Poisson process, that is to say, an exponential reliability growth model. Numerical examples of the mean time between software failures and the software reliability function are given by applying the method proposed here to actual data.
[INCE90]
Darrel Ince, "How good is your software", EXE, p44-47, April 1990.
It is easy to judge the design of software if you have to re-code it twice a week. But
Darrel Ince can tell before the program is finished by using McCabe's and Halstead's metrics. This paper summarises some key groundbreaking work in software history and usage of metrics. It mainly concerns itself with the graphic approach in measuring. A valuable critique of McCabe's and Halstead's metrics is
described.
DAC091]
Raymond Jacoby and Yoshihiro Tohma, "Precise formulation and applicability of
a software reliability growth model based on the hyper-geometric distribution", Journal of Information Processing, Vol. 14, No.2, pl 92-203, 1991.
This paper presents the basic concepts of the Hyper-geometric Distribution Growth Model for the estimation of the number of faults in a program at the beginning of the testing phase. The exact formulation of the model is established. Data is collected for the evaluation of this model.
[KELL91]
Sallie Keller-McNulty, Mark S. McNulty and David A. Gustafson, "Stochasdc models for software science", Journal of Systems and Software, Vol. 16, p59-68,
1991.
Stochasdc models are developed in this paper mainly for length measures. The predictive properties of the models are investigated in an empirical study based on data from software programmed in Pascal and C. Software science also gets a brief introduction since it has the same goal as the stochastic m.odels: to provide a comprehensive model of the software construction process. But there is a major difference in the two metrics families: in software science, the software construction is treated as a determinisdc process while in stochastic models, it provides estimates of the probability distributions of the measures.
[KELL92]
John C. Kelly, Joseph S. Sherif and Jonathan Hops, "An analysis of defect densities
found during software inspections," Journal of Systems and Software, Vol. 17,
plH-117,1992.
The research is conducted based on the projects at Jet Propulsion Laboratory. It describes an analysis of factors influencing the defect density of products
undergoing software inspection throughout all the software development phases. The results show a significantly higher density of defects during requirements inspections. The defect densities decrease exponentially as the products approach the coding phase because defects are fixed when detected and do not migrate to subsequent phases. This results in a relatively flat profile for cost to fix. Increasing the pace of the inspection meetings decreases the density of defects found. Real
data is provided from projects using ADA, C and SIMULA.
[KHOS94]
Taghi M. Khoshgoftaar, John C. Munson and David L. Lanning, "Alternative approaches for the use of metrics to order programs by complexity". Journal of Systems and Software, Vol.24, p211-221, 1994.
With many program complexity metrics available, it is difficult to rank programs by complexity: The different metrics can give different indications. There are two parts to this problem. First, because different metrics can measure the same program attribute, we need a method of evaluating a given program attribute based on the values of all metrics that measure this attribute. Second, because different metrics can measure distinct program attributes, we need a method of evaluating the overall program attributes. This paper compares two methods of simultaneously detecting different aspects of software complexity measured by Halstead's software science and McCabe's cyclomatic complexity number with a validation study. A relative complexity metric is derived to represent each complexity metric in proportion to the amount of unique variation that it contributes. The experiments are done on C programs.
[LAKS91]
K. B. Lakshmanan, S. Jayaprakash and P. K. Sinha, "Properties of control flow complexity measures", IEEE Transactions on Software Engineering, Vol. 17,
pl289-1296, 1991.
It attempts to formalize some properties which any reasonable control-flow complexity measure must satisfy. This paper also reveals the strengths and weaknesses of some of the existing control flow complexity measures, including McCabe's metrics.
[LEWI89]
John Lewis and Sallie Henry,. "A methodology for integrating maintainability using software metrics", Proceedings, IEEE Conference on Software Maintenance, 1989, p. 32-9.
Maintainability must be integrated into software early in the development process. But for practical use, the techniques used must be as unobtrusive to the existing software development process as possible. This paper defines a methodology for integrating maintainabllity into large-scale software and describes an experiment which implements the methodology into a major commercial software development environment. The classical metrics Halstead's software science, McCabe's cyclomatic complexity, and Lines of code are used to form the integrating process.
[L090]
Linton Lo, "An initial view on size estimation for expert system applications , Proceedings of the 4th Australian Joint Conference on Artificial Intelligence, p335-358, Nov. 1990.
This paper discusses the size estimation for expert system applications. Major factors that influence the development of expert system applications are examined. A number of size metrics that are popular in the estimation of traditional software applications are considered with respect to their application to the new technology. Finally criteria for future size metric development are suggested but no new metric is presented. It covers the topics of lines of code, function points, and software science. A COBOL based program is used for the analysis of sizing.
[LUBI90]
David J. Lubinsky, Measuring software size by distinct lines". Proceedings, Fourteenth Annual International Computer Software and Applications Conference, p 403-407, 1990.
The relationship between distinct lines of code and non comment source lines is studied on a number of projects (the c compiler, the vi editor, unison, etc.). The result is that overall the distinct lines of code metric is a very attractive measure of size that has more advantages than non comment source lines.
[MALA90]
Yashwant K. Malaiya and Nachimuthu Karunanithi,. "Predictability measures for software reliability models", Proceedings. Fourteenth Annual International Computer Software and Applications Conference, p 7-12, 1990.
To be able to estimate the testing efforts required, it is necessary to use a software
reliability growth model. While several different software reliability growth models
have been proposed, there exist no clear guidelines about which model should be used. Here a two-component predictability measure is presented that characterizes the long term predictability of a model. The first component measures how well a model predicts throughout the testing phase while the second component is a measure of the general tendency to overestimate or underestimate the number of faults. Data sets for both large and small projects from diverse sources have been analyzed. Results presented here indicate that some models perform better than others in most cases.
[MAYR91]
Anneliese Von Mayrhauser and James M. Keables. "A data collection environment for software Reliability Research", Proceedings, 1991 IEEE International Symposium on Software Reliability Engineering, p. 98-105.
It reports ongoing research at IIT, their approach to data collection and the development of a simulation environment used in software reliability research on a theoretical level. The environment is, in essence, a laboratory in which software reliability experiments are conducted. It is a useful tool for the testing of software. The experiments are done on C programs.
[MORE93A]
LarryJ. Morell and Jeffrey M. Voas, "A framework for defining semantic metrics", Journal of Systems and Software, Vol.20, p245-251, 1993.
Software metrics are measures of particular characteristics found in software. Research in this area seeks to identify relationships between software characteristics and software engineering processes. Most software metrics are based on program structure and are determined statically. This paper presents a framework by which semantic information that is essential to debugging can be quantified. Semantic information designates information concerning what occurs internally during
execution as program states are created. The metric presented here is essential to debugging.
[MORE93B]
Larry Morell and Branson Murrill, "Semantic metrics through error flow analysis", Journal of Systems and Software, Vol.20, p253-265, 1993.
Error flow analysis of a computer program, originally developed as a technique to facilitate software testing, derives information about how potential data stated errors may arise and propagate as the program executes. This information can be used to measure the semantic effects on an execution path caused by changing statements along-the path. A dynamic style of error flow analysis is defined and a system for performing this analysis called Dynamic Error Flow Analysis is described. Several semantic metrics are described.
[MUNS90]
John C. Munson and Taghi M. Khoshgoftaar, "The relative software complexity metric: a validation study". Proceedings of Software Engineering 90, p89-102,
1990.
In this paper, a new approach to the use of complexity metrics is explored. A method is presented theoretically for the construction of a linear, combination of existing metrics to form a single relative complexity metric. The particular focus is on the validation of this metric concept with regards to its stability. A large sample of data is used for the validation. HalsteacTs software science and McCabe's cyclomatic complexity are used to form this new metric. There is no mention of a specific programming language.
[MUNS91]
John C. Munson and Taghi M. Khoshgoftaar, "The use of software complexity metrics in software reliability modeling", Proceedings. 1991 International
Symposium on Software Reliability Engineering, p2-l1, 1991.
The central theme of this study is the creation of a suitable complexity measure for use in software reliability models. Factor analysis techniques are employed to reduce the dimensionality of the complexity problem space, to produce a set of reduced metrics. The reduced metrics are subsequently combined into a single