HAL Id: hal-02188665
https://hal-mines-albi.archives-ouvertes.fr/hal-02188665
Submitted on 30 Jul 2019
HAL is a multi-disciplinary open access
archive for the deposit and dissemination of
sci-entific research documents, whether they are
pub-lished or not. The documents may come from
teaching and research institutions in France or
abroad, or from public or private research centers.
L’archive ouverte pluridisciplinaire HAL, est
destinée au dépôt et à la diffusion de documents
scientifiques de niveau recherche, publiés ou non,
émanant des établissements d’enseignement et de
recherche français ou étrangers, des laboratoires
publics ou privés.
Crystallization of α-glycine by anti-solvent assisted by
ultrasound
Hector Rodriguez Vera, Fabien Baillon, Fabienne Espitalier, Philippe Accart,
Olivier Louisnard
To cite this version:
Hector Rodriguez Vera, Fabien Baillon, Fabienne Espitalier, Philippe Accart, Olivier Louisnard.
Crys-tallization of α-glycine by anti-solvent assisted by ultrasound. Ultrasonics Sonochemistry, Elsevier,
2019, 58, pp.104671. �10.1016/j.ultsonch.2019.104671�. �hal-02188665�
Crystallization of α-glycine by anti-solvent assisted by ultrasound
Héctor Uriel Rodríguez Vera, Fabien Baillon, Fabienne Espitalier
⁎, Philippe Accart,
Olivier Louisnard
Université de Toulouse, IMT Mines Albi, CNRS, Centre RAPSODEE, Campus Jarlard, F-81013 Albi CT cedex 09, France
Keywords:
α-Glycine Crystallization Ultrasound
A B S T R A C T
Crystallization of α-glycine by addition of an anti-solvent (ethanol) assisted by ultrasound is studied. The ex-periments of crystallization are conducted at 303.15 K in a solution of 150 ml with continuous agitation by a magnetic rod. Ultrasound is then applied at powers ranging from 8 to 41 W thanks to an ultrasonic horn at 20 kHz. The supersaturation ratio (S) is followed throughout all the experiment. At the end of the experiment, the suspension is filtered, the solid is washed with ethanol and dried at 333.15 K. The resulting crystals are characterized by their final size distributions measured by laser granulometry, their morphologies observed by scanning electronic microscope (SEM) and their crystalline structures by differential scanning calorimetry (DSC). The influence of ultrasonic power (continuous 13, 28 and 40 W or pulsed modes), measured by calorimetry method, is studied for different addition rates (0.05 to 0.36 g of ethanol/min). Ultrasound permits to reduce the metastable zone width and to decrease the size of crystals due to an increase of the nucleation rate. The rate of de-supersaturation is higher in presence of ultrasound, inducing a higher nucleation rate, a higher growth rate or both. At 40 W, the decrease of supersaturation is faster, and the crystallization is finished in 40 min instead of 80 min (at 13 and 28 W) or 120 min without ultrasound. The use of pulsed ultrasound (50 on/50 off) is inter-esting from an economic point of view because similar results are obtained: comparable size distributions and resembling concentration profiles.
1. Introduction
The crystallization is an important step in the formulation of a solid as it permits to control the solid properties like the size distribution, the morphology and the crystalline structure. However, in a batch crys-tallization process, it is difficult to control the phenomena involved in the vessel (nucleation, growth and agglomeration) without the use of seeding[1]. Ultrasound can be an interesting alternative to the use of seeding.
The effect of ultrasound on crystal size is observed and reported in many studies involving varied pharmaceutical drugs such as non-ster-oidal anti-inflammatory drugs: ibuprofen[2], mefenamic acid[3], ke-toprofen[4], phenylbutazone[5]; antibiotics or antifungals: itracona-zole [6], sulfamethoxazole [6], sulfathiazole[7] and cloxacillin[8]; analgesics: piroxicam [9], salicylic acid [10], phenacetin [7]; anti-epileptics: carbamazepine[11]; and antilipemics: gemfibrozil[12]. In all these studies, the particles sizes of active drug obtained are finer
than those obtained with conventional crystallization methods and the size distributions become narrower in the presence of ultrasound. This decrease of size permits for instance to increase the drug dissolution rate and so, to improve the bioavailability of the drug. In addition to reducing the crystals size, ultrasound allows to control the crystalline structure. For example, in the case of piroxicam, the stable polymorphic form I is created predominantly. However, the formation of amorphous piroxicam and the metastable form of benzoic acid is also noted in the presence of ultrasound [13]. The morphology of crystals can be changed by the application of ultrasound: needles shaped crystals are obtained without ultrasound for ketoprofen or mefenamic versus plate crystals with ultrasound. Finally, ultrasound causes a decrease of the induction time of metastable zone width at equivalent supersaturation
[14].
Different ultrasonic systems may be used: horn, transducer or bath; with different frequencies (20 kHz–20 MHz) and powers (few Watts to hundreds of Watts).
⁎Corresponding author.
Glycine is the smallest and simplest of the amino acids. It allows the body to synthesize many proteins, especially in the skin and muscles. It is one of the molecules found in more than 100 specialties like cataract treatment, subcutaneous rehydration and parenteral nutrition). It pre-sents three polymorphs: α-glycine, β-glycine and γ-glycine. At room temperature, the γ-glycine is the most stable[15,16]. It is soluble in water and insoluble in ethanol. The crystallization of glycine assisted by ultrasound has been the subject of few studies. Previous works on cooling crystallization of glycine with ultrasound in aqueous phase showed that a purer crystalline phase is formed with more regular faces with moderate ultrasonic[17]and a decrease of the induction time when the ultrasonic power increases[18]. The effect of high frequency ultrasound (between 1 and 10 MHz) on the nucleation and growth of glycine has been explored by Lyczko et al.[19]. They showed that ul-trasound only promotes α-nucleation and completely inhibits β- and γ-nucleation in the system glycine-water.
In our work, the crystallization of α-glycine by addition of an anti-solvent (ethanol) assisted by ultrasound is studied. Effects of ultrasonic power, addition rate and pulsed cycle application on the particle size distribution and crystallization have been studied.
2. Materials and methods
Pure α-glycine (GPR RECTAPUR, 99.9% purity), ethanol (NORM-APUR) for the crystallization experiments and ethanol (TechniSolv 96%) to wash crystals were purchased from VWR CHEMICALS.
2.1. Crystallization experiments
The setup used for batch experiments is shown inFig. 1. It is similar to the one used in a previous work[20]. It consists of a jacketed cy-lindrical vessel with a diameter of 0.056 m, stirred with a magnetic bar. The height of liquid at the end of experiment is 0.06 cm. The maximal volume corresponding to this height is 150 ml. A thermocouple con-nected to a temperature control system (concon-nected to a LAUDA RC 20 CP) permits to maintain the temperature constant throughout all the experiment. The temperature control system is provided by a computer-controlled LAUDA RC 20 CP thermostat bath. For the sonocrystalliza-tion, an ultrasonic horn of 1 cm tip diameter controlled by VibraCell Bioblock Scientific generator is always positioned at the same height (0.02 m from the bottom of the reactor). The frequency of the generator is 20 kHz with a power range of 13–43 W.
A solution of concentration 0.27 kg α-glycine/kg water is prepared at 308.15 K (5 K above the temperature of saturation). This solution is then cooled at 303.15 K.
Once the temperature is stabilized at 303.15 K, ethanol is added at a constant flow rate by means of a syringe pump (PHD 2000 infusion) and a 20 ml disposable syringe (TERUMO®). The injection of ethanol is carried out close to the ultrasound probe tip. The addition rate varies between 0.05 and 0.36 g of ethanol/min.
During the course of the experiment, samples are taken and filtered with syringe filters (0.2 µm).
Some experiments are performed three times in order to verify re-peatability.
2 cm K
Fig. 1. Crystallization experimental setup.
Table 1
Solubility of α-glycine in an ethanol-water mixture at 303.15 K.
T (K) R (g ethanol/g water) C (RI,R)
(g glycine/g solution) C (dry extract)(g glycine/g solution)
333.15 0.000 0.219 0.212 333.15 0.025 0.202 0.197 333.15 0.050 0.186 0.182 Table 2 Dissipated power. Level/Pulsations (W) (W/kg) 3 (100%) 13 89 5 (25%) 8 55 5 (50%) 11 75 5 (75%) 13 89 5 (100%) 29 190 7 (100%) 41 271 1 10 100 1000 Time (min) C (g glycine/g of solution) 0.200 0.195 0.190 0.185 0.180 0.175 0.170
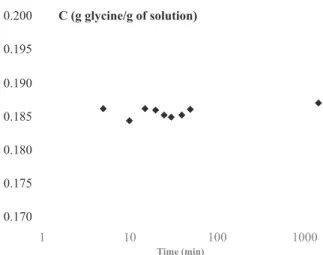
Fig. 2. Example of the evolution of a-glycine concentration at 303.15 K for a
The refractive index of the filtrate is measured. The measurement of refractive index of solution permits to follow the concentration of gly-cine (Cglycine) all along the experiment. A calibration curve is
de-termined for a mass ratio R and a concentration of α-glycine ranged respectively between 0 and 0.05 g ethanol/g water and 0 and 0.191 g α-glycine/ g solution at 303.15 K. = + C glycine( , )RI R ggglycine 7.2091 5.4121RI 0.2547R solution -(1) where RI is the refractive index measured at reference temperature of 293.15 K.
The supersaturation ratio (S) is calculated by the ratio of C α-glycine(RI, R) and Cα-glycine,eq(R,T). Cα-glycine,eqis the equilibrium
con-centration of α-glycine measured for this study as function of mass ratio of ethanol at 303.15 K.
At the term of the crystallization experiments, the resulting sus-pension is filtered and the solid is washed with ethanol, then dried in a stove (Hereaus) at 333.15 K. The crystals are characterized by their final size distributions measured by laser granulometry and their morphologies are observed by scanning electronic microscope (Hitachi TM3030 SEM). In order to verify the crystalline structure, an analysis by differential scanning calorimetry (DSC, Q200 TA Instrument) with a heating rate of 5 K/min between 293.15 and 473.15 K are conducted in a crimped aluminum pan[15].
The influence of ultrasonic power (continuous or pulsed modes), measured by calorimetry method, is studied for different addition rates of ethanol. The limit supersaturation ratio Slimitand the beginning of
crystallization (time between S = 1 and Slimit) are followed and
ob-served.
2.2. Solubility determination
Different solubility data of α-glycine in water or alcohol aqueous mixtures as a function of temperature and solvent composition are given in the literature[21]. In order to calculate the supersaturation ratio in crystallization operating conditions, the equilibrium con-centration of α-glycine in water, C -glycine eq, , is measured at 303.15 K for
three mass ratio of ethanol 0, 0.025 and 0.05 g ethanol/g water in the crystallization experimental set up. An excess of α-glycine solid is
introduced in water at 303.15 K. The suspension is stirred at 900 rpm during 24 h. Samples are taken and filtered with syringe filters. The refractive index of filtrate is measured as a function of time.
3. Dissipated power
Temperature measurements are performed during the application of ultrasound in the crystallization vessel. The vessel is filled with 150 g of water and the jacket is empty in order to thermally insulate the system.
An energy balance leads to:
= + +
T T Q Q
hS hSe
( water air) stirring ultrasound
hS m Cp t C
1
water water
(2) with Tairbeing the temperature of laboratory (K), Twaterthe
tempera-ture of water (K), h the thermal transfer coefficient between air and water
( )
Wm K2 , Qstirringand Qultrasoundthe power dissipated respectively by
20 70 120 170 220 He at fl ow (m W ) Heat flow (mW) T (°C)
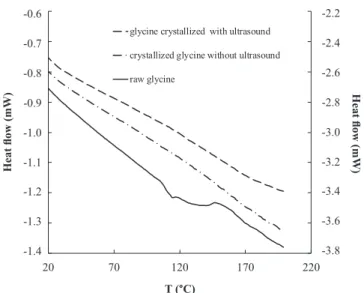
glycine crystallized with ultrasound crystallized glycine without ultrasound raw glycine -0.6 -0.7 -0.8 -0.9 -1.0 -1.1 -1.2 -1.3 -1.4 -2.2 -2.4 -2.6 -2.8 -3.0 -3.2 -3.4 -3.6 -3.8
Fig. 3. DSC analysis of three samples: raw material (right y-axis), glycine
crystallized without and with ultrasound (left y-axis) for a mass ratio of 0.05.
Table 3
Operating conditions of the crystallization experiments performed at 303.15 K with a mass ratio of 0.05 g ethanol/g water, the initial concentration of glycine was 0.27 kg α-glycine/kg water.
Addition rate of ethanol
(g/min) Ultrasound Time of experiment (min) d(µm)4,3 Beginning of crystallization (min) Slimit Dissipated power (graduation) Ultrasound on (%)
0.05 0 0 120 143 100 1.095 0.09 0 0 120 145 68 1.130 0.19 0 0 120 186 37 1.130 0.36 0 0 120 168 18 1.133 0.18 13 (3) 100 120 90 31 1.108 0.19 41 (7) 100 60 21 1.075 0.04 28 (5) 100 120 75 40 1.035 0.09 28 (5) 100 120 167 45 1.083 0.19 28 (5) 100 120 126 27 1.100 0.36 28 (5) 100 120 96 11 1.081 0.18 8 (5) 25 120 116 31 1.107 0.18 13 (5) 75 120 122 33 1.124
the stirrer and by ultrasound (W),mwaterthe mass of water (kg), Cpwater
the heat capacity of water
( )
kg KJ .The coefficient h and the stirring power Qstirringare determined with
experiments respectively without stirring and without ultrasound and with stirring and without ultrasound.
4. Results
4.1. Solubility
The Fig. 2 presents the evolution of α-glycine concentration as function of time during the solubility measurement at 303.15 K for a mass ratio of 0.05 g ethanol/g water. The liquid–solid equilibrium is reached very rapidly because the concentration very slightly changes over time between 0 and 1440 min (as each sampling has to be taken into account in the mass balance). In this operating condition, the equilibrium concentration is equal to 0.186 ± 0.001 g glycine/g so-lution.
The solubilities of α-glycine measured at 303.15 K in three ethanol water mixtures are reported in Table 1. The glycine concentrations calculated from the refractive index are compared to those measured by dry extract. A good agreement is observed between these two methods. According to the literature, the solubility of α-glycine decreases with the mass ratio ethanol-water[21,22]. Moreover, these α-glycine solu-bility data are in agreement with those available in the literature data (298 and 313 K, and 0.053 g ethanol/g water)[22].
The concentrations given in the rest of document are estimated from the measurement of the refractive index.
4.2. Dissipated power
The measured dissipated powers by ultrasound are reported in
Table 2in W and in W/kg solution as function of the level of gradua-tion. The measured dissipated powers are ranged between 8 and 41 W (or 55 and 271 W/kg solution). During an operation of crystallization, it is important to use moderate power in order to control the temperature, and by that way, the supersaturation. Pulsed ultrasound is used in order to reduce the energy consumption. A thermal transfer coefficient h of 10.5 W
m K2 is found. Since the transfer coefficient h is small, it can be
assumed that the system is adiabatic. The power dissipated by agitation (0.07 W), is negligible compared to the power dissipated by ultrasound.
4.3. Crystallization experiments
Operating conditions of the experiments are reported in Table 3. The initial concentration of glycine in water (0.27 g glycine/g eau), the temperature (303.15 K) and the final mass ratio of ethanol in water (0.05 g ethanol/g water) are constant for all experiments. The influence of four addition rates of ethanol, three dissipated powers and two pulsed at one graduation on the particle size distributions and super-saturation ration profiles have been studied.
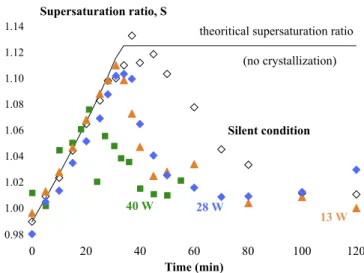
Fig. 4. Supersaturation ratio as a function of time for different addition rates
and a mass ratio of ethanol in water of 0.05 g ethanol/g water in silent con-dition (a) and with a dissipated power of 28.3 W (b). The full lines represent the theoretical supersaturation ratio in absence of crystallization. The dotted lines are drawn to show the trends. a- in silent condition (empty square marker 0.36 g ethanol/min, empty diamond marker 0.19 g ethanol/min, empty circle marker 0.09 g ethanol/min, empty triangle marker 0.046 g ethanol/min). b-with dissipated power of 28.3 W (filled square marker 0.36 g ethanol/min, filled diamond marker 0.19 g ethanol/min, filled circle marker 0.09 g ethanol/ min, filled triangle marker 0.046 g ethanol/min).
To identify the form of glycine crystallized (γ or α), DSC analyses have been made. The presence of an endothermic peak around 441 K corresponds to the phase transformation of γ-glycine to α-glycine[23]. The Fig. 3 presents the thermograms obtained for three solids (raw product, glycine crystallized with and without ultrasound). The absence of an endotherm means that the pure metastable α-form is obtained whatever the operating conditions. Ultrasound doesn’t modify in this case the crystalline structure.
4.3.1. Influence of flowrate
Four addition rates of ethanol have been tested in silent condition and with a dissipated power of 28 W. Profiles of supersaturation ratio, morphologies and size distributions of final crystals and limit super-saturation ratio Slimitin silent condition and with a dissipated power of
28 W are reported inFig. 4toFig. 5. For each experiment, three phases are observed. In the first phase, logically, the supersaturation ratio in-creases linearly with time due to the addition of ethanol. During this phase, no crystallization occurs. A decrease of this supersaturation ratio for S = Slimitis then observed in a second phase due to the
crystal-lization (nucleation and growth) of α-glycine. A plateau is attained in the last phase: S tends toward 1. The solution is considered saturated. The limit supersaturation ratio (1.13 without ultrasound and 1.08–1.10 with ultrasound) does not depend of the addition rate of ethanol ranged between 0.09 and 0.36 g ethanol/min (Fig. 4). This maximal super-saturation ratio is lower (1.09 without ultrasound and 1.04 with ul-trasound) at low addition rate 0.05 g ethanol/min. In term of me-tastable zone width, it increases when the addition rate increases in silent conditions and with ultrasound. With the same flowrates, this width decreases when ultrasound is applied.
Some information on nucleation can be deduced from the me-tastable zone width as function of the addition rate of ethanol by plotting the logarithm of the total amount of ethanol per water (methanol
in kg ethanol/kg water) added as function of addition rate methanol(kg
ethanol/kg water/s) according to the Nyvlt model [24,25]:
=
(
)
+m k m
ln( ethanol) 1nnln mwater1 dCdReq 1nln( )N n1ln( ethanol). The slope and the Y-intercept of the straight line obtained give the nucleation parameters n and kn(mN =k CN n) or complex functions m and K of
both nucleation and growth kinetics parameters if the first crystals are not detected immediately. Values of n (or m) and kN (or K) are
re-spectively equal to 2.4 and 12.5 kg ethanol/kg water/s in silent con-ditions and 2.7 and 366.2 kg ethanol/kg water/s with ultrasound (28 W). The nucleation order values are in agreement with values ranged between 2.47 and 2.65 found by Bazi et al. for the Dolder® glycine obtained by antisolvent crystallization[16]. By considering that the crystals are detected immediately, the nucleation rate increases in presence of ultrasound.
The resulting crystals are smaller, and the crystal size distributions are narrower when ultrasound is used (Fig. 6). The images obtained by SEM are in agreement with the particle size distribution (Fig. 5). The size distributions of crystals obtained in silent condition are very large but few effects on mean volume diameter d4,3are observed as function
of the addition rate. In presence of ultrasound, an increase of d4,3is
observed with the addition rate (between 0.04 and 0.09 g/min), which is in agreement with the works of Vishwakarma et al.[26]and is due, in our case, to agglomeration and a decrease of this diameter with addi-tion rate (between 0.09 and 0.36 g/min). No agglomerates were ob-served at 0.19 and 0.36 g/min. At low addition rate, ultrasound seems
0.05 g ethanol/min 0.09 g ethanol/min 0.19 g ethanol/min 0.36 g ethanol/min Silent condition
28 W
to favor agglomeration.
4.3.2. Influence of dissipated power
The Fig. 7 presents the supersaturation ratio for a mass ratio of ethanol/water of 0.05 as function of time in silent conditions and with three dissipated power: 13, 28 and 40 W; for an addition flowrate of 0.19 g/min, Slimitdecreases in presence of ultrasound that is equivalent
to a narrower metastable zone width. However, no difference is ob-served between experiments conducted with an ultrasonic power of 13 and 28 W. At 40 W, the decrease of supersaturation is faster, and the crystallization is finished at 40 min instead of 80 min (at 13 and 28 W) or 120 min without ultrasound. These observations suggest that an in-crease of power linked with cavitation effects induces an inin-crease of nucleation and growth rates in agreement with previous results[26]. The shape of crystals obtained at 13 W is less regular than the shape of those obtained without ultrasound or at 28 W (Fig. 8). Lots of ag-glomerates are observed at 13 W.
Crystallization by anti-solvent effect is very sensitive to the mixing between the solvent and the solution, and the effect of mixing intensity on the properties of the crystals is well-known even in standard crys-tallization conditions: a good mixing allows to avoid high-super-saturation local spots in the vessel, and for example, the position of ethanol addition itself is known to influence the crystal size distribution
[27]. In the present experiments under silent conditions, a rather poor mixing is expected, resulting in large local supersaturation gradients, which yield in turn very dispersed crystal sizes. Cavitation is known to enhance mixing either by acoustic (macroscopic) streaming, acting as if additional mechanical stirring were present [28–35], or by
micro-Fig. 6. Size distributions of resulting crystals for the experiment conducted in
silent condition (a) and with a dissipated power of 28 W (b). a- in silent con-dition (empty square marker 0.36 g ethanol/min, empty diamond marker 0.19 g ethanol/min, empty circle marker 0.09 g ethanol/min, empty triangle marker 0.046 g ethanol/min). b- with dissipated power of 28.3 W (filled square marker 0.36 g ethanol/min, filled diamond marker 0.19 g ethanol/min, filled circle marker 0.09 g ethanol/min, filled triangle marker 0.046 g ethanol/min).
0 20 40 60 80 100 120 Time (min) Silent condition 40 W 13 W 28 W
theoritical supersaturation ratio (no crystallization) 1.14 1.12 1.10 1.08 1.06 1.04 1.02 1.00 0.98 Supersaturation ratio, S
Fig. 7. Supersaturation ratio as a function of time for the experiment conducted
with an addition rate of 0.19 g ethanol/min in silent condition and with ul-trasound (13, 28 and 40 W). Filled square marker 40 W, filled diamond marker 28 W, filled triangle marker 13 W and empty diamond marker 0 W.
streaming caused by bubble spherical and/or non-spherical oscillations
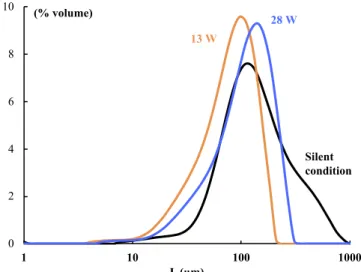
[36–38], and bubble jetting[39–41]. Thus, under ultrasound, the in-tense cavitation near the sonotrode tip may enhance mixing and smooth out spatially the supersaturation, producing a narrower crystal size distribution as evidenced inFig. 9. It should be noted that the latter figure also shows that crystals obtained at 13 W are slightly smaller than at 28 W, with a comparable dispersity. This trend is opposed to what is usually observed in sono-crystallization by cooling[14], and suggests that this result might also be attributed specifically to mixing effects. Whether the latter is connected with nucleation, growth or agglomeration remains to be explained.
From these experiments, we can conclude that ultrasound has an influence on the crystallization rate (nucleation and growth rates) due to the fact that for the same profile of de-supersaturation, two different size distributions are obtained. For a dissipated power ranged of 13 W (minimal power), a mean volume diameter d4,3of 90 µm is observed
and for 28 W a value of 126 µm is obtained. The rate of de-super-saturation is higher in presence of ultrasound inducing a higher nu-cleation rate or a higher growth rate or both. From experimental re-sults, modeling of crystallization will permit to conclude on crystallization rates.
4.3.3. Influence of pulsation
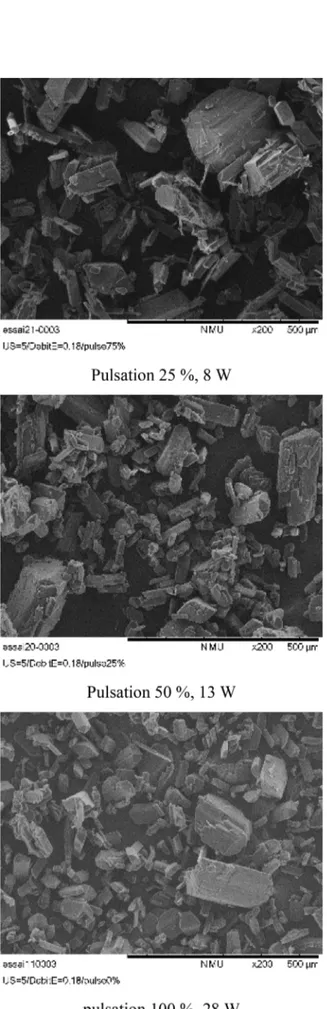
Experiments with pulsed ultrasound are conducted with a mass ratio of 0.05 g ethanol/g water and an addition flowrate of 0.19 g ethanol/ min: 50 on/50 off and 25 on/70 off equivalent to a dissipated power of 13.4 and 8 W. Results on morphology an in size distribution of crystals are compared to results obtained with continuous application of ul-trasound (Figs.10and11). The size distributions and the profiles of supersaturation ratio are identical (not shown) whatever the operating conditions. The pulsed ultrasound condition (50 on/50 off) seems to be interesting as similar results are obtained: comparable size distributions and reassembling concentration profiles. However fine crystals (nee-dles) are observed in the case of pulsed ultrasound at low power like without ultrasound (Fig. 5).
no ultrasound
= 13 W
Fig. 8. SEM images of the resulting crystals obtained with an addition rate of
0.19 g ethanol/min and a mass ratio of ethanol of 0.05 g ethanol/g water in silent condition and with ultrasound (13 and 28 W).
0 2 4 6 8 10 1 10 100 1000 (% volume) L (µm) 13 W 28 W Silent condition
Fig. 9. Size distributions of resulting crystals for the experiment conducted with
an addition rate of 0.19 g ethanol/min in silent condition and with ultrasound (13 and 28 W).
5. Conclusion
In this work, the feasibility of a crystallization of glycine by anti-solvent effect assisted by ultrasound is shown. At the operating condi-tions tested, the metastable form of glycine (α-form) is generated. Ethanol addition rates and ultrasound can modify the starting point of the crystallization, the maximal supersaturation ratio (lower super-saturation) and the crystal size distributions (obtained crystals are smaller which may mean a higher nucleation rate). An identification of nucleation kinetic parameters confirms that the nucleation rate in-creases in presence of ultrasound.
References
[1] A. Mersmann, Crystallization Technology Handbook, 2nd ed., Marcel Dekker, New York, Etats-Unis d’Amérique, 2001.
[2] M. Manish, J. Harshal, P. Anant, Melt sonocrystallization of ibuprofen: effect on crystal properties, Eur. J. Pharm. Sci. 25 (2005) 41–48,https://doi.org/10.1016/j. ejps.2005.01.013.
[3] S.R. Iyer, P.R. Gogate, Ultrasound assisted crystallization of mefenamic acid: effect of operating parameters and comparison with conventional approach, Ultrason. Sonochem. 34 (2017) 896–903,https://doi.org/10.1016/j.ultsonch.2016.08.001. [4] N. Belkacem, M.A. Sheikh Salem, H.S. AlKhatib, Effect of ultrasound on the
physico-chemical properties of poorly soluble drugs: antisolvent sonocrystallization of ke-toprofen, Powder Technol. 285 (2015) 38–44,https://doi.org/10.1016/j.powtec. 2015.06.058.
[5] S.-J. Park, S.-D. Yeo, Liquid antisolvent recrystallization of phenylbutazone and the effect of process parameters, Sep. Sci. Technol. 46 (2011) 1273–1279,https://doi. org/10.1080/01496395.2010.551167.
[6] S.V. Dalvi, R.N. Dave, Analysis of nucleation kinetics of poorly water-soluble drugs in presence of ultrasound and hydroxypropyl methyl cellulose during antisolvent precipitation, Int. J. Pharm. 387 (2010) 172–179,https://doi.org/10.1016/j. ijpharm.2009.12.026.
[7] C.-S. Su, P.-Y. Wu, W.-D. Jheng, Recrystallization of phenacetin and sulfathiazole using the sonocrystallization process, J. Taiwan Inst. Chem. Eng. 59 (2016) 106–112,https://doi.org/10.1016/j.jtice.2015.08.009.
[8] J. Li, Y. Bao, J. Wang, Effects of sonocrystallization on the crystal size distribution of cloxacillin benzathine crystals, Chem. Eng. Technol. 36 (2013) 1341–1346,
https://doi.org/10.1002/ceat.201200726.
[9] S.V. Pereira, F.B. Colombo, L.A.P. de Freitas, Ultrasound influence on the solubility of solid dispersions prepared for a poorly soluble drug, Ultrason. Sonochem. 29 (2016) 461–469,https://doi.org/10.1016/j.ultsonch.2015.10.022.
[10] U.N. Hatkar, P.R. Gogate, Process intensification of anti-solvent crystallization of salicylic acid using ultrasonic irradiations, Chem. Eng. Process. Process Intensif. 57–58 (2012) 16–24,https://doi.org/10.1016/j.cep.2012.04.005.
[11] M.-W. Park, S.-D. Yeo, Antisolvent crystallization of carbamazepine from organic solutions, Chem. Eng. Res. Des. 90 (2012) 2202–2208,https://doi.org/10.1016/j. cherd.2012.05.001.
[12]R. Ambrus, N.N. Amirzadi, P. Sipos, P. Szabó-Révész, Effect of sonocrystallization on the habit and structure of Gemfibrozil crystals, Chem. Eng. Technol. 33 (2010) 827–832.
[13] S. Gracin, M. Uusi-Penttilä, Å.C. Rasmuson, Influence of ultrasound on the nu-cleation of polymorphs of p-aminobenzoic acid, Cryst. Growth Des. 5 (2005)
Fig. 10. SEM images of resulting crystals obtained with pulsed and continuous
ultrasound application with an addition rate of 0.19 g/min.
Fig. 11. Size distributions of resulting crystals for the experiment conducted
with continuous ultrasound (28 W) and pulsed ultrasound of 13 W (on 50/off 50) and 8 W (on 25/off 75).
1787–1794,https://doi.org/10.1021/cg050056a.
[14] F. Baillon, F. Espitalier, C. Cogné, R. Peczalski, O. Louisnard, 28 – Crystallization and freezing processes assisted by power ultrasound, in: J.A. Gallego-Juárez, K.F. Graff (Eds.), Power Ultrason. Woodhead Publishing, Oxford, 2015, pp. 845–874https://doi.org/10.1016/B978-1-78242-028-6.00028-4.
[15] X. Yang, C.B. Ching, X.J. Wang, J. Lu, Polymorphism in the crystallization of gly-cine, AICHE Annu. Meet. San Fransisco CA, (2006).
[16] W. El Bazi, C. Porte, I. Mabille, J.-L. Havet, Antisolvent crystallization: effect of ethanol on batch crystallization of α glycine, J. Cryst. Growth 475 (2017) 232–238,
https://doi.org/10.1016/j.jcrysgro.2017.06.021.
[17] M. Louhikultanen, M. Karjalainen, J. Rantanen, M. Huhtanen, J. Kallas, Crystallization of glycine with ultrasound, Int. J. Pharm. 320 (2006) 23–29,https:// doi.org/10.1016/j.ijpharm.2006.03.054.
[18] F. Baillon, F. Espitalier, C. Cogné, R. Peczalski, O. Louisnard, Crystallization and freezing processes assisted by power ultrasound, 2015.
[19] K. Renuka Devi, A. Raja, K. Srinivasan, Ultrasound assisted nucleation and growth characteristics of glycine polymorphs – a combined experimental and analytical approach, Ultrason. Sonochem. 24 (2015) 107–113,https://doi.org/10.1016/j. ultsonch.2014.11.006.
[20] N. Lyczko, F. Espitalier, O. Louisnard, J. Schwartzentruber, Effect of ultrasound on the induction time and the metastable zone widths of potassium sulphate, Chem. Eng. J. 86 (2002) 233–241,https://doi.org/10.1016/S1385-8947(01)00164-4. [21] A. Bouchard, G.W. Hofland, G.-J. Witkamp, Solubility of glycine polymorphs and
recrystallization of β-glycine, J. Chem. Eng. Data 52 (2007) 1626–1629,https:// doi.org/10.1021/je700014k.
[22] L.A. Ferreira, E.A. Macedo, S.P. Pinho, Solubility of amino acids and diglycine in aqueous–alkanol solutions, Chem. Eng. Sci. 59 (2004) 3117–3124,https://doi.org/ 10.1016/j.ces.2004.05.001.
[23] W. El Bazi, Cristallisation discontinue et semi-continue de la glycine. Etude de l’influence d’un anti-solvant, Conservatoire national des Arts et Métiers, 2011. [24] P.H. Karpinski, J. Nývlt, Metastable zone width in salting-out crystallization, Cryst.
Res. Technol. 18 (1983) 959–965,https://doi.org/10.1002/crat.2170180722. [25] Y. Zhang, Y. Jiang, D. Zhang, Y. Qian, X.Z. Wang, Metastable zone width, crystal
nucleation and growth kinetics measurement in anti-solvent crystallization of β-artemether in the mixture of ethanol and water, Chem. Eng. Res. Des 95 (2015) 187–194,https://doi.org/10.1016/j.cherd.2014.10.018.
[26] R.S. Vishwakarma, P.R. Gogate, Intensified oxalic acid crystallization using ultra-sonic reactors: understanding effect of operating parameters and type of ultraultra-sonic reactor, Ultrason. Sonochem. 39 (2017) 111–119,https://doi.org/10.1016/j. ultsonch.2017.04.015.
[27] J.W. Mullin, Industrial Crystallization, Fourth ed., Butterwoth-Heinemann, 2001. [28] N. Gondrexon, V. Renaudin, C. Petrier, M. Clement, P. Boldo, Y. Gonthier, et al.,
Experimental study of the hydrodynamic behaviour of a high frequency ultrasonic reactor, Ultrason. Sonochem. 5 (1998) 1–6, https://doi.org/10.1016/S1350-4177(97)00043-6.
[29] P.S. Kumar, M.S. Kumar, A.B. Pandit, Experimental quantification of chemical elects of hydrodynamic cavitation, Chem. Eng. Sci. 7 (2000).
[30] N.A. Tsochatzidis, P. Guiraud, A.M. Wilhelm, H. Delmas, Determination of velocity, size and concentration of ultrasonic cavitation bubbles by the phase-Doppler technique, Chem. Eng. Sci. 56 (2001) 1831–1840, https://doi.org/10.1016/S0009-2509(00)00460-7.
[31] O. Dahlem, J. Reisse, V. Halloin, The radially vibrating horn: a scaling-up possibility for sonochemical reactions, Chem. Eng. Sci. 54 (1999) 2829–2838,https://doi.org/ 10.1016/S0009-2509(98)00356-X.
[32] M. Chouvellon, Velocity study in an ultrasonic reactor, Ultrason. Sonochem. 7 (2000) 207–211,https://doi.org/10.1016/S1350-4177(00)00060-2.
[33] A. Mandroyan, R. Viennet, Y. Bailly, M. Doche, J. Hihn, Modification of the ultra-sound induced activity by the presence of an electrode in a sonoreactor working at two low frequencies (20 and 40 kHz). Part I: active zone visualization by laser tomography, Ultrason. Sonochem. 16 (2009) 88–96,https://doi.org/10.1016/j. ultsonch.2008.05.003.
[34] J.-Y. Hihn, M.-L. Doche, A. Mandroyan, L. Hallez, B.G. Pollet, Respective con-tribution of cavitation and convective flow to local stirring in sonoreactors, Ultrason. Sonochem. 18 (2011) 881–887,https://doi.org/10.1016/j.ultsonch.2011. 02.006.
[35] O. Louisnard, A viable method to predict acoustic streaming in presence of cavi-tation, Ultrason. Sonochem. 35 (2017) 518–524,https://doi.org/10.1016/j. ultsonch.2016.09.013.
[36] M. Kornfeld, L. Suvorov, On the destructive action of cavitation, J. Appl. Phys. 15 (1944) 495–506,https://doi.org/10.1063/1.1707461.
[37] P.R. Birkin, D.G. Offin, C.J.B. Vian, T.G. Leighton, A.O. Maksimov, Investigation of noninertial cavitation produced by an ultrasonic horn, J. Acoust. Soc. Am. 130 (2011) 3297–3308,https://doi.org/10.1121/1.3650537.
[38] P.R. Birkin, Y.E. Watson, T.G. Leighton, Efficient mass transfer from an acoustically oscillated gas bubble, Chem. Commun. Chem. Comm. R. Soc. Chem. (2001) 2650–2651.
[39] J.R. Blake, Giles S. Keen, Robert P. Tong, Miles Wilson, Acoustic cavitation: the fluid dynamics of non-spherical bubbles, Philos. Trans. R. Soc. Lond. Ser. Math. Phys. Eng. Sci. 357 (1999) 251–267,https://doi.org/10.1098/rsta.1999.0326. [40] L. Crum, Surface oscillations and jet development in pulsating bubbles,
C8-285–C8-288, J. Phys. Colloq. 40 (1979),https://doi.org/10.1051/jphyscol: 1979849. [41] F. Prabowo, C.-D. Ohl, Surface oscillation and jetting from surface attached acoustic