HAL Id: hal-02517089
https://hal.univ-angers.fr/hal-02517089
Submitted on 24 Sep 2020
HAL is a multi-disciplinary open access
archive for the deposit and dissemination of
sci-entific research documents, whether they are
pub-lished or not. The documents may come from
teaching and research institutions in France or
abroad, or from public or private research centers.
L’archive ouverte pluridisciplinaire HAL, est
destinée au dépôt et à la diffusion de documents
scientifiques de niveau recherche, publiés ou non,
émanant des établissements d’enseignement et de
recherche français ou étrangers, des laboratoires
publics ou privés.
Analyse de la qualité d’ajustement d’une base de
données de dégradation
Peter B. El Hajj, Bruno Castanier, Franck Schoefs
To cite this version:
Peter B. El Hajj, Bruno Castanier, Franck Schoefs. Analyse de la qualité d’ajustement d’une base
de données de dégradation : Exploitation d’une base de données de suivi d’exploitation. Journées
Fiabilité des Matériaux et des Structures (JFMS2016), Mar 2016, Nancy, France. �hal-02517089�
Analyse de la qualité d’ajustement d’une base de données de
dégradation
– Exploitation d’une base de données de suivi
d’exploitation.
Boutros EL HAJJ *
— Bruno CASTANIER **
— Franck SCHOEFS *
*
Institut de Recherche en Génie Civil et Mécanique GeM – Université de Nantes [email protected]**
Laboratoire Angevin de Recherche en Ingénierie des Systèmes LARIS – Université d’AngersRÉSUMÉ. La qualité d’un processus d’estimation statistique est directement liée à la richesse de l’échantillon disponible. Dans un
contexte de Génie Civil, il est rare de pouvoir considérer que les structures formant cet échantillon soient homogènes. Nous sommes donc toujours dans le compromis entre un nombre suffisant d’observations et l’homogénéité de ce même échantillon. Nous proposons dans cette communication de nous intéresser à la relation entre la caractérisation spécifique du comportement d’un individu parmi une population donnée et la qualification d’une base de données en fonction de son niveau d’hétérogénéité. Pour cela, nous proposons d’analyser les performances en termes d’adéquation statistique au modèle de dégradation sur la base de données simulées présentant des niveaux d’hétérogénéité différents. Cette étude permet de dessiner les premiers points pour une méthodologie de qualification d’une base de données en terme d’hétérogénéité orientée aide à la décision dans un contexte de gestion des risques et de maintenance. Le modèle de dégradation étudiée est basé sur des processus stochastiques, dépendant de l'état, non stationnaire, et ayant une distribution gamma.
ABSTRACT. The quality of a statistical estimation process is directly linked to the richness of the available database. In Civil Engineering,
it is rare to consider that the structures forming a database are homogeneous. We are always in the compromise between a sufficient number of observations and the homogeneity of the database. In this paper, we are interested in the relationship between the specific characterization of the behaviour of an individual from a given population and the qualification of a database according to its level of heterogeneity. To this aim, we propose to analyse the performance of the estimation process in terms of statistical relevance to degradation model using simulated databases with different levels of heterogeneity. This study aims to draw the first points for methodological qualification of a heterogeneity in database decision support in a context of risk management and maintenance. The studied degradation model is based on a bi-variate, state-dependant stochastic processes with a gamma distribution.
MOTS-CLÉS: modélisations de dégradation, processus d’estimation, processus gamma dépendant de l’état, processus stochastique
non-stationnaires, hétérogénéité de base de données.
Analyse de la qualité d’ajustement d’une base de données de dégradation 2
1. Introduction
The construction of predictive degradation models for mechanical and civil engineering that takes into account uncertainties remains a real challenge for the scientific community. The most common approaches in this context are the integration of the effects of the uncertainties in models by means of randomization of their parameters in ranges that are representative of the degree of uncertainty, the variability of the initial composition of materials and the environment.
In this uncertain context, the parameters of a predictive degradation model must be updated from newly available data by approaches such as "inverse problems" or "Bayesian approaches”. However, these approaches suffer from several difficulties, for example, the hypothesis of homogeneity of materials and behaviours does not ensure the generalisation of a local analysis of degradation to the assessment of the overall performance of the structure; the effects of this hypothesis evolve with the course of the operation. We can also mention problems associated with the identification of the parameters of the degradation model, especially when often their relationship to observed effects is the result of complex physico-chemical couplings, not to mention the associated numerical difficulties.
The literature is rich with degradation models that are specific to different modes of mechanical degradation (corrosion, wear, fatigue, etc.). These models aim to predict the degradation of the structure and can also be used for calculations such as life expectancy, reliability and maintenance decisions. In this scope, we can see the importance of an adaptive degradation model to different pathologies (Si et al. 2011). Approaches based on stochastic processes display a statistical and mechanistic relevance for modelling of accumulative degradation encountered in civil engineering, especially the gamma process (Van Noortwijk 2009). Here, we propose to model degradation using non-stationary state-dependant approaches; calibrated and updated from NDT inspection data.
In this study, we are interested in cases where databases are poor in size. The estimation and calibration of a model from such databases can result in large uncertainty associated with the estimated parameters. Therefore, an aim of this work is to propose a procedure to narrow down the uncertainty surrounding the estimation of the parameters. One solution is by considering the association of heterogeneous databases (e.g., two close buildings having the same design). The ultimate objective is to increase the confidence in a maintenance plan applied to a farm of similar structures by increasing the number of samples or to know if it is required to consider sub-families. In this context, we consider heterogeneous structures as structures built with identical material and procedures, and situated in similar environments (same reliability classes (Eurocode 2005)).
In this paper, we aim to carry out a preliminary investigation and analysis on the trade-off between the quality of the data in terms of homogeneity and the sufficient sample size to ensure the convergence of the estimation process. In order to identify the effects of the heterogeneity of the database on the quality of the estimate, we will use a simulated database discussed within an application to the cracking of concrete due to corrosion.
We are interested in discrete-in-time inspection, and we will consider only homogeneity related the material variability. To our knowledge, there are no studies applied in these cases, however, we found papers dealing with heterogeneity related to data collection procedures (Gangone, Whelan, and Janoyan 2011) (such as different physical indicators, combined dynamic and static assessment), and studied for SHM in (Glisic et al. 2014).
This paper is organised as follows. In section 2 the degradation model and the estimation algorithm are briefly explained. In section 3 we discuss methods to model heterogeneity in the model. In section 4 an illustration of utilising heterogeneous databases to ameliorate the calibration of the model. Finally, in section 5 conclusions and perspectives work are drawn.
2. Degradation model
The use of degradation meta-models based on stochastic processes such as the gamma process seems promising for maintenance management and optimization in civil engineering (Van Noortwijk 2009). It allows modelling the evolution of the degradation using observations via NDT (inputs) while maintaining the most critical aspects of the degradation mechanism (outputs) in the model for the decision.
In this section, we present the multi-variate non-stationary state-based degradation meta-model, used to model the degradation in this study. The meta-model represents the degradation process by modelling chosen physical indicators using state-based stochastic processes. The choice of the physical indicators is grounded on their weight in representing the degradation process, their accessibility through NDT, and on their importance in decision making. The idea of modelling the degradation using more than one variable can be very rewarding in terms of degradation modelling and maintenance management (El Hajj et al. 2015a). For more details on the investigated degradation model, please refer to (El Hajj et al. 2015b).
2.1. Pathology and choice of indicators
In this paper, we propose to treat the case of crack propagation due to corrosion. This deterioration is dominated by the excessive accumulation of rust from the ongoing corrosion process resulting in crack propagation until reaching the ultimate point of rupture.
The parameters of importance in this phase are the corrosion current density and the width of the crack (Li et al., 2006). These parameters are important to decision making and are accessible through NDT. The corrosion current density
𝑖𝑐𝑜𝑟𝑟 is an instantaneous rate of corrosion measured using NDT, expressed in (𝜇𝐴/𝑐𝑚²). The crack is considered reachable
and its width is easily measured (Gauge block or image analysis: (O’Byrne et al., 2013; O’Byrne et al., 2014)). 2.2. Degradation model
The cracking phase due to corrosion is then characterized by two state-dependent gamma processes: (𝜌𝑡)∀𝑡≥0 modelling the width of the crack « a » (mm)
(𝜃𝑡)∀𝑡≥0 modelling the corrosion current density « icorr » (μA/cm2)
The evolution of degradation over a period of time 𝜏 is given by positive increments for the degradation processes respectively (𝛥𝜌, 𝛥𝜃) which are gamma distributed with two time independent parameters each, these are respectively: A state-based shape function 𝛼. 𝜏, and a constant scale parameter 𝛽.
In order to simulate the processes, we first seek to characterize the evolution in terms of the 𝜃-process (i.e., corrosion current density and can be seen as the original causal process), then doing so for the respective effect 𝜌-process (i.e., crack width and can be seen as an effect process).
Therefore, the process is sequential and we can then write, ∀(𝜌, 𝜃) > 0 :
∆𝜃(𝜏 ; 𝜌, 𝜃) ~ 𝑔(𝛼𝜃( 𝜌, 𝜃). 𝜏, 𝛽𝜃) (1)
∆𝜌(𝜏 ; 𝜌, 𝜃, ∆𝜃) ~ 𝑔(𝛼𝜌(𝜌, 𝜃, ∆𝜃). 𝜏, 𝛽𝜌) (2)
With the respective shape functions: 𝛼𝜃( 𝜌, 𝜃)
= (𝑎
3.
𝜌+ 𝑎
4). 𝑒
−(𝜃−𝑎1)2
𝑎2 and 𝛼𝜌
(
𝜌, 𝜃, ∆𝜃) = (𝑎
6. (
𝜃+
∆𝜃2
) + 𝑎
7) . 𝑒
−𝑎5.𝜌 (3)Discussions for the construction of the respective parametric shape functions 𝛼𝜃(𝜌, 𝜃) and 𝛼𝜌(𝜌, 𝜃, Δ𝜃) can be found in (El Hajj et al. 2015a). For the estimation process, we have proposed an estimation procedure based on the maximum likelihood method (𝑀𝐿𝐸). Details can be found in the same reference.
Hereafter, we denote 𝛩 as a parameter vector formed of the parameters 𝛩 = [𝑎1, 𝑎2, 𝑎3, 𝑎4, 𝑎5, 𝑎6, 𝑎7, 𝑎8, 𝑎9, 𝛽𝜌, 𝛽𝜃]. 3. Heterogeneity description
The study of heterogeneity, or homogeneity, falls into what is known as meta-analysis, or analysis of analyses (Glass 2012), that aims to combine results from different and independent studies. There is a trend among some researchers that attempt to homogenize the a priori heterogeneous database by seeking to identify covariates (marginal law analysis). This leads to analysing the behaviour of these covariates (per elsewhere stochastic), resulting in more and complex evolution laws. The validity of any distribution assumption remains heavily criticized, and generally for most meta-analysis, it appears that heterogeneity is being consistently underestimated in most meta-analysis (Kontopantelis, Springate, and Reeves 2013). Even though the study of heterogeneity is old (Simpson and Pearson 1904) and extensive (Hunter and Schmidt 2004), Kontopantelis et al. have emphasized on the complexity of assessing heterogeneity and the necessity for more developed methods (Gavaghan, Moore, and McQuay 2000).
For example, a classical approach to measure heterogeneity is the use of Cochran’s Q test, where the null hypothesis that all studies are evaluating the same effect is examined. Cochran’s Q is computed as the weighted sum of squared differences between each study’s estimate and the overall estimate across studies, weighting each study’s contribution in the same manner as in the meta-analysis. Q is distributed as a chi-square statistic with k (number of studies) minus 1 degrees of freedom (Cochran 1954).
However, to study heterogeneity in databases, we first need to have one. Since we lack of real databases, we propose a simple method to simulate heterogeneous databases using the degradation meta-model introduced in section 2. Then, using the simulated databases, we investigate the stability/accuracy/quality of the estimation process.
Analyse de la qualité d’ajustement d’une base de données de dégradation 4 Therefore, first we consider the existence of an original (basic) homogeneous database formed of 5 realisations, generated using the degradation-meta model using the following parameters:
𝑎1= 1, 𝑎2 = 1, 𝑎3= 1, 𝑎4= 1.2, 𝑎5= 0.8, 𝑎6= 1.8, 𝑎7= 2, 𝛽𝜌= 0.3, 𝛽𝜃= 0.3.
The 5 realisations are considered from 5 statistically independent but identical structures.
Then, to the original (homogeneous) database, we add generated heterogeneous realisations that accounts for new added heterogeneous structures. The generated heterogeneous databases are generated using the same degradation meta-model with modification of the parameters.
The heterogeneity in a generated databases is controlled by a quantified modification of the parameters. In the next section, we explain the proposed approach to simulate heterogeneous realisations.
3.1. Generating the heterogeneous realisations
The simulation of heterogeneity is carried out in two step:
Step-1: Introduce a jump – hereafter denoted ℎ – on the parameters of the bivariate model:
The jump on the parameters ℎ which also can be seen as the heterogeneity level of the simulated database, is expressed in terms of percentage over the original parameters (for example ℎ = +10%).
Step-2: Apply a small variability of ∓2.5% on the jump
The added variability of ∓2.5% aims to cover a family of structures that have a very close variation around the original jump ℎ. A family of structures is a group of structures that are supposed to be identical but due to uncertainties, relate to civil engineering (conception, design, etc.), are slightly different.
In this study, we consider the possibility of adding 𝑁 structure(s) or realisation(s) to the original databases, where 𝑁 ∈ [1,15]. The aim here is to add one realisation at a time and investigate its effect on the estimation process.
To summarize, the simulation of heterogeneous databases is done by modifying the parameters of bi-variate model as follow:
𝑎𝑖= 𝑎𝑖× (1 + 𝑢𝑛𝑖𝑟𝑛𝑑(ℎ − 2.5%, ℎ + 2.5%)) and 𝛽 = 𝛽 × (1 + 𝑢𝑛𝑖𝑟𝑛𝑑(ℎ − 2.5%, ℎ + 2.5%)) (4)
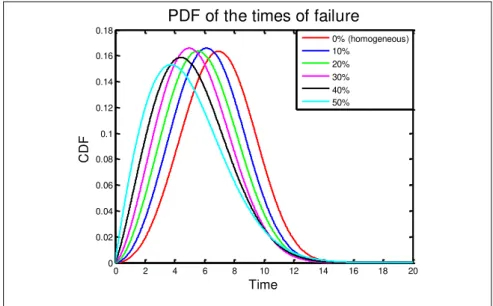
Where 𝑢𝑛𝑖𝑟𝑛𝑑 is a uniform distribution, 𝑎𝑖 and 𝛽 are the parameters of the degradation meta-model (Eq. 1, 2 and 3). The value of ℎ accounts for the family of structures in the interval [ℎ − 2.5%, ℎ + 2.5%]. The considered values for ℎ are: 0%, 10%; 20%, 30%, 40% and 50%. These values generates realisation with faster degradation than the original ones as it is illustrated in Figure 1 where the estimated 𝑃𝐷𝐹s of the times of failure are summarized.
Figure 1.
PDF of failure for different sent of parameters
0 2 4 6 8 10 12 14 16 18 20 0 0.02 0.04 0.06 0.08 0.1 0.12 0.14 0.16 0.18
PDF of the times of failure
C D F Time 0% (homogeneous) 10% 20% 30% 40% 50%
3.2. Effect of heterogeneous databases on the estimation process
We propose to analyse the effect of including heterogeneous databases for the estimation process using the Mean Squared Error (𝑀𝑆𝐸) as a comparison measure. The 𝑀𝑆𝐸 is used as the performance criteria for the estimation process. To illustrate the performance of the estimation process and its convergence, we propose to evaluate the MSE of the estimated parameter vector 𝛩̂ based on the simulated database given the set of the true parameter values 𝛩∗:
𝑀𝑆𝐸 = 𝑡𝑟𝑎𝑐𝑒 {𝐸 {(𝛩̂ − 𝛩∗)(𝛩̂ − 𝛩∗)𝑇}} (5)
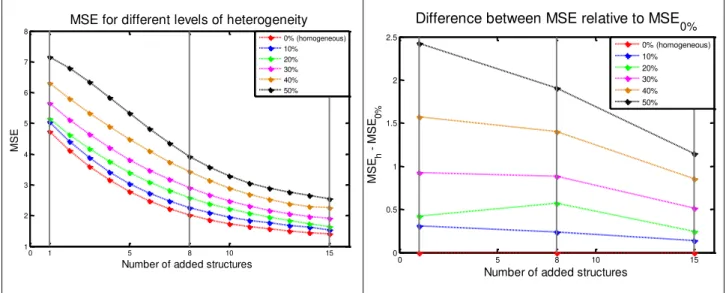
The parameters of the model are estimated every time a new structure is added. Then, the 𝑀𝑆𝐸 is calculated using 2000 simulations. Results are plotted in Figure 2, where every point on this curve is the MSE for N added structure(s) and their associated level heterogeneity ℎ. To study the effect of added heterogeneity, we propose to compare each curve with the one issued from the homogeneous databases, i.e., the bottom one (in red). To that aim, in Figure 3 we illustrate the evolution of the relative difference, i.e. 𝑀𝑆𝐸ℎ− 𝑀𝑆𝐸0%.
Figure 2.
𝑀𝑆𝐸s for different level of heterogeneity
function of the number of added structures on the 5
original structures
Figure 3.
Evolution of the difference between
𝑀𝑆𝐸
relative to
𝑀𝑆𝐸
0%In Figure 2, we can see that the curves share the same decreasing tendency, illustrating a convergence of the estimation toward the MSE of the heterogeneous set only. However, we notice that the evolution of the inter-distances between the six curves is not always the same (Figures 2 and 3). For 𝑁 = 1, the inter-distances between the curves are non-linear. Then, for 𝑁 = 8, we can see that there is a certain alteration to this pattern where the distances between the curves tend to become linear, before starting to diverge as we can see for 𝑁 = 15 where the curves illustrate non-linear inter-distances.
This variation is particularly observable for the ℎ = 20% (green curve) where for 𝑁 = 8 we can see a lump. For ℎ = 10%, we can see that the 𝑀𝑆𝐸 curve is close to the homogenous curve and retains the same distance from it.
We can theorize that for 𝑁 higher than the original number of structure (i.e. 5), the estimates start to drift from the original parameters towards the parameters of the added heterogeneous databases. Here we can talk of a first equilibrium. This theory was shown to be somehow true in the estimation code built under Matlab where the code tends to take longer time and become less efficient for 𝑁 ≅ 5. To further explain the last point, we propose to compare the efficiency of the estimation processes.
The estimation algorithm aims to maximize the likelihood function by varying the parameters of the model. However, this is a mechanical problem, therefore, constraints needs to be defined in order for the solution to be mechanically acceptable. In this case, we define the following ]0.2, 20[ and the estimated parameters. An estimation process is said to be successful if the estimates 𝛩̂ are all within this interval.
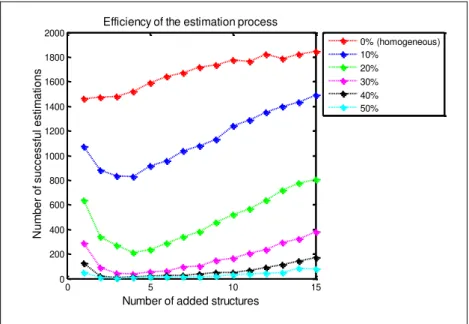
In Figure 4, we illustrate the efficiency of the estimation process. Efficiency is defined as the number of successful estimations, i.e. an estimation in the acceptable interval.
0 1 5 8 10 15 1 2 3 4 5 6 7 8
Number of added structures
M
S
E
MSE for different levels of heterogeneity
0% (homogeneous) 10% 20% 30% 40% 50% 0 5 8 10 15 0 0.5 1 1.5 2 2.5
Number of added structures
M S Eh M S E0 %
Difference between MSE relative to MSE
0% 0% (homogeneous) 10% 20% 30% 40% 50%
Analyse de la qualité d’ajustement d’une base de données de dégradation 6
Figure 4.
Efficiency of the estimation process
First of all, we can notice the constant increase in efficiency for the homogeneous case. This is evident since by adding more structures to the database, the estimation process tends to be more efficient. However, this tendency is not the same for the other cases. The efficiency for these cases decrease to reach a minimum at 𝑁 = 4, then start to increase.
The decrease in efficiency is due to the fact that sometimes it is impossible to estimate one set of parameters 𝛩̂ capable of generating such a disperse database. On the other hand, the increase in efficiency is due to the fact that the estimation process starts to converge towards the parameters of the heterogeneous database.
Furthermore, it is interesting to point out that the minimum efficiency is for 𝑁 = 4 and not for 𝑁 = 5, i.e., the size of the original database. A possible cause is that the added database has more variability on its parameters (∓2.5%), hence, will destabilize the equilibrium of the estimation process.
4. Conclusions and perspective
In this short paper, we proposed a preliminary study regarding heterogeneity in databases for the calibration of a degradation meta-model. The degradation meta-model is based on bi-variate state-based gamma processes (El Hajj et al. 2015b). There remain a difficulty in considering, defining and analysing heterogeneity.
A simple numerical example was proposed and portrays a potential numerical benefit of including heterogeneous databases, however, the study cannot be generalised. To that aim, in future works we will consider three original sets of parameters that are representative for three speeds of degradation: Normal, fast and slow; Normal being for the case presented in this paper (Figure 5).
Figure 5.
Figure Three original databases to be studied
0 5 10 15 0 200 400 600 800 1000 1200 1400 1600 1800 2000
Number of added structures
N u m b e r o f su ccessf u l e st im a ti o n s
Efficiency of the estimation process
0% (homogeneous) 10% 20% 30% 40% 50%
Other future works can include the investigation of the effect of the estimation process on the decision making process and the assessment of heterogeneity in a database, i.e. to know when to split a databases or a model in two.
5. Acknowledgments
The authors of this paper would like to thank the Region Pays de la Loire (France) for its support to the SI3M project. 6. References
Cochran, William G . 1954. “The Combination of Estimates from Different Experiments.” Biometrics 10 (1): 101–29.
El Hajj, Boutros, Bruno Castanier, Franck Schoefs, and Thomas Yeung. 2015a. “A Maintenance-Oriented Degradation Model for a Reinforced Concrete Structure Subject to Cracking.” Part O: Journal of Risk and Reliability (under Final Review).
———. 2015b. “A Condition-Based Deterioration Model for the Stochastic Dependency of Corrosion Rate and Crack Propagation in a Submerged Concrete Structure.” Computer-Aided Civil and Infrastructure Engineering (under Final Review).
Eurocode. 2005. BS EN 1992-2:2005 - Eurocode 2: Design of Concrete Structures - Part 2: Concrete Bridges - Design and Detailing
Rules. Eurocode 2. Vol. 2.
Gangone, Michael V., Matthew J. Whelan, and Kerop D. Janoyan. 2011. “Wireless Monitoring of a Multispan Bridge Superstructure for Diagnostic Load Testing and System Identification.” Computer-Aided Civil and Infrastructure Engineering 26 (7): 560–79 Gavaghan, David J., R. Andrew Moore, and Henry J. McQuay. 2000. “An Evaluation of Homogeneity Tests in Meta-Analyses in
Pain Using Simulations of Individual Patient Data.” Pain 85 (3): 415–24. doi:10.1016/S0304-3959(99)00302-4.
Glass, Gene V. 2012. “Primary, Secondary, and Meta-Analysis of Research’.” American Educational Research Association 5 (10): 3–8.
Glisic, Branko, Matthew T. Yarnold, Franklin L. Moon, and A. Emin Aktan. 2014. “Advanced Visualization and Accessibility to Heterogeneous Monitoring Data.” Computer-Aided Civil and Infrastructure Engineering 29 (5): 382–98.
Hunter, John E, and Frank L. Schmidt. 2004. Methods of Meta-Analysis: Correcting Error and Bias in Research Findings. https://books.google.fr/books/about/Methods_of_Meta_Analysis.html?id=kImkui18i94C&pgis=1.
Kontopantelis, Evangelos, David A Springate, and David Reeves. 2013. “A Re-Analysis of the Cochrane Library Data: The Dangers of Unobserved Heterogeneity in Meta-Analyses.” PloS One 8 (7): e69930. doi:10.1371/journal.pone.0069930.
Li, Chun-Qing, Robert E. Melchers, and Jian-Jun Zheng. 2006. “Analytical Model for Corrosion-Induced Crack Width in Reinforced Concrete Structures.” Structural Journal 103 (4): 479–87.
O’Byrne, Michael, Bidisha Ghosh, Franck Schoefs, and Vikram Pakrashi. 2014. “Regionally Enhanced Multiphase Segmentation Technique for Damaged Surfaces.” Computer-Aided Civil and Infrastructure Engineering 29 (9): 644–58.
O’Byrne, Michael, Franck Schoefs, Bidisha Ghosh, and Vikram Pakrashi. 2013. “Texture Analysis Based Damage Detection of Ageing Infrastructural Elements.” Computer-Aided Civil and Infrastructure Engineering 28 (3): 162–77.
Si, Xiao-Sheng, Wenbin Wang, Chang-Hua Hu, and Dong-Hua Zhou. 2011. “Remaining Useful Life Estimation – A Review on the Statistical Data Driven Approaches.” European Journal of Operational Research 213 (1). Elsevier B.V.: 1–14.
Simpson, R. J. S., and Arl Pearson. 1904. “Report On Certain Enteric Fever Inoculation Statistics on JSTOR.” The British Medical
Journal 2 (2288): 1243–46. http://www.jstor.org/stable/20282622?seq=1#page_scan_tab_contents.
Van Noortwijk, J.M. 2009. “A Survey of the Application of Gamma Processes in Maintenance.” Reliability Engineering & System