THE ARTS AND LOCAL ECONOMIC DEVELOPMENT:
A STUDY OF THE RELATIONSHIP BETWEEN ARTS-RELATED EMPLOYMENT AND KNOWLEDGE-INTENSIVE INDUSTRIES FOR LARGE AND SMALL URBAN PLACES IN CANADA
Mario Polèse
Inédit / Working paper, no 2011-04
THE ARTS AND LOCAL ECONOMIC DEVELOPMENT:
A STUDY OF THE RELATIONSHIP BETWEEN ARTS-RELATED
EMPLOYMENT AND KNOWLEDGE-INTENSIVE INDUSTRIES FOR LARGE AND SMALL URBAN PLACES IN CANADA
Mario Polèse*
Paper presented at the “Workshop on Creative Cities, Creative Classes: Towards an integrated framework” Unversité Paris-Sud, May 6th 2011
*The author holds the Senior Canada Research Chair in Urban and Regional Studies. He thanks the Social Science and Humanities Research Council of Canada (SSHRC) for its generous financial support.
Institut national de la recherche scientifique Centre - Urbanisation Culture Société
Montreal
Mario Polèse
Centre - Urbanisation Culture Société Institut national de la recherche scientifique 385, Sherbrooke Street East
Montreal (Quebec) H2X 1E3 Phone: (514) 499-4000 Fax: (514) 499-4065
www.ucs.inrs.ca
This document can be downloaded without cost at:
www.ucs.inrs.ca/sites/default/files/centre_ucs/pdf/Inedit04-11.pdf
Abstract
The paper looks at arts-related employment in 135 Canadian urban areas over 35 years (1971-2006), successively examining location patterns, co-location with knowledge-rich industries, and impacts on employment growth. Arts-related employment is found to be highly concentrated in the very largest urban centres, with no indication of change. Smaller places with particular attributes (attractive natural setting; proximity to large urban centres) are increasingly successful in attracting arts-related activities, but this is not necessarily associated with stronger employment growth or the development of knowledge-rich industries. Evidence of co-location with knowledge-rich industries is weak, but stronger for larger cities. No consistently significant relationship exists with employment growth. This holds true for all cities, irrespective of size. If a synergy exists between the arts and local development, the paper concludes, it is limited to specific industries and only operates in the context of large cities.
Key Words:
Urban Economics, the Arts, Local Economic Development, Canada
Résumé
Ce papier se penche sur l’emploi dans les activités artistiques dans 135 aires urbaines canadiennes sur une période de 35 ans (1971-2006) pour examiner, à tour de rôle, leur répartition spatiale, l’association avec des industries riches en savoir et les impacts possibles sur la croissance de l’emploi. Les activités artistiques sont fortement concentrées dans les plus grandes villes, une tendance qui se maintient sur toute la période. Des petites villes favorisées par certains attributs (attraits naturels, proximité aux grandes villes) connaissent de plus en plus de succès à attirer des communautés artistiques, mais cela ne se traduit pas forcement par une croissance plus forte ou l’arrivée d’industries riches en savoir. La relation avec de telles industries tient surtout pour des villes plus grandes. Cependant, il n’existe aucune relation générale entre croissance de l’emploi et activités artistiques, peu importe la taille de la ville. La possibilité d’une synergie entre les arts et le développement économique ne peut pas être rejetée; mais, elle se limiterait à des industries spécifies et ne jouerait que pour des grandes villes.
Mots clés :
INTRODUCTION
“Culture is now seen as the magic substitute for all the lost factories and warehouses”.
(Hall, 2000, p. 640)
“The idea that culture can be employed as a driver for urban economic growth has become part of the new orthodoxy…” (Miles and Paddison, 2005, p. 833) “…many cities are basing their long-tern economic strategies on increasing the number
of low-paid musicians and starving artists” (Phillips, 2011, p. 250)
Investment in the arts is increasingly seen as a means of stimulating local economies. This paper examines the possible relationship between the arts and local economic development, looking at Canadian cities. The operational definitions of „the arts‟ and „local economic development‟ are presented below. We examine, successively, the spatial distribution of individuals working in the arts (or consuming its products), the relationship with employment in knowledge-intensive industries and, last, with local employment growth. The analysis covers 135 Canadian urban places over a thirty-five year period (1971-2006). Particular emphasis is placed on the impact of urban size. Are arts-related activities and the possible economic benefits they entail essentially limited to big cities?
A WORD DEFINITION: CREATIVITY, CULTURE, ART
The last few years have seen an outpouring of writings bearing the adjective “creative” with Caves (2000), Cooke and Lazzeretti (2008), Florida (2002), Hall (2000), Hospers (2003), Howkins (2001), and Landry (2000) among the more prominent. Phillips (2011) does an excellent job of reviewing this vast literature. As might be expected, each author has his or her own definition of „creative‟. In addition to the authors cited, McGranahan and Wojan (2007), Smith and Warfield (2008), and Throsby. (2008) propose alternative frameworks for identifying „creative‟ industries or occupations. The most all-encompassing and certainly most well-known is that proposed by Florida (2002a), taking in some 30 % of the US workforce.
A recurring theme in the literature is the close relationship between culture, art, and creativity, with the implicit message that all are pointing to the same thing. Caves (2000) seminal work on creative industries is essentially a treatise on the interface between art, culture, and economics. Most major writings on creative cities or the creative economy assign a leading role to art and to cultural industries. The driving force, one implicitly understands, is the presence of restless,
unconventional, and inspired souls willing to challenge the established way of thinking, the traditional purview of poets, artists, and other ‘creative’ types, be it in Viennese coffee houses or Greenwich Village. Florida’s (2002b) Bohemian Index, basically the concentration of workers in the arts and culture, sends a similar message. Scott (2008), although coming from a different perspective, also makes the link between cultural production and what he calls the creative field. The production and the consumption of goods with a high cultural cognitive content and the ‘creativity’ that underlies them are, Scott argues, core attributes of modern economies.
The definition of what constitutes cultural industries is no less open-ended, and the debate just as lively. Cooke and Lazzeretti (2008), Smith and Warfield (2008), and Staber (2008) go to some length to explain that the two are distinct if related, the former essentially as a subset of the latter, but which still leaves much definitional leeway. In Canada, Statistics Canada (2004) has developed a formal definition used by Coish (2004) and more recently by Olfert and Partridege (2011), based on Canadian occupational classes. The focus in this paper is on activities associated with the production and the consumption of the arts, a subset of a subset so to speak.
However ‘the Arts’, no less than the other two concepts, are not translatable into a totally satisfactory quantitative measure. Something will always be lacking. The measure used here is presented below (Table 1). Two points are worth mentioning. First, industry rather than occupational classifications are used. We wish to examine the link, if any, between employment in the ‘the Arts’ and in knowledge-rich industries, compelling the use of industry data. Second, we wish to capture the presence not only of workers in the arts, but also of individuals with a taste for the arts, the ‘arts crowd’ (a term we shall use henceforth). The leading role attributed to the arts in the literature suggests that individuals engaged in the arts, be it as amateur musicians or painters, are (or should be) more open to new ideas.
LOCATION: WHERE DOES THE ARTS CROWD CONGREGATE?
The evidence that arts-related activities tend to concentrate in the very largest cities is overwhelming. For the US, Markusen and Schrock (2006), using a grouping of artistic occupations, find that by far the two highest relative employment concentrations (as measured by location quotients) were found in the greater New York and Los Angeles areas, with San Francisco an honourable runner-up in third place with a quotient of 1.87 in 2000. For Canada, Olfert and Partridge (2011), looking at cultural occupations, find the highest employment shares in Canada’s four largest metropolitan areas. In Britain, the dominance of London is undisputable (Nathan 2007).
Why should artists and related workers concentrate so overwhelmingly in large cities? The not terribly original answer is agglomeration economies. Taking the seven pillars of agglomeration suggested by Polèse (2009), five apply to artists: scale economies, centrality, localisation economies, diversity, and buzz. The infrastructures artists require to make a living are subject to economies of scale: film and sound studios; concert halls; theatres; museums; etc. Artistic productions, notably in the performing arts, are typical of services that require the consumer to travel to the place of consumption and as such subject to the rules of central place theory, naturally drawn to the centre of the market. Broadway is no fluke; that is where market potential is highest. The role of localisation economies – proximity to other artists and related professionals – hardly needs to be explained. The same can be said for diversity. Artistic productions - films, plays, TV series, operas – require a variety of talent in constantly changing proportions. And finally buzz. Most artists, certainly in the entertainment industry, are nothing if not social animals. To be ‘where it’s at’ and to be seen there is at the very heart of many artistic professions.
The forces driving artists towards large cities are seemingly irreversible. Authors concerned with the fate of rural areas and small cities (Gabe et al 2007, Lewis and Donald 2010, McGranahan and Wojan 2007, Petrov 2007, Waite and Gibson 2009) often accuse the ‘creative’ discourse of being city-centric. Shearmur (2007), with reference to the writings of Florida, accuses it of being elitist, which is much the same thing. If in effect the relationship between ‘creativity’, culture, the arts, and big cities is as strong as the evidence suggests then the relationship becomes essentially circular. Agglomeration economies, creativity, culture, and the arts are inextricably intertwined, and attempts to separate them make end little sense in the.
Where does this leave small cities? The previous paragraphs may overstate the advantages of big cities for the arts. Several studies have observed the presence of artistic colonies in small places, although rarely as dense as in large ones. Markusen and Schrock (2006) observe that artists sort themselves out among US cities in an irregular fashion not closely related to size once we move below the largest cites. Others, using broader creative class definitions, point to the pull of places favoured by climate and geogrpahy (Gabe et al 2007, McGranahan and Wojan 2007). For Canada, Petrov (2007) notes the attraction of British Columbia’s Rocky Mountain interior and Pacific Coast, but also of small places near major urban centres. Olfert and Partridge (2011) observe a similar pattern with strong concentrations near Toronto and Montreal. Case studies of small cities that have apparently succeeded in developing a cultural/artistic economic base also point to the importance of location. Huddersfield, England, studied by Wood and Taylor (2004), is close to Manchester; Wollongong, Australia, studied by Waite and Gibson (2009), is near Sydney and certainly helped by the proximity of surf beaches.
In sum, smaller places - given the right attributes - do attract artists less anchored to the city. Writers are an example, less tied to the scale-sensitive infrastructures mentioned earlier. The Internet and email should make this easer today. ‘Pleasant’ places near large metropolitan areas may attract artists whose daily 9 to 5 presence in the city is not required, but who nonetheless need to stay in touch. Artists may also settle in such places because of local demand. Vacation home owners (not the poorest segment of the population), young green-oriented households, tourists, and retirees are typically above-average consumers of cultural products: summer theatres; art galleries etc. The rise of quality-of-life considerations in general (Rappaport 2009) should, one would expect, fuel the growth of places with strong artistic communities. This a priori is good news for small places. But, what is the evidence that this will turn attract other economic activity?
THE LINK WITH ECONOMIC GROWTH
Although admittedly somewhat blunt, Phillips (2011: 251) nicely sums up the question: “What is special about arts entrepreneurship that makes it more desirable than a cheese factory?” The arguments in favour of a positive relationship between the arts and local economic development are powerful, but the empirical evidence is scanty at best. The case for the ‘special’ positive impact of artists on economic growth is convincingly presented in Markusen and King, (2003) and Markusen and Schrock (2006). The authors coin the term ‘artistic dividend’ to describe that impact. The most direct impact and easiest to measure is that of the arts as an export-base industry, where locally produced artistic products are sold outside the community or, alternatively, outsiders come to consume locally produced art. Think of an artist whose local gallery is a prime destination for tourists and who sells hundreds of paintings around world. Here, the impact is not all that different from a cheese factory.
However, the attribute that ‘makes the arts special’ is their assumed indirect impact on economic growth via their impact on ideas and in turn on innovation and productivity. Potts (2009) views cultural industries as part of the ‘innovation system’ of the broader economy. In the language of economics, the presence of arts-inclined individuals makes the whole local economy more productive, a true spill-over effect. We found no empirical study that isolated such a spill-over effect; but which does not mean that no effect exists. The link with industries such as advertising and the film industry is easy to make; indeed, making films is an artistic activity. For Montreal (Shearmur and Rantisi 2011) point to the links with the city’s fashion industry. A similar link might exist between Montreal’s arts community and its computer gaming sector. More to the point, it is difficult to see why the presence of artists would have a discernable effect on productivity in other sectors such as pharmaceuticals and aerospace in which Montreal also exhibits above average employment (Bourne et al 2011).
Empirical examinations of the link with growth have generally been for Florida’s (2002a) creative class or variations thereof. Most point in the direction of no relationship or, alternatively, of a weak relationship compared to other predictors (Donegan et al 2008, Boschma and Fritsch 2009, Glaeser 2005, Hoyman and Faricy 2009, McGranahan et al 2011). For US urban areas, Glaeser (2005), using Florida’s (2002a) definition, finds that the positive relationship with growth disappears once human capital variables are introduced. Hoyman and Faricy (2009) also conclude that human capital indicators are better predictors of growth. For Germany, Boschma and Fritsch (2009) find that educational levels are better predictors of patent activity.
The relationship with growth is problematic for another reason: the geographic mobility of the class of people assumed to be the instigators of growth, at the heart of the debate on the direction of causality. Do people follow jobs or the other way around? The creative class concept supports ‘the other way around’ hypothesis. Storper and Scott (2009), proponents of the opposing viewpoint, argue that the main motivation for migration today remains jobs, creative class arguments notwithstanding. Using Swedish data, Asheim and Hansen (2009) support Storper and Scott (2009), which also suggests that results may be influenced by national or regional context. For non-metropolitan US counties, McGranahan et al (2011) observe a positive statistical relationship between the proportion of creative class workers and business start-ups. However, they also found that this synergy (their word) was largely absent in counties with few natural amenities. What then is true ‘true’ causal variable: is it the quality of natural amenities or the proportion creative class workers? It may well be that amenity-rich places attract the most dynamic (or prescient) individuals within the creative class group; prescient, because amenity-rich places offer better business opportunities. In an earlier study, McGranahan and Wojan (2007) found that the creative class grew most rapidly in sunny and mountainous areas, suggesting that it more than others is drawn to high-amenity areas. Which then is the true causal variable fuelling growth: the community’s natural attributes; people’s tastes for these attributes; the characteristics of the people with those preferences?
Causal dynamics are not necessarily the same for small and for big places. New York and Los Angeles are not primarily competing on natural amenities; neither are Toronto and Montreal. McGranahan and Wojan (2007) find that the urban and rural members of the creative class (i.e. as measured by them) are different, the latter with significantly less college-educated, bringing us back to the interlocking relationship with human capital. Big cities have higher shares of college-educated individuals. But, this still leaves the direction of causality widen open. Are these ‘creative’, better educated, individuals the drivers of big-city growth or the result? The evidence is by no means conclusive, more often closer to Storper and Scott (2009) than to Florida (2002a)..
A case could even be made that a vibrant local arts scene and a prosperous, growing, local economy are opposites. The Beatles came out of Liverpool during its most difficult times. Detroit, during a period mired by riots and racial tension, gave rise to the Motown Sound. Caves (2000) reminds us that commerce and the arts are often antagonistic; the former is primarily about making money, the latter is about giving meaning. Artistic creativity exists in the poorest and most technologically backward societies. Yet, to conclude that artistic creation and economic growth are opposites is ultimately as simplistic as arguing the opposite. The true relationship will most probably continue to elude us. Perhaps there is none.
***
Summing up, this brief literature review suggests that we should expect to find a strong continuing relationship between concentrations in the arts and city size, but with a parallel growth of artistic concentrations in smaller places with specific attributes. However the literature paints no clear picture of the relationship with local employment growth. Such a relationship, if it exists, is not necessarily universal, and may well hold in one context but not another. That said, we now turn to our exploration of arts-related employment in Canadian cities.
DATA AND METHODOLOGY
The analysis proceeds in three stages. First, the spatial distribution over time of arts-related employment is examined. We then move to an examination of co-location patterns with two knowledge-intensive industry groups (defined below), followed by an analysis of the relationship between a strong arts presence and employment growth, both in knowledge-intensive industries and in overall employment.
The data used are drawn from six censuses of Canada (1971, 1981, 1991, 1996, 2001, 2006), based on special Statistics Canada tabulations. The complete data series covers all of Canada. To ensure comparability over time, the current study looks at urban areas only, defined as all urban places with a population of at least 10,000 in 20061. These are either Census Agglomerations or Census Metropolitan Areas as defined by Statistics Canada, distinct labour markets delineated by commuting patterns. Rural areas are excluded because boundary changes in 2001 make direct comparisons before-and-after impossible. However, these changes do not significantly effect values for urban areas2.. The urban dataset has 135 observations. The designations ‘urban area’, ‘urban place’, and ‘city’ are used interchangeably. The 135 urban places accounted for 81% of Canadian employment in 2006; the 34 largest (populations over 100,000) for 70%. For the three industry groups studied here - (see table 1) – the 135 urban places account for, respectively, for 89%, 95%, and 91% of employment in 2006, a sign that these are essentially urban sectors.
Industry classes are standardized over time. In 1997, Canada introduced NAICS (North American Industrial Classification System), changing from the previous SIC (Standard Industrial Classification). The initial pre-1996 dataset contained 141 SIC-coded industry classes. The new updated dataset has 126 industry classes, rearranged and-recoded to match NAICS3. In the overwhelming majority of cases, the harmonization of the two classification schemes was unproblematic. Cases by case verifications were carried out where necessary with the help of Statistics Canada sources. Minor discrepancies undoubtedly remain. We are confident, however, that the industry classes used here are consistent over time.
The basic datum is employment. The principal conceptual issue is the definition of Arts-related employment. Our focus, as discussed earlier is on individuals working in the performing and visuals arts and analogues industries, but also on those who appreciate and consume artistic creations, who might practice music on the side or be ardent opera buffs, although not employed in art-related industries. Four industry classes were chosen, listed on table 1, to represent Arts-related employment (or the Arts or the Arts Crowd, terms used interchangeably). The first three are self-expiatory. The fourth (NAICS 4512, 4532) attempts to capture the presence of consumers of artistic output; however, this class also including stationary and gift stores. To see whether this introduced a bias, possibly towards tourist destinations, spatial distributions in 2006 were compared with the other three. Location quotients for this class were positively correlated with the others, but not overly so (coefficient: 0.66), which we found reassuring as a very strong correlation would have meant that this class adds little new information. The places with the highest quotients revealed no systematic bias towards certain types of cities. Many were small, places that do not necessarily rank high in terms of the number of workers in the arts as such, but are home, we may reasonably assume, to a relatively higher (though small in absolute numbers) proportion of workers who consume its output. If anything, this class should improve the readings for small places, to be kept in mind when analyzing our results.
Table 1- Definition of Industry Groupings
NAICS Codes Industry Classes
Arts-Related (Arts)
512 7111 7115 4512, 4532
Motion picture and sound recording industries Performing arts companies
Independent artists, writers, and performers Book, periodical, music, stationery, and gift stores
Software, IT & Computer Services (SI Services)
5112 5114 5415
Software publishers
Information services and data processing services Computer systems design and related services
High Tech Manufacturing (HT Manufacturing)
3341 3364 3342-4 3254
3345-6, 3391
Computer and peripheral equipment manufacturing Aerospace product and parts manufacturing
Communications equipment manufacturing; audio and video equipment manufacturing; semiconductor and other electronic component manufacturing Pharmaceutical and medicine manufacturing
Navigational measuring medical and control instruments manufacturing; magnetic and optical media; medical equipment and supplies manufacturing
Moving on knowledge-rich industries, the identification of industry classes, a priori sensitive to the presence of a vibrant arts community, can lead in various directions. The range of possible industries is broad. Clothing manufacturing is a potential candidate since fashion includes a design component. However, the largest employment components in this industry class are low-paid workers doing generally repetitive tasks. At the other end of the spectrum, some industries are so close to the arts community as to make the relationship almost circular. Examples are radio and television broadcasting and advertising, industry classes often included in classification schemes of cultural /creative industries. We wish to select industries which, while part of the modern knowledge economy, are not in a quasi-umbilical relationship with the Arts class defined on table 1.
The two industry groupings chosen - one in the service sector and the other in manufacturing - are also given on table 1. The High Tech Manufacturing group includes industries with strong design and research components. More to the point, we would expect these industries to typically have significant shares of university-educated workers, consumers of artistic products. The Software, IT and Computer Services group is more directly linked to the arts, but without being
in the arts. This industry group is arguably the arch example of the modern symbiosis between
popping up with fresh labels, which is why nominally specific industry classes at the four digit level such (i.e. NAICS 5112 and 5114) refer in practice to very broad categories. It is in this constantly evolving group that the Internet (in its various shapes) hides out and where one would expect to find young wiz kids writing new software and dreaming up ever newer computer applications.
The methods used are straightforward: standard (Pearsons) correlations and (OLS) regression analysis, supplemented by maps. Correlation and regression analysis are sensitive to the presence of outliers, of some importance when considering the urban size variable. The use of straightforward population (or employment) figures will pull results towards the very largest urban centres, Toronto, Montreal, and Vancouver in the Canadian case, all with population over two million. We wish to capture the ‘distinct’ dynamics (if confirmed) of large metropolitan areas with respect to the arts. Two tests were performed for the year 2006. Correlations between relative employment concentrations in the arts and urban size were performed both with straightforward size numbers and with logarithmic transformations. Analyses were also performed with and without the three largest urban centres. The log results varied only slightly from those with straightforward size numbers, reducing the value of coefficients somewhat. However, the elimination of the three largest cities pushed results below the required significance level, both for the entire urban system (n=135) and for a subsets of larger cites (n=34). It was thus decided to use straightforward size figures and keep the largest urban centres, which again needs to be kept in mind when considering the results.
The basic metric used to describe spatial patterns and city industry specializations is the standard location quotient (LQ), where the reference point (the denominator) is the urban system (n=135) for any given year. The advantage of the location quotient is that values are expressed in relative terms compared both to other cities and to values for given years, which necessarily change over time. As such, the quotient allows us to standardize values over space and over time. Among its disadvantages is the high volatility of values for smaller places, a reflection not only of the inherent volatility of the economy of smaller places but also of the weight of larger urban places in the denominator, creating a ceiling above which location quotients will rarely go for the largest urban centres (Toronto, Montreal, Vancouver…). Although the location quotient is well-known, it is nonetheless worthwhile to recall the basic equation:
LQ = [ (Eij/ Ej) / (Ei/E) ]
Where LQ = Location Quotient for industry i in city j (for a given year)
Eij = Employment in industry i in city j
Ei = Employment in industry i for the entire system (135 urban places)
E = Total employment for the entire system (all industries)
RESULTS
Results at each stage are presented for the complete urban system (n=135) and for the thirty-four largest cities (n=34) in each time period, which as a general rule are urban areas with populations above 100,00.
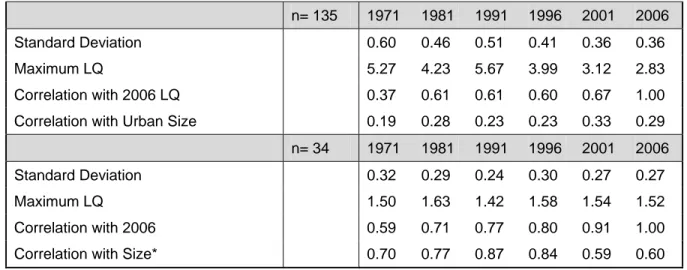
Table 2 - Location Quotient (LQ)-based Indicators of Spatial Distribution 1971- 2006. Arts-related Employment
n= 135 1971 1981 1991 1996 2001 2006
Standard Deviation 0.60 0.46 0.51 0.41 0.36 0.36
Maximum LQ 5.27 4.23 5.67 3.99 3.12 2.83
Correlation with 2006 LQ 0.37 0.61 0.61 0.60 0.67 1.00 Correlation with Urban Size 0.19 0.28 0.23 0.23 0.33 0.29
n= 34 1971 1981 1991 1996 2001 2006
Standard Deviation 0.32 0.29 0.24 0.30 0.27 0.27
Maximum LQ 1.50 1.63 1.42 1.58 1.54 1.52
Correlation with 2006 0.59 0.71 0.77 0.80 0.91 1.00 Correlation with Size* 0.70 0.77 0.87 0.84 0.59 0.60
All significant at 0.05
LOCATION OF ARTS-RELATED EMPLOYMENT 1971-2006
Table 2 shows results for various LO-based indicators of spatial distribution from 1971 to 2006. For the entire urban system (n=135), standard deviations have fallen over time (0.60 in 1971; 0.36 in 2006), a sign that Arts-related employment is dispersing. By the same token, the maximum location quotient, consistently attributed to the small city of Stratford, Ontario (to which we shall return), has been falling. Correlations over time (with LQ 2006) have remained largely stable since 1981, but are not all that high, generally in the order of 0.60, suggesting an urban system where places often change rank. The correlation with urban size is surprisingly weak, never rising above 0.33, and also remarkably stable. For this group at least, which it is useful to recall includes a majority of small cities (populations > 100,000), relative size does not seem a to be strong location factor.
The picture changes once we consider only the largest cities4. Now size matters more, with a correlation coefficient of 0.87 in 1991, its highest point. The effects of size (agglomeration economies) only become dominant, it would seem, above a certain threshold; this is not entirely surprising as one would expect size differences among small places to be swamped by other factors such as location and natural attributes. Recall also that the relationship ceases to be significant (in 2006) once the three largest urban centres are removed. For the 34 largest cities, table 2 suggest a generally stable urban hierarchy for Arts-related employment, notably since 1981. Standard deviations are lower, correlations across time higher, and the maximum LQ barley budges, generally in the order of 1.5. Given the growth in Arts-related employment (five-fold since 1981), this stability says a lot about the persistence of the factors driving the location of Arts-related employment among larger cities.
Figure 1 - Relationship between Arts-related Employment (Location Quotient) and Urban Size 2006. N= 34. 0.40 0.60 0.80 1.00 1.20 1.40 1.60 - 500,000 1,000,000 1,500,000 2,000,000 2,500,000 3,000,000 Size -Total Employement 2006
LQ A rts 2006 r square = 0.360 confidence level = 0.0002 Torronto Vancouver Halifax Victoria Regina Niagara-St.Catherines Trois-Rivières Windsor Hamilton Edmonton Montreal Saguenay London Ottawa
Figure 1 plots the relationship between urban size and Arts-related employment in 2006, showing an upward-sloping regression line, as expected. Canada’s three largest urban areas stand out, visible outliers, with LQs well above 1.0. However, deviations from the regression line are instructive in understating why size alone is not a sufficient predictor. Vancouver stands out with an LQ significantly above the predicted value. Glaeser (2011) in his synthesis of the economics of cities cites Vancouver as the arch-example of a ‘consumer city’ (where people want to live in
order to consume its attributes), noting that it regularly lands at the very top of global quality-of-life rankings. Glaeser (2011: 239) goes on to write: “Add in Vancouver’s abundant coastline, beautiful mountains, and lovely countryside, and nobody could deny that the city has been extravagantly blessed by nature”.
Montreal is slightly above the regression line, consistent with popular perceptions of a city with a lively arts scene. Olfert and Partridge (2011) refer to a ‘Quebec advantage’ with reference to the place of culture in Canada’s French-speaking province. Toronto’s position below the line is also intuitively unsurprising, Canada’s largest city and dominant business centre, but without any exceptional natural attributes. However, recalling that the location quotient is a measure of
relative concentration, this is also a sign that Toronto is home to a proportionally higher number
of workers in other sectors of the economy (i.e. finance and corporate support services) whose link with the arts, even as consumers, is possibly not all that strong. Perhaps most bankers and brokers, although high earners, are too busy to go the opera or take up piano on the side?
The differences between smaller cities (but still above 100,000) are more telling. Above the regression line, Halifax and Victoria are both ocean-front cities, the latter, like Vancouver, known for its mild climate and superb natural setting. Niagara-St. Catharines is a tourist destination. Regina in the centre of the cold Canadian Prairies is somewhat of a mystery, proof that every rule has its exceptions. However, like Halifax and Victoria, it is a provincial capital. There are two reasons why one might expect capital cities to have proportionally higher shares of Arts-related employment. Senior civil servants are generally university-educated, well-paid, and as such likely above average consumers of cultural products. Capital cities will generally have a higher proportion of institutions (museums, concert halls…) related to the arts.
At the other end of the spectrum, below the regression line, Windsor, London, Hamilton (all in southern Ontario), Trois-Rivières, and Saguenay are industrial cities with above-average shares of employment in blue-collar occupations (Bourne et al 2011). They are all home to large manufacturing plants, respectively, in the auto industry (first two cities), steel, pulp and paper, and aluminum smelting. That blue collar cities should be less oriented towards the arts is not surprising. On the other hand, the presence below the regression line of Edmonton and Ottawa, both capital cities with populations over one million in 2006, is counter-intuitive, another useful warning that generalizations must not be taken too far.
Table 3 - Twenty Urban Places with Highest Location Quotients for Arts-related Employment, 1981, 1991, 2006
1981 1991 2006
Stratford 4.23 Stratford 5.67 Stratford 2.83
Dolbeau 1.73 Toronto 1.42 Kentville 1.77
Toronto 1.63 Montréal 1.40 Elliot Lake 1.76
Tillsonburg 1.63 Vancouver 1.34 Vancouver 1.52 Port Hope 1.51 Courtenay 1.28 Halifax 1.36
Montréal 1.28 North Battleford 1.25 Whitehorse 1.35 Ottawa 1.18 Yorkton 1.22 Montréal 1.33 Courtenay 1.15 Cobourg 1.16 Toronto 1.27 Valleyfield 1.12 Joliette 0.98 Huntsville 1.25
Halifax 1.10 North Bay 0.95 Victoria 1.24
Vancouver 1.07 Charlottetown 0.93 Bracebridge 1.23 Whitehorse 1.07 Victoria 0.92 Regina 1.22 Fredericton 1.05 Duncan 0.92 Yellowknife 1.21 Drummondville 0.99 Edmonton 0.87 Nanaimo 1.10 Kentville 0.99 Sept-Îles 0.86 Owen Sound 1.10 Cranbrook 0.97 Rimouski 0.85 Camrose 1.06
Charlottetown 0.95 Cranbrook 0.85 Port Hope 1.03
St. John's 0.92 Halifax 0.85 Duncan 1.02 Joliette 0.89 Ottawa 0.84 Prince Rupert 1.00 Guelph 0.89 Calgary 0.84 Charlottetown 0.96
Bold = LQ above 1.00 for all three years; Italics= in top 20 for all three years
Table 3, which lists the twenty highest LQs for 1981, 1991, and 2006 for the entire urban system (n=135) illustrates the difference in the dynamics of big and small urban places. With one exception (Stratford), only Canada’s three large metropolitan areas register LQs above unity for all three years, and only two other cities, Halifax and Charlottetown (in italics), are consistently among the top twenty, but not necessarily above unity. Both are provincial capitals in maritime locations. For small cities, a consistently strong (above average) presence in the arts is the exception rather than the rule.
For small places, a strong presence in Arts-related employment is often, table 3 suggests, be the outcome of particular circumstances. Taking the five small cities with LQs of 1.25 or above in 2006, Huntsville is located in the Muskoka Lakes, cottage country, region north of Toronto. Whitehorse is a the territorial capital of the Yukon. Elliot Lake in Northern Ontario has
aggressively marketed itself as a destination for retirees with planned retirement communities. Kentville is a small community in Nova Scotia’s Annapolis Valley, known for its comparatively mild climate and bucolic surrounding, within easy reach of Halifax. Finally, the star of the show, Stratford Ontario (population 30,000), took off as an arts destination in the 1950s with the founding of the Stratford Shakespeare Festival, which was (and remains) highly popular, and has since become home to a small colony of actors and other occupations related to the performing arts. Its success in attracting a steady flow of theatregoers owes much to its location, 30km and 50km, respectively, from Kitchener-Waterloo and London (both with populations near a half-a-million) and 130km from Toronto.
Maps 1 and 2 (Appendix), which respectively illustrate the distribution of Arts-related employment in 1991 and in 2006, highlight the dual role of location and natural attributes. The maps cover all of Canada, including rural areas and smaller towns with populations below 10,000. Note that the non-urban spatial units are not necessarily the same for the two years, which is why, recall, only urban units are considered in the quantitative analysis. A comparison between the two maps confirms the dispersion of Arts-related employment between 1991 and 2006, the latter with noticeably more shaded areas (LQs above 1.0). Leaving aside odd outliers with small numbers (i.e. rural parts of the Abitibi and Saguenay regions of Quebec), most above-average non-metropolitan LQs share one of two characteristics (or both): 1) close to a large metropolitan area; 2) attractive natural attributes: lakes; mountains; shorelines. The growth of ‘artsy’ places around Toronto is clearly visible. The Laurentides, a traditional playground of Montrealers, also stand out. The economy of the small town of Ste-Adèle near Montreal, for example, is highly dependant on weekend tourism, vacation homes, and long-distance commuters. These places are essentially extensions of the respective metropolises, falling within their respective recreation and retirement sheds. Map 2 also highlights the rise of places blessed by nature, notably in the West. The high scores of places in the Canadian Rockies (Banff, Jasper) and the Pacific Coast require little further comment. Places near Vancouver and Victoria share the double advantage of access to a major urban area and a unique natural setting. The high scores of places in Nova Scotia suggest that Eastern maritime locations also benefit from the general attraction of shorelines, although less so than the Pacific Coast.
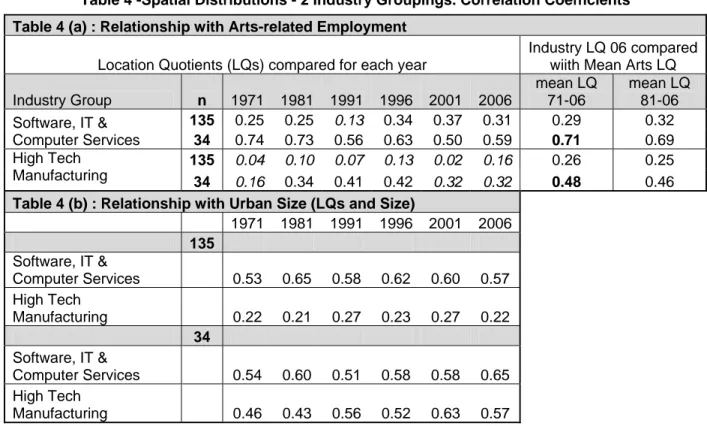
Table 4 -Spatial Distributions - 2 Industry Groupings. Correlation Coefficients Table 4 (a) : Relationship with Arts-related Employment
Location Quotients (LQs) compared for each year
Industry LQ 06 compared wiith Mean Arts LQ Industry Group n 1971 1981 1991 1996 2001 2006 mean LQ 71-06 mean LQ 81-06 Software, IT & Computer Services 135 0.25 0.25 0.13 0.34 0.37 0.31 0.29 0.32 34 0.74 0.73 0.56 0.63 0.50 0.59 0.71 0.69 High Tech Manufacturing 135 0.04 0.10 0.07 0.13 0.02 0.16 0.26 0.25 34 0.16 0.34 0.41 0.42 0.32 0.32 0.48 0.46
Table 4 (b) : Relationship with Urban Size (LQs and Size)
1971 1981 1991 1996 2001 2006 135 Software, IT & Computer Services 0.53 0.65 0.58 0.62 0.60 0.57 High Tech Manufacturing 0.22 0.21 0.27 0.23 0.27 0.22 34 Software, IT & Computer Services 0.54 0.60 0.51 0.58 0.58 0.65 High Tech Manufacturing 0.46 0.43 0.56 0.52 0.63 0.57
Italics = not significant ( < 0.05)
Co-location with Knowledge-rich Industries
Table 4 (a) shows the relationship over time between relative concentrations (LQs) in Arts-related employment and employment, respectively, in SI Services and in HT Manufacturing for both n=135 and n = 34.
For SI Services, correlations with Arts LQs are positive but weak for n=135, falling below the required confidence level in 1991. Correlations are considerably higher for larger cities (n= 34); the relationship is fairly stable since 1991, with coefficients varying between 0.50 and 0.63. For HT Manufacturing, the relationship is more tenuous with. Correlations are non-significant for n=135. The relationship is barely significant for the 34 largest cities, falling below the confidence level for three years.
To test whether consistent strength over time in the Arts might be a better predictor of a community’s capacity to attract knowledge-intensive industries, the same relationship was examined using the mean LQ for Arts-related employment over time (1971-2006 and 1981-2006), correlated with LQs for the two industry groupings for the year 2006. The relationship is now much stronger (notably for n=34). For larger cities (populations 100,000+), an argument could thus be made for a positive relationship between a well-established arts presence and employment in SI services and (but less so) HT manufacturing.
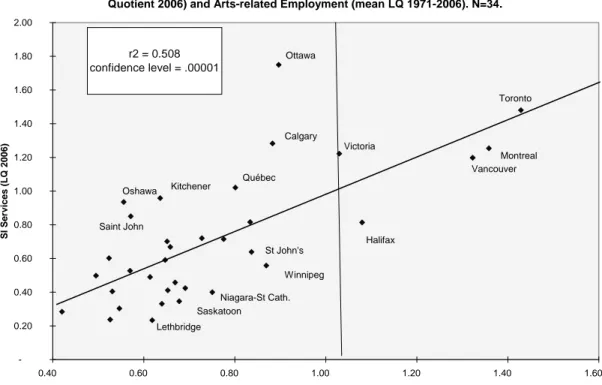
Figure 2 - Relationship between Employment in Software, IT & Computer Services (Location Quotient 2006) and Arts-related Employment (mean LQ 1971-2006). N=34.
-0.20 0.40 0.60 0.80 1.00 1.20 1.40 1.60 1.80 2.00 0.40 0.60 0.80 1.00 1.20 1.40 1.60 Arts-related Employment. Mean Location Qutient 1971-2006
S I Se rvices (LQ 2006) r2 = 0.508 confidence level = .00001 Ottawa Calgary Victoria Québec Kitchener Oshawa Saint John Toronto Halifax Lethbridge Vancouver Montreal Winnipeg Niagara-St Cath. St John's Saskatoon
Figure 3 - Relationship between Employment in High-Tech Industries (Location Quotient 2006) and in Arts-related Activities (mean LQ 1971-2006). N=34.
-0.50 1.00 1.50 2.00 2.50 0.40 0.60 0.80 1.00 1.20 1.40 1.60 Arts-related Employment. Mean Location Qutient 1971-2006
Hi gh Te c h E m pl oy m ent L Q 20 06 r2 = 0.226; confidence level = .0045 Kitchener Montrea Ottawa Oshawa Winnipe Brantford Toronto Vancouver Victoria Regin Saint John Hailifa
However, in both cases the three large city outliers weigh heavily on the results for n=34 (figures 2 and 3). Once removed, the correlation coefficient for SI Services falls to 0.5 and ceases to be significant for HT Industries. On Figure 2, the three largest metropolitan areas are now close to the regression line, with Toronto spot on, reinforcing the impression that the relationship is in large part pulled by the top three. For smaller urban areas (but still above 100,000), deviations from the regression line do not reveal a clear pattern, but suggest possible reasons why a strong SI Service sector might emerge independently of the Arts. Ottawa and Calgary stand out as fairly large cities with a strong SI Services sector, but comparatively weak in the Arts. One would expect the link with the Arts to be influenced by local economic structure and, correspondingly, by the type of SI Services consumed. The interface with fashion and broadcasting is fairly obvious, as noted earlier, but less so for computer services generated by public administration (Ottawa) or by oil exploration and extraction (Calgary).
All the cities below the regression line on figure 2 with the exception of Niagara- St. Catharines are located far from major markets. A city may well be a regional centre for the arts (St John’s, and Halifax, and Winnipeg5 are examples), but this is not necessarily matched by a strong SI Services sector. Above the regression line, Kitchener-Waterloo stands out as having developed a strong SI Services sector despite a low score on the Arts. Kitchener-Waterloo is also the principal outlier on figure 3 with a strong HT Manufacturing sector. Kitchener-Waterloo is the home of RIM (Research In Motion), inventor and producer of the Blackberry mobile phone. Looking at figure 3, it is difficult to argue that the Arts and High Tech manufacturing have a close relationship. Among the three largest metropolitan areas, Toronto is again right on the regression line, but both Vancouver and Montreal deviate significantly from it, the former towards the bottom and the latter towards the top. Vancouver’s undeniable attributes - attractive to the arts crowd - are apparently not sufficient to generate a strong High Tech manufacturing sector.
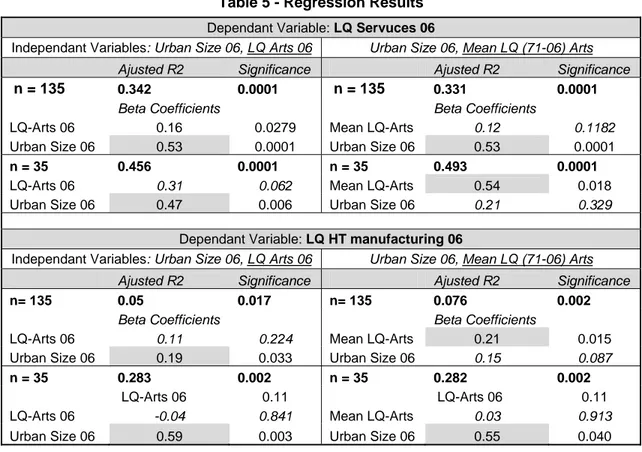
Table 5 - Regression Results
Dependant Variable: LQ Servuces 06
Independant Variables: Urban Size 06, LQ Arts 06 Urban Size 06, Mean LQ (71-06) Arts
Ajusted R2 Significance Ajusted R2 Significance
n = 135 0.342 0.0001 n = 135 0.331 0.0001
Beta Coefficients Beta Coefficients
LQ-Arts 06 0.16 0.0279 Mean LQ-Arts 0.12 0.1182
Urban Size 06 0.53 0.0001 Urban Size 06 0.53 0.0001
n = 35 0.456 0.0001 n = 35 0.493 0.0001
LQ-Arts 06 0.31 0.062 Mean LQ-Arts 0.54 0.018
Urban Size 06 0.47 0.006 Urban Size 06 0.21 0.329
Dependant Variable: LQ HT manufacturing 06
Independant Variables: Urban Size 06, LQ Arts 06 Urban Size 06, Mean LQ (71-06) Arts
Ajusted R2 Significance Ajusted R2 Significance
n= 135 0.05 0.017 n= 135 0.076 0.002
Beta Coefficients Beta Coefficients
LQ-Arts 06 0.11 0.224 Mean LQ-Arts 0.21 0.015 Urban Size 06 0.19 0.033 Urban Size 06 0.15 0.087
n = 35 0.283 0.002 n = 35 0.282 0.002
LQ-Arts 06 0.11 LQ-Arts 06 0.11 LQ-Arts 06 -0.04 0.841 Mean LQ-Arts 0.03 0.913
Urban Size 06 0.59 0.003 Urban Size 06 0.55 0.040
To further test for the role of the Arts compared to that of urban size in the (statistical) explanation of the location of knowledge-rich industries, four alternative regressions were run for each industry group (table 5). For each, the dependant variable is the LQ for the industry group in 2006. In each case, the second independent variable beside urban size alternates between the Arts LQ in 2006 (left-hand side) and the Mean 1971-2006 Arts LQ (right hand side on table 5). When the Arts LQ in 2006 is used, it is either swamped or eliminated by the urban size variable (the highest Beta coefficients are shaded). However, when the former is replaced by the Mean Arts LQ, it dislodges the urban size variable in two cases, notably for SI Services (n= 34), where the Beta coefficients are basically reversed. The two results are not necessarily contradictory, but serve to highlight the complex interdependency between urban size, the Arts, and employment in software, IT, and related computer services, raising issues of endogeneity and circularity.
Turning to the evolution over time, the relationship with urban size has remained remarkably stable over time for both industry groups (table 4 b). HT Manufacturing exhibits a significantly weaker relationship with size, as expected, notably for n=135. The similarly with the coefficients over time for Arts-related employment (recall table 1), both low, might lead the reader to conclude that the two locate in the same (generally small) places. However, table 4 (a) revealed no significant relationship between the two spatial distributions. To understand the apparent contradiction between the two, we turn to maps 3 and 4 (Appendix). Map 3 confirms the big city
orientation for SI Services. High LQs are rare outside major metropolitan areas. The few exceptions are special cases6. HT Industries are present in smaller places, but with a tendency to form clusters in and around major metropolitan areas (map 4). Such patterns of constrained dispersion, typical of manufacturing in general (Henderson 1997, Desmet and Fafchamps 2005, Polèse and Shearmur 2006) are the corollary of the concentration of SI Services in large metropolitan areas. HT manufacturing firms cluster around (but not necessarily in) large metropolitan areas in part because they are major consumers of SI services.
A comparison of maps 2 and 4 reveals significant differences in the geography of employment for HT Manufacturing and Arts-related activities outside metropolitan areas. Both often locate in non-metropolitan places, but not necessarily the same places. For Canada’s High Tech Manufacturing, the Montreal-Ottawa and Toronto-Kitchener clusters dominate the landscape. No equivalent clusters exist in the West, not even around Vancouver; recall that smaller places in the West (often coastal or mountain) are attractive to the arts crowd. In other words, the geography of small places attractive to the arts crowd is not necessarily the same as the geography of small places with concentrations of high tech manufacturing firms. Both seek out small places, but for different reasons. Indeed, an argument could be made that the two are opposites. One would expect natural amenities to be capitalized in real estate values and correspondingly higher wages. Manufacturing plants seek out smaller places because they offer lower land and labour costs (Henderson 1997); these are usually plants at the lower end of the technology scale, assembly rather than R & D, which is why they are attracted to non-metropolitan locations in the first place.
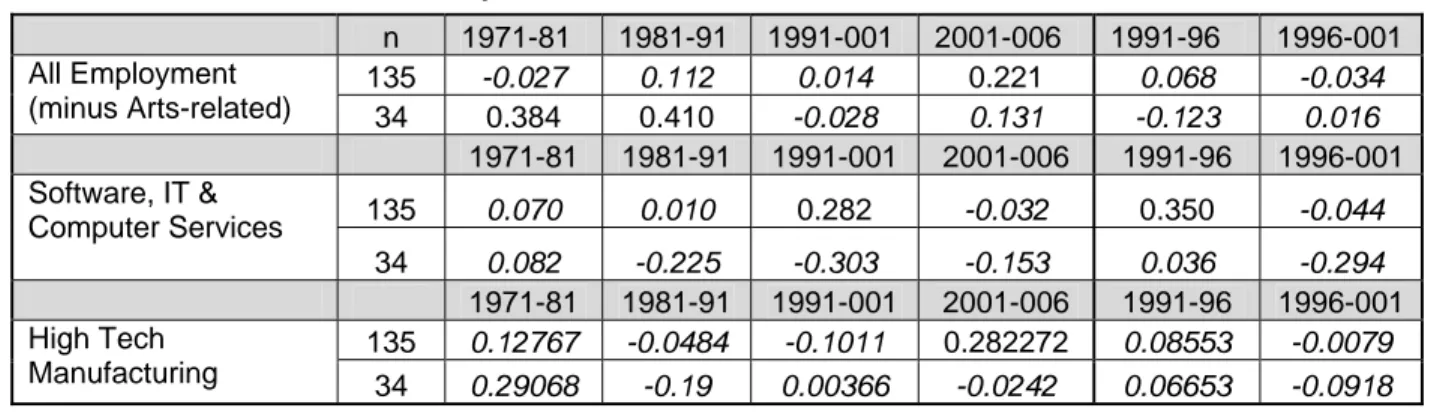
Table 6 - LQ in Arts-related Employment in t1 and % Employment Growth in Subsequent Time Period. Correlation Coefficients
n 1971-81 1981-91 1991-001 2001-006 1991-96 1996-001 All Employment (minus Arts-related) 135 -0.027 0.112 0.014 0.221 0.068 -0.034 34 0.384 0.410 -0.028 0.131 -0.123 0.016 1971-81 1981-91 1991-001 2001-006 1991-96 1996-001 Software, IT & Computer Services 135 0.070 0.010 0.282 -0.032 0.350 -0.044 34 0.082 -0.225 -0.303 -0.153 0.036 -0.294 1971-81 1981-91 1991-001 2001-006 1991-96 1996-001 High Tech Manufacturing 135 0.12767 -0.0484 -0.1011 0.282272 0.08553 -0.0079 34 0.29068 -0.19 0.00366 -0.0242 0.06653 -0.0918
Impact on Growth
Table 6 shows correlations between Arts-related employment in time t1 (base year) and employment growth in subsequent years for various time periods. Arts-related employment is subtracted from the ‘All Employment’ variable to eliminate endogeneity problems. The results do not require much commentary. For the vast majority of cases, the relationship is not significant. Other correlations were also performed for alternative combinations and permutations of time periods. The results are always the same. The relationship with employment growth is weak at best. If there is one for all employment (n=34), it is in the past, 1971-1991, during the first stages of the IT revolution. The relationship with the two knowledge-intensive industry groupings is even more tenuous.
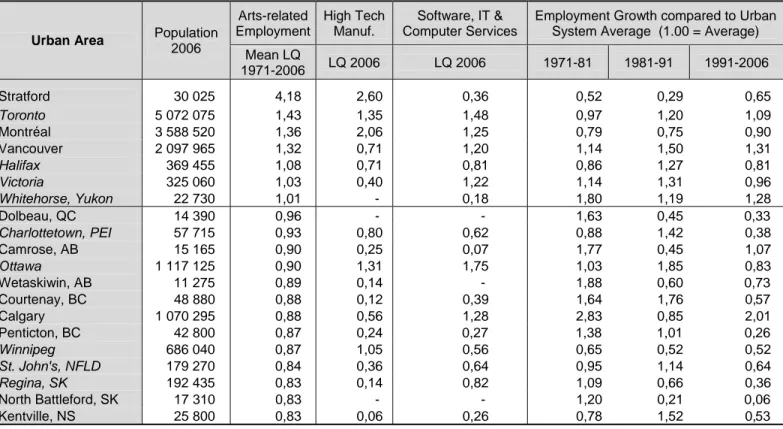
Table 7 - Twenty Urban Areas with highest mean Location Quotients (1971-2006) Arts-related Employment
Urban Area Population
2006 Arts-related Employment High Tech Manuf. Software, IT & Computer Services
Employment Growth compared to Urban System Average (1.00 = Average) Mean LQ 1971-2006 LQ 2006 LQ 2006 1971-81 1981-91 1991-2006 Stratford 30 025 4,18 2,60 0,36 0,52 0,29 0,65 Toronto 5 072 075 1,43 1,35 1,48 0,97 1,20 1,09 Montréal 3 588 520 1,36 2,06 1,25 0,79 0,75 0,90 Vancouver 2 097 965 1,32 0,71 1,20 1,14 1,50 1,31 Halifax 369 455 1,08 0,71 0,81 0,86 1,27 0,81 Victoria 325 060 1,03 0,40 1,22 1,14 1,31 0,96 Whitehorse, Yukon 22 730 1,01 - 0,18 1,80 1,19 1,28 Dolbeau, QC 14 390 0,96 - - 1,63 0,45 0,33 Charlottetown, PEI 57 715 0,93 0,80 0,62 0,88 1,42 0,38 Camrose, AB 15 165 0,90 0,25 0,07 1,77 0,45 1,07 Ottawa 1 117 125 0,90 1,31 1,75 1,03 1,85 0,83 Wetaskiwin, AB 11 275 0,89 0,14 - 1,88 0,60 0,73 Courtenay, BC 48 880 0,88 0,12 0,39 1,64 1,76 0,57 Calgary 1 070 295 0,88 0,56 1,28 2,83 0,85 2,01 Penticton, BC 42 800 0,87 0,24 0,27 1,38 1,01 0,26 Winnipeg 686 040 0,87 1,05 0,56 0,65 0,52 0,52 St. John's, NFLD 179 270 0,84 0,36 0,64 0,95 1,14 0,64 Regina, SK 192 435 0,83 0,14 0,82 1,09 0,66 0,36 North Battleford, SK 17 310 0,83 - - 1,20 0,21 0,06 Kentville, NS 25 800 0,83 0,06 0,26 0,78 1,52 0,53
Italics = Capital City
The lack of success of small arts-friendly communities in generating employment in knowledge-rich sectors is further brought home by table 7, which lists the twenty urban places, both big and small, with the highest consistent LQs in Arts-related employment. High LQs on all three (Arts, SI Services, HT Manufacturing) are the exclusive preserve of the two largest metropolitan areas, Toronto and Montreal. Vancouver falls below unity for HT Manufacturing. No small ‘arts-friendly’ city exhibits LQs above unity for both SI Services and HT Manufacturing. Most small
places exhibit frankly dismal readings on both industry groupings. Thus, LQs range between a low of 0.06 and a high of 0.39 for Kentville, Courtenay, and Penticton, all very pleasant places in picturesque surroundings. In others, Dolbeau-Mistassini and North Battlelford, LQs fall completely to zero, the latter home to a regional museum. These are admittedly fairly remote places, but no less warning signals that investments in the arts should not be counted upon to overcome the disadvantages of small size and distance.
Besides Toronto and Montreal, the only other urban area with LQs above unity for both knowledge-rich industry groups is Ottawa, favoured both by size and location. Calgary has size but not location. Charlottetown, Prince Edward Island (PEI), comes closest to fitting the bill of a small arts-friendly place in a comparatively remote location that does reasonably well on both knowledge-rich industry groups. Charlottetown is a pleasant coastal city, provincial capital, and home to the local university, a nice combination. However, PEI’s apparent success in attracting high tech manufacturing (aerospace and airplane assembly, specifically) owes much to a legacy of comparatively low wages, a distinguishing trait of the Island’s agriculture and fishing-based economy (Polèse and Shearmur 2002), a rare combination of pleasant surroundings and low costs.
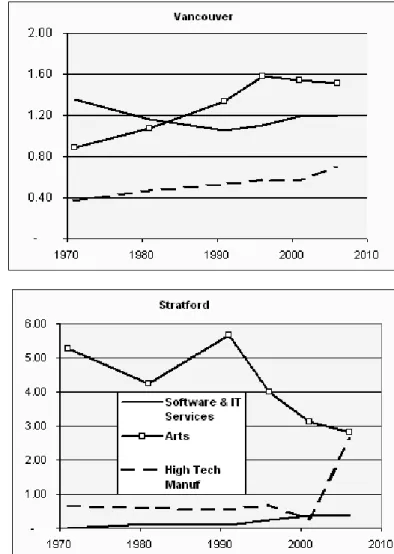
Figure 4 - Evolution 1971- 2006 of Employment (Location Quotients) for three Industry Groupings. Four Cities
We end with figure 4, which illustrates the comparative evolution of the three industry groups for four cities, two big and two small. Montreal exhibits consistently high scores for Arts-related employment with little variation over time, an example, on might say, of an artistically ‘creative’ city. Montreal’s scores on the other two industry groups are also fairly stable, but with a steady improvement since the 1980s, notably for SI Services. It could thus be argued (only ‘argued’ for our results do not constitute proof) that Montreal’s success for this industry group – which includes computer gaming and computer graphics – does owe something to the parallel presence of a strong arts community. Overall growth of the Montreal economy has, however, remained below average, which again suggests that any growth effects, if they exist, are confined to specific industries. The picture for Vancouver is almost the polar opposite, a rising star with a growing Arts-related employment component and a rapidly growing economy. However, this is not matched by a rising SI Service Sector (in relative terms). The HT Manufacturing sector is steadily moving up, but still well below Montreal’s scores. Here are two cities with visibly strong arts communities, but different trend lines.
For smaller cities, figure 4 leaves little doubt that Charlottetown is a success story: a consistently strong arts component plus impressive growth in both knowledge-rich components (for SI Services, note the effects of the end of the dot.com boom). Again, figure 4 is not sufficient to establish a causal link with the arts, but neither can a link be rejected. A more likely explanation, following from earlier comments, is a fortuitous combination of factors of which a vibrant arts scene may be one. As a contrast, it is difficult to see a link between Stratford’s success as a small (performing) arts centre and the growth of knowledge-rich industries. Its score on SI Services remains dismally low. The sudden upsurge in HT Manufacturing after 2001 is most likely a reflection of. Stratford’s location, a mere 30km from Kitchener-Waterloo. However a case study would be required to verify this.
CONCLUSION
Using data for 135 Canadian urban areas over thirty-five years (1971-2006), the paper successively examined: a) the location of Arts-related employment; b) the relationship between Arts-related employment and employment in two knowledge-rich industry groups (software, IT, & computer services; high tech manufacturing); c) the relationship between Arts-related employment and local employment growth.
On location, the findings largely mirror those of other studies on the spatial distribution of ‘creative’ employment in general. Arts-related employment in Canada is highly concentrated in the three largest urban areas: Toronto, Montreal, and Vancouver. Nothing indicates that is changing. Only the three largest (with one exception) exhibit consistently high concentrations
over time. Concentrations in smaller places are more volatile, a sign that the arts community is geographically mobile, but also that only smaller places with special attributes are able to consistently attract arts-related employment.
Smaller places with relatively high concentrations shared one or both of the following attributes: a) attractive natural setting: seashore, lakes, mountains; b) proximity to a large metropolitan area. Both types of communities are expanding, a reflection most probably of the growth in retired populations, preferences for greenery, and the rise of Internet-facilitated long-distance commuting. Being a provincial capital also helped in Canada.
The relationship between concentrations in the arts and the two knowledge-rich industry groups was found to be weak with no indication that this is changing over time. For smaller cities with the right attributes, arts-related activities can provide an economic base (like any export industry), but we find little evidence that they act as magnets for other knowledge-intensive industries. Arts-related employment is spreading to smaller ‘pleasant’ places, but employment in knowledge-intensive industries is not necessarily following.
The co-location relationship with knowledge-rich industries was found to be strongest for larger urban areas (population 100,000 +). However, the relationship is considerably weakened once Canada’s three largest metropolises are removed. If a synergy does exist between the arts and specific knowledge-rich industries, this suggests that it only operates in the context of large cities. Other factors are visibly also at work linked to attributes of urban size.
No consistently significant relationship was found between concentrations of arts-related employment and subsequent employment growth. This holds true for all periods, urban size classes, and industry groups. The few cases where the relationship was positive, it was weak and fleeting. The diverging trajectories of Canada’s three large metropolises, all with strong arts communities, highlight the ambiguous nature of the relationship with growth. Only the two largest, Toronto and Montreal, exhibit above average employment in both knowledge-rich industry groups, but with differing all-over employment growth,
Summing up, the results do not allow us to conclude that the presence of individuals working in the arts (or interested in the arts) is not a positive factor for the development of specific industries. However, they do suggest that where such a relation exists it is part of the broader fabric of agglomeration economies of large cities, and not an independent determinant of employment growth. There is little evidence that the presence of arts-related activities can independently jump start the economy of small places (and even large ones) in the absence of other factors. Being a magnet for artists is undoubtedly a positive attribute, but will rarely be a sufficient condition for ensuring sustained employment growth.
References
ASHEIM, B., HANSEN, H.K. 2009. Knowledge bases, talents and contexts: on the usefulness of the creative class approach in Sweden. Economic Geography, 85: 425–442.
BOSCHMA, R. A., FRITSCH, M. 2009. Creative class and regional growth: empirical evidence from seven European countries. Economic Geography, 85: 391–423.
BOURNE, L., BRUNELLE, C., POLÈSE, M., and SIMMONS, J. 2011. “Growth in the Canadian Urban System” in BOURNE, L. et al. (editors) Canadian urban Regions: Trajectories of Growth and Change, Oxford University Press.
CAVES, R. E. 2000. Creative Industries: Contracts between Art and Commerce. Cambridge and London. COISH, D. 2004. Census Metropolitan Areas as Culture Clusters. Trends and Conditions in Census
Metropolitan areas. Analytical Paper. Statistics Canada. Culture, Tourism and the Centre for Education Statistics. Ottawa.
COOKE, P. and LAZZERETTI L. 2008. Creative Cities, Cultural Clusters and Local Economic
Development. Cheltenham, UK: Edward Elgar.
DONEGAN, M., DRUCKER, J., GOLDSTEIN, H., LOWE, N., MALIZIA, E. 2008. Which indicators explain metropolitan economic performance best? Traditional or creative class. Journal of the American
Planning Association, 74: 180–195.
DESMET, K. and M. FAFCHAMPS. 2005. Changes in the spatial concentration of employment across US counties: a sectoral analysis: 1972-2000. Journal of Economic Geography, 5: 261-284.
FLORIDA, R. 2002a. The Rise of the Creative Class. And How it’s Transforming Work, Leisure, and
Everyday Life. New York. Basic Books.
FLORIDA, R. 2002b. Bohemia and economic geography. Journal of Economic Geography 2 (1): 55-71. GABE, T.M, COLBY, K, and BELL, K. 2007. Creative Occupations, County-Level Earnings and the US
Rural-Urban Wage Gap. Canadian Journal of Regional Science. 30 (3): 391-410.
GLAESER, E. L. 2005. Review of Florida‟s the rise of the creative class. Regional Science and Urban
Economics 35(5):593–596.
GLAESER, E. 2011. Triumph of the City, The Penguin Press, New York.
HALL, P. 2000. Creative Cities and Economic Development. Urban Studies, Vol. 37, No. 4, pp. 639-649. HENDERSON, J. V. 1997. Medium sized cities. Regional Science and Urban Economics. 27: 583-612. HOSPERS, G.-J. 2003. Creative cities: Breeding places in the knowledge economy. Knowledge,
Technology, and Policy 16(3), 143–162.
HOWKINS, J. (2001), The Creative Economy: How People Make Money from Ideas. London: Penguin. HOYMAN, M., FARICY, C. 2009. It takes a village: a test of the creative class, social capital and human
capital theories. Urban Affairs Review, 44: 311–333.
LANDRY, C. 2000. The Creative City. London: Earthscan Publications.
LEWIS, N. M. and DONALD, B. 2010. A New Rubric for „Creative City‟ Potential in Canada‟s Smaller Cities. Urban Studies. 47 (1): 29-54.
MARKUSEN, A. and KING, D. 2003. The Artistic Dividend: The Arts’ Hidden Contributions to Regional
Development. Humphrey Institute of Public Affairs. University of Minnesota.
MARKUSEN, A. and SCHROCK, G. 2006. The Artistic Dividend: Urban Artistic Specialization and Economic Development Implications. Urban Studies, 43 (10): 1661-1686.
MCGRANAHAN, D and WOJAN, T. 2007. Recasting the Creative Class to Examine Growth Processes in Rural and Urban Counties Regional Studies 41 (2): 197-216.
MCGRANAHAN, D., WOJAN, T. and LAMBERT, D. 2011. The rural growth Trifecta: Outdoor amenities, the creative class and entrepreneurial context. Journal of Economic Geography 11: 529-557.
MILES, S. and PADDISON, R. 2005. Introduction: The Rise and Rise of Culture-led Urban Regeneration.
Urban Studies, Vol. 42, No 5/6, pp. 833–839.
NATHAN, M. 2007. The Wrong Stuff? Creative Class Theory and Economic Performance in UK Cities.
Canadian Journal of Regional Science. 30 (3): 433-450.
OLFERT, M.R. and PARTRIDGE M. 2011. Creating the Cultural Community: Ethnic Diversity vs. Agglomeration. Spatial Economic Analysis. 6 (1): 25-55.
PETROV, A. 2007. A look beyond Metropolis: Exploring Creative Class in the Canadian Periphery.
Canadian Journal of Regional Science. 30 (3): 451-474.
POLÈSE, M. 2009. The Wealth and Poverty of regions. Why cities matter. The University of Chicago Press: Chicago.
POLÈSE, M. and SHEARMUR, R. 2006. Growth and Location of Economic Activity: The Spatial Dynamics of Industries in Canada 1971-2001. Growth and Change, 37 (3): 362-395.
POLÈSE, M. and SHEARMUR, R. 2002. The Periphery in the Knowledge-Based Economy: The Spatial
Dynamics of the Canadian Economy and the Future of Non-Metropolitan Regions in Quebec and the Atlantic Provinces, INRS, Montreal. www.ucs.inrs.ca
PHILLIPS, R. J. 2011. Arts Entrepreneurship and Economic Development: Can Every City be „Austintatious‟. Foundations and Trends in Entrepreneurship 6 (4): 239-313.
POTTS, J. 2009. Why creative industries matter to economic evolution. Economics of Innovation & New
Technology 18(7): 663–673.
RAPPAPORT, J. 2009. The increasing importance of quality of life. Journal of Economic Geography 9: 779-804.
SCOTT, A. 2008. The cultural economy: Geography and the creative field. Economy: Critical Essays in
Human Geography p. 339.
SHEARMUR, R. 2007. The New Knowledge Aristocracy: A few thoughts on the creative class, mobility, and urban growth. Work, Organization, and Labour, 1 (1): 31- 47.
SHEARMUR R. and RANTISI N. 2011 “Montreal: Rising Again from the Same Ashes” in BOURNE, L. et
al. Canadian urban Regions: Trajectories of Growth and Change, Oxford University Press.
SMITH, R. and K. Warfield. 2008. The creative city: A matter of values. in COOKE and LAZZERETI op cit. STABER, U. 2008. Boook review of Cooke and Lazzereti, 2008, op cit. in Growth and Change, 39 (4) :
667-670.
STATISTICS CANADA. 2004. Canadian Framework for Culture Statistics. Culture Statistics Program. Culture, Tourism and the Center for Education Statistics Research papers. Statistics Canada, Ottwa. STORPER, M., and SCOTT, A. J. 2009. Rethinking human capital, creativity and urban growth. Journal of
Economic Geography, 9: 147–167.
THROSBY, D. 2008. Modelling cultural industries. International Journal of Cultural Policy 14(3), 217–232. WAIT, G. and Gibson, C. 2009. Creative Small Cities: Rethinking the Creative Economy in Place. Urban
Studies. Vol 46, No 5&6, pp. 1223-1246.
WOOD, P. and TAYLOR, C. 2004. Big ideas for a small town: The Huddersfield creative town initiative,
Endnotes
1
There are two exceptions to this rule: Kitimat, BC, and Kapuskasing in Northern Ontario with populations, respectively, of 8,950 and 8,350 in 2006. Both are in the historical dataset; both had populations above 10,000, but have been declining over the last three censuses.
2
Results for urban areas were compared for pre and post 2001 geographies, showing only minor variations, which did not affect correlation or regression outcomes.
3
This was largely carried out by my colleague Richard Shearmur at INRS, to whom I owe a debt of thanks.
4
Not that n is invariant for the first three rows on the bottom half of table 2 (the same 34 cities: the largest in 2006), while elsewhere n=34 refers the largest cities in each given year.
5
The author has visited St John’s, Newfoundland, on several occasions and can attest to its lively arts scene, especially for music. Winnipeg has emerged as a cultural centre for Canada’s Aboriginal peoples (First Nations), home to APTN, the Aboriginal Peoples Television Network.
6
For example, the high LQ for SI Services in Cape Breton may be explained by the presence of the Canadian Coast Guard Academy, a major presence for such a small community.