O
pen
A
rchive
T
oulouse
A
rchive
O
uverte (
OATAO
)
OATAO is an open access repository that collects the work of Toulouse researchers and
makes it freely available over the web where possible.
This is an author deposited version published in: http://oatao.univ-toulouse.fr/
Eprints ID: 3260
To link to this article: DOI: 10.1109/CCNC.2010.5421758
URL: http://dx.doi.org/10.1109/CCNC.2010.5421758
To cite this document:
LOCHIN, Emmanuel. STAMP: SMTP server topological analysis
by message headers parsing. In : Consumer Communications and Networking Conference
(CCNC), 2010 : 7th IEEE Consumer Communications and Networking, Las Vegas, 9-12
January 2010. New-York : IEEE, 2010, 2 p. ISBN 978-1-4244-5175-3
Any correspondence concerning this service should be sent to the repository administrator:
STAMP: SMTP server Topological Analysis by
Message headers Parsing
Emmanuel Lochin
1,21 CNRS ; LAAS ; 7 avenue du colonel Roche, F-31077 Toulouse, France 2 Universit´e de Toulouse ; UPS, INSA, INP, ISAE ; LAAS ; F-31077 Toulouse, France
Abstract—This paper presents STAMP: a tool to analyse SMTP servers overlay topology. STAMP builds a weighted and oriented graph from an email database, an email log or just a simple email header allowing a post-analysis of the SMTP overlay structure and the identification of the paths used by an email. The objective of this tool is twofold. STAMP allows to automatically perform an analysis of the SMTP topology for debugging (e.g, message delay, emails loop, ...) and for metrology purposes. While several traceroute-like measurements projects try to map the Internet, to the best of our knowledge, no tool allows to drive an analysis of the SMTP overlay network. Thus, the goal of the resulting graph is to develop methods (from graph theory, statistical analysis, ...) to identify relaying problems. We aim to explore the impact of IP network problems over emails delivery (and respectively: emails’ traffic over IP networks) in conjunction with IP measurements driven synchronously. In the present paper, we introduce the design and the measurement methodology of the STAMP software and as second contribution, bring out to the networking community the tool and some measurements databases.
I. INTRODUCTION
Email messages delivered using SMTP usually contain headers which describe the travel path of a message between senders and recipients [3]. However, most email users are not concerned by the transmission of data. Indeed, most of email client programs tend to hide these records. The information, gathered during the transit of emails between the source and destination, include the time they were received and transmitted by any intermediate mail transfer agents (MTA). Despite of the relative lack of interest of these information for the end-user, their analysis can reveal problems (such as servers path that cause message delay) that can be used to bench the performances of an email provider. Furthermore, it brings to ITs, where complex mail relay topology is enabled, to verify the correct forwarding rules of their email traffic. This analysis might also be useful for the identification of network problems and to detect anomalies that may indicate email server problems. For instance: a lack of email received, not even junk emails, during a certain period; a wrong con-figuration of a greylisting server; a loop or a down overlay link.
All these facts have motivated the use of STAMP. STAMP drives a passive analysis of email headers and draws a weighted and oriented graph from an email database, an email log or just a simple email header. STAMP allows to collect emails, within a database, at a frequency and a duration
set by the user and then treats the data collected. STAMP is developed in Python 1 and can be easily modified and
enhanced. As a primary extension, STAMP interfaces the Google location API [2] that enables a geolocalisation of the identified STMP servers over Google Map.
Despite the undeniable interest of this tool for network administrators, its development has been preliminary moti-vated to investigate STMP overlay network dynamic. As a result in the following, we focus on the utilisation of this tool for metrology purpose and present the way an email database is constructed and analysed. Section II presents the measurements method used to collect the information analysed and motivates the reason of this choice. We then explain how the graph is drawn and introduce a second functionality allowing to prune non pertinent data from this representation (section III). Finally, we present the expected future work (section IV).
II. MEASUREMENTS METHOD AND DATA COLLECTION
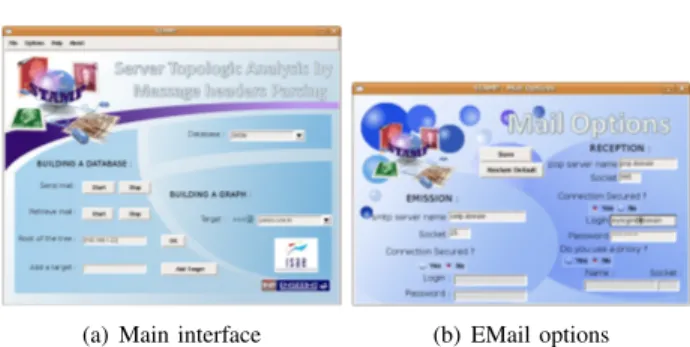
(a) Main interface (b) EMail options
Fig. 1. The STAMP interface
Several tools attempt to draw an Internet map for the sake of a better understanding of the Internet topology dynamic. However, research work also show that measurements obtained might contain several bias [5] mainly due to the way data are collected (in particular when distributed measurements are enabled). In a recent work, the authors in [4] propose to avoid these issues by using a different approach: they focus on what a given host sees the topology around itself (similar to a traceroute measurement). This kind of measure, called ego-centered view, allows to perform periodic rounds of mea-surements in order to obtain information on the changing of the
2
topology. STAMP follows this measurement scheme. Indeed, this method, done with a predefined root servers, allows to collect information over a long period and to facilitate the statistical analysis and the comparison of the results obtained. The measurements setting are done through a simple inter-face (see Figure 1) that allows to configure both sender account and recipient (Figure 1.b); to start and stop email sending and to collect the data (Figure 1.a). First, the user must define the root of the graph tree (in general, the name of the user STMP server). Then, after the end of data collection, STAMP draws a graph starting from the first STMP server set as the root of the tree. The following section presents the graphs obtained.
III. RESULTING GRAPH
We built a dataset of emails’ headers by sending emails from a french Internet Service Provider (ISP) messages to several recipients hosted in Yahoo France, Brazil, Mexico, Canada, Chile, Argentina, Colombia and in Google Mail, Hotmail, ... Each database represents a collection of hundred (or more) emails sent. All data are anonymized and once a time a database is built, the results remains accessible through the STAMP interface until deletion by the user. This allows to draw simultaneous topologies for comparison purpose.
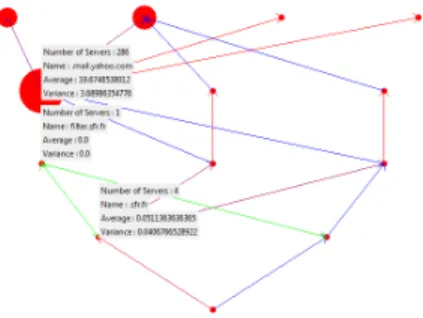
Figure 2 presents the resulting graph obtained with Yahoo Brazil database.
Fig. 2. Topology obtained with yahoo.com.br
Each row of Figure 2 represents a transfer level. We balanced the arches (depending on the number of emails) with the following colors code:
• In red: for emails which rarely travel through this server;
• In blue: emails that always transit through this server;
• In purple: emails that often transit through it;
• In green : emails that loops between two servers. This color identifies either a wrong configuration or a server that acts like a spam filter (this is typically the case in Figure 2).
We can note that in this experiment, the top of the graph is quite complex and difficult to interpret. To ease the analysis, STAMP can group servers following predefined criterion by selecting servers to group and prune from the servers lists. The rank of a server is defined by its position in the email header. Then, we establish the position in a row of a given server as a function of its predecessors and followers. As some servers can transfer messages to lower rows servers, grouped
servers might not be necessarily deleted. Therefore, a recursive procedure checks the list after this first processing. First, we suppress all the servers that do not receive any message, and then, we lower servers if possible. That means we put the servers in the row just after the earliest predecessor. Finally, we suppress empty rows.
This filtering process is done over the servers in the same group and obey to the following criterion:
• They must have a common domain name;
• They must be in the same order of magnitude of fre-quency usage;
• They must have the same number of followers.
Fig. 3. Grouped topology obtained with yahoo.com.br
Figure 3 illustrates the results obtained. The STAMP in-terface also enables statistics on demand of the approached mean and variance of the time needed to reach a server assuming that clocks are synchronized (we noticed during our experiments that most of commercial emails provider were NTP synchronized). Eventually, we have to notice that STAMP is developed in a object oriented way which allows to add others analysis methods.
IV. CONCLUSION
This paper has presented STAMP. A powerful tool able to build a graph of an SMTP overlay topology for debugging or metrology purpose. Following this development, we are currently analysing several dataset that would lead to a better understanding of this particular overlay network. We hope to generate an interest from the networking community to use this tool in order to investigate Internet measurements issues.
V. ACKNOWLEDGEMENTS
The author would like to thank Florian Cazes, Yves de la Broise and Jean-Charles Tropato for the development of the STAMP software during their internship at ISAE.
REFERENCES
[1] Michael Still and Eric McCreath, “Inferring Relative Popularity of SMTP Servers”, In Proc. of the USENIX LISA, 2007
[2] http://code.google.com/p/gears/wiki/LocationAPI
[3] David H. Crocker, “Standard for the format of ARPA Internet text messages”, IETF Request For Comments, RFC 822, August 1982 [4] Matthieu Latapy, Cl´emence Magnien and Fr´ed´eric Ou´edraogo, “A Radar
for the Internet”, In Proc. of Int. Workshop on Analysis of Dynamic Networks, in conjonction with IEEE ICDM, 2008
[5] A. Lakhina, J. Byers, M. Crovella, and P. Xie, “Sampling biases in IP topology measurements” In Proc. IEEE INFOCOM, 2003