1 Olivier OLLAGNON
Matricule : 20847
Programme Grande Ecole - Majeure Finance
MASTER THESIS
Emotional assets as an alternative financial investment: An efficient
portfolio diversification solution during financial crises ?
June 2012
Abstract:
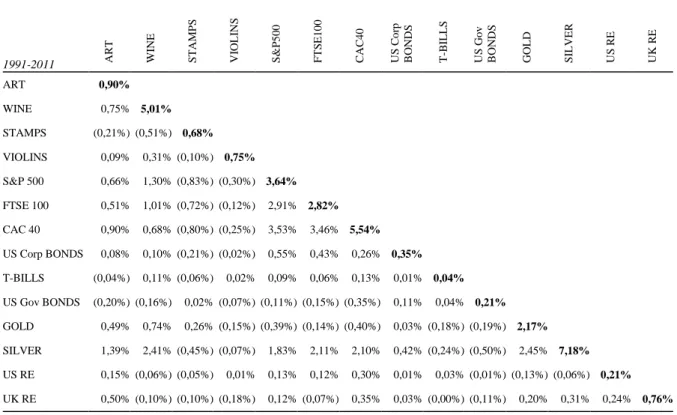
This paper investigates whether emotional assets can provide potential hedge or diversification solutions to financial investors, especially when facing economic and financial crises like over the very recent period. In particular, I use data from Dimson and Spaenjers (2011) to analyze correlation of various emotional assets (art, stamps, violins) over the long term with main other asset classes, and stocks in particular. I provide a lagged-CAPM analysis to quantify the exposure of emotional assets to stock returns, and find evidence that there exists a positive correlation between emotional asset and stock returns, but mainly with a lag of 1 or 2 years depending on the asset. In addition, art appears to be the emotional asset, whose correlation with stock markets is the highest at 57.5% with 2 lagged and 1 leading market returns. I also complete a study on diversification based on Mean-Variance optimization, which tends to give evidence that emotional assets do provide diversification benefits for financial investors. Our results for the tangency portfolio imply an allocation of almost a third to emotional assets divided between stamps, violins and wine. Among alternative assets, Real Estate also proves to be interesting from a financial perspective while commodities like gold or silver are much more disregarded.
2 First of all, I would like to thank Christophe Spaenjers for providing me with helpful advice and data throughout the elaboration of this thesis.
I would also like to thank Jacques Olivier and all the teachers from the « Majeure Finance » for this outstanding last year at HEC Paris, which has been rich in lessons both on the academic and personal sides.
3
Table of contents
INTRODUCTION ... 4
I. EMOTIONAL ASSETS : MAIN FEATURES, INVESTMENT PURPOSES AND INVESTOR BEHAVIOR ... 7
A.PRESENTATION OF EMOTIONAL ASSETS ... 7
B.PROS AND CONS OF INVESTING IN COLLECTIBLES ... 8
C.INVESTOR BEHAVIOR : CONSUMPTION VS. FINANCIAL INVESTMENT ... 12
D.SUMMARY AND CLASSIFICATION ... 15
II. PERFORMANCE OF EMOTIONAL ASSETS AND PORTFOLIO OPTIMISATION IN LITERATURE ... 16
A.METHODOLOGY USED : HEDONIC VS. REPEAT SALES, AND THE EMERGENCE OF THE HYBRID APPROACH ... 17
B.HISTORICAL RISK-RETURN PERFORMANCE OF VARIOUS EMOTIONAL ASSETS ... 20
1)ART ... 21
2)WINE ... 27
3)STAMPS ... 33
4)DIAMONDS ... 36
5)VIOLINS AND OTHER ANTIQUES ... 37
C.PORTFOLIO OPTIMISATION IN EXISTING LITERATURE ... 38
III. MODELING EXPOSURE OF EMOTIONAL ASSETS TO MARKET RISK AND PORTFOLIO DIVERSIFICATION ... 41
A.DATA ... 41
B.METHODOLOGY ... 44
C.RESULTS ... 49
1)LONG-TERM HISTORICAL CORRELATION AND EXPOSURE TO STOCK RETURNS ... 49
2)RESEARCH ON PORTFOLIO ASSET ALLOCATION ... 53
CONCLUSION ... 58
4
Introduction
The world has recently faced two very important financial crises since 2008, the first one due to subprimes and the second one to sovereign debt. Both crises significantly affected stock markets and financial investors. Generally speaking, all financial and economic crises, even though they have different sources and present different features, have similar consequences on poor stock returns and increasing markets’ volatility. From this observation, we can wonder whether there exist some other assets that would outperform stocks and could thus help an investor diversify his portfolio and to some extent help him get better returns in time of financial crisis. Main alternative assets that are commonly considered are commodities (investing in gold or silver for instance) or real estate, and emotional assets from a pure financial perspective are often disregarded or forgotten. Some of the reasons are that to invest in such asset classes, you need a certain expertise, markets are much more illiquid than markets for other assets, or that the equilibrium price of emotional assets is unknown and as a result, pricing evaluation is impossible. We could also talk about the low market transparency, high transaction costs, the general expertise discrepancy between sellers and buyers. But anyway, when looking back at financial crises, we can see that traditional alternative assets can be deeply affected by the crisis, like real estate in 2008 during the subprime crisis. Therefore, an investor may find a true rationale for including emotional assets like art, wine, or diamonds in his portfolio diversification strategy, especially if we consider that main concerns of High Net Worth Individuals are capital preservation (97% of people) and Effective portfolio management (94%) according to a survey from the Capgemini World Wealth Report 2010. Thus, investments in emotional assets have been expanding again after the 2008 crisis despite the population of High Net Worth Individuals was strongly affected by the financial crisis. Indeed investments of passion kept on rebounding in 2010 and a large part of wealth invested was made in art (22%) even though it decreased a bit compared to 2008 (25%) while other collectibles investments boomed both in value and relative to other investments of passion (15% of investments of passion in 2010 vs. 12% only in 2008)1. As a result, Capgemini World Wealth Report 2010 states about collectibles : « Collectibles such as Art, which are deemed to have a low or negative correlation with mainstream financial investments,
1
5 continued to have portfolio-diversification appeal »1. Art market in particular is experiencing a major transformation, among others due to the « increasing recognition of art as an asset class »2. This recognition, and increasing interest in art and collectibles in general, notably derives from the current cautious environment for investing (see Clare McAndrew3) and from the fact that recent research published (see Deloitte Art & Finance Report 2011, Mei & Moses and AMR indices ; discussed further in Parts I.B and II B)) tends to show that art has outperformed equity since 2000. Good returns are backed by recent strong Asian demand, and the development of art loans and other art investment financing facilities. Today, 83% of private banks « feel that there are strong arguments for including art and collectibles in traditional wealth management »2.
Thus, the following thesis is aimed to discuss two main subjects : First, as previously stated, the current global economic situation and outlook is unprecedented for several reasons. Indeed, today markets have been bearish for several years. Unlike previous crises, the recovery is very long to arrive and the present situation, given all the concerns about sovereign debt for instance, is likely to last. Therefore, the interest of emotional assets as alternative investments in such a situation may be real. As such, we will research, whether emotional assets can on average be more resilient to crises than other asset classes. Actually, investor behavior is not purely financial as theorized by Belk (1995) or Mandel (2009), what is developed into more details later in the thesis (see Part I C)), and empirically confirmed by recent reports (Deloitte Art & Finance 2011 : only 49% of collectors say to be primarily driven by investment returns). As a result, this may impact prices and returns, even if they still depend on demand (as suggested by Mandel, the main driver of art returns is the « dynamic demand »4) and hence on the wealth available1, or affect correlation with financial markets and the general economic situation, thus providing potential diversification opportunities. This analysis will mainly be based on the review and study of literature and of different ways to calculate returns that were introduced in the past. In fact, some of the main difficulties of these assets are that markets are illiquid, there is no equilibrium price for
2
Deloitte Art & Finance Report 2011
3
C. McAndrew, « The international Art market 2007-2009 : Trends in the art trade during global recession », 2010
4
6 assets as we are commonly used to defining it, so evaluating prices of assets is really tough, and data are rare and hard to find for several reasons (low quantity of transactions, heterogeneity of assets, in art for instance, and difficulties to calculate and compare returns…). We will then compare historical returns of emotional assets to stocks, and try to determine historical correlation between emotional assets and traditional financial assets as well as exposure of emotional assets to market risk through a lagged CAPM analysis.
We will also study whether emotional assets provide diversification opportunities for financial investors. Benefits resulting from diversification have been assessed for quite a long time and, in addition, nowadays traditional assets are more and more correlated thus reducing the impact of such a diversification by investing in stocks from different countries or sectors. In 2007, Richard Bernstein and Kari Pinkernell stated that correlation between the S&P 500 and main other asset classes including stocks, commodities, hedge funds and real estate had increased over the past 10 years to a level sometimes in excess to 90%, and even art was today positively correlated with S&P 500 even though the level of correlation was lower than with most of previously cited assets. Actually, although assets are positively correlated, diversification can still be useful to optimize risk and return of an investor’s portfolio. Indeed, « the benefits of diversification across asset classes remain substantial »5. As a result, emotional assets individually and altogether may be of interest as alternative investments to achieve a better portfolio diversification. In particular, as emotional assets are numerous and present different features, it might be interesting to combine various emotional assets into a same portfolio. Furthermore, we also need to take into account the standard deviations of assets when estimating the benefits of diversification5 and so, we will research whether, when considering both the correlation of various emotional assets with other asset classes and their return / standard deviation profiles, based on Markowitz mean-variance optimization, emotional assets are really of interest and should be included in portfolio diversification strategies.
5
Statman and Scheid, « Correlation, return gaps and the benefits of diversification », 2008
7
I. Emotional assets : Main features, investment purposes
and investor behavior
A. Presentation of emotional assets
There are very different types of emotional assets from art to wine through diamonds, stamps, antiques. However, they all share some common and very particular characteristics that make them comparable between each other and a unique asset class. While other asset classes generate cash flows or have a real and intrinsic use value by being part of an industrial process for instance, it is not the case of emotional assets and besides that is also why it is so hard to value these assets. Most of emotional assets can be used like other assets such as commodities but in a different way. They have no industrial use so the only way to benefit from such an asset is for itself (emotional assets are stable over time, they are not aimed to be transformed like commodities and they are not generating any activity like companies or real estate), and from an aesthetic or pleasure perspective. In addition, emotional assets can actually only have a marginal use value for the buyer, from a « social » perspective potentially. If you take the example of art, a painting is just aimed to be watched, potentially to be showed, thus you do not get any value added or cash flows from it except at the resale of course. In the case of wine, it is more or less the same with the major difference that it is a perishable asset so once you consumed it, it has no longer value, but anyway it has no other use than the traditional way to consume it. Moreover, all these assets are unique (art) or at least very limited (fine wine, stamps, antiques) or rare (diamonds) and that is also where their value comes from in addition to a general recognition of quality and luxury6.
Nevertheless, all these assets are traded like any other, although with less elaborated market, and that is precisely why they can be considered and used from a financial perspective. Indeed they are not just following inflation, they have a real
financial life with returns, volatility and correlation with other assets that can be used to
create optimal portfolios even though they present many drawbacks especially because of the lack of information as we will see into more details in the next part. Though it remains at a very early stage of development, the elaboration of databases, indices with own and various methodologies, and works on these topics, especially for art, have
6
R. Belk, « Collecting as luxury consumption : Effects on Individuals and Households », 1995
8 enabled to create an entire and separate asset class. An evidence of this is the current trend for art investors to invest across a range of art sectors to hedge against the risks of market declines for a particular artist or category within their art portfolio7. In addition, investment professionals after the crisis of Real Estate, are now talking about SWAG (silver, wine, art and gold) as the new type of successful alternative investment, which implies that art and emotional assets in general are entering the mainstream spectrum of alternative assets. As a result, today the market for art is bigger than ever, even despite the recent global financial crisis and recession, since the global art market size in 2009 (€31.3bn) is higher than ever before 2006 despite a drop by 12% and 26% of the size of the global art market in 2008 and 2009 respectively7. Other emotional assets’ markets have also been continually increasing over the past decades8. The rebound recorded in 2010 and 2011, partly driven by the booming demand in Asia enables to catch up with the level of 2007 : Indeed China already accounted for 14% of the global art market in 2009 while the US and UK were still dominating the market with a combined market share of nearly 60%7.
Simultaneously, art loans have appeared both on a recourse (traditional banks) and non-recourse (specialist lenders, auction houses) basis helping create liquidity on the art market and helping it grow even faster. Actually art financing has existed for several decades, but what is really a revolution in the art market, is the emergence of non-specialist lenders and new dedicated lending sources from traditional banks. Thus, Deutsche Bank for instance was particularly active in both 2010 and 2011 reporting c.$400 million of art-backed loans on its books9.
B. Pros and cons of investing in collectibles
Rationales for investing in emotional assets are easily identifiable. It enables an investor to diversify his investments. It offers kind of long-term stability and is as a result often considered as a safer investment because it relies on a « hard » and tangible asset, in addition to the potential passion or pleasure behind the investment. In fact, almost all art investors report that their main motivation for investing in art is focused
7
C. McAndrew, « The international Art market 2007-2009 : Trends in the art trade during global recession », 2010
8 Capgemini World Wealth Report 2011
9
9 on aesthetic and by passion10. Then it is also asserted by Deloitte, relying on research by Mei & Moses, that art for instance has outperformed equity over the past ten years and hence that investing in art provides better returns than equity. Indeed, their research shows that 48% of art advisors said their clients and 49% of collectors themselves were primarily driven by investment returns10. These assets could therefore have a better resilience to financial crises as they are not linked to any economic activity and that reasons behind investor behavior are primarily non-economic, even if contraction of financial markets logically implies a drop in cash available and therefore in investment in emotional assets as observed in the latest crisis11. We will actually study and make empirical research on this particular issue later in the thesis (see Part III). Investing in collectibles like art offers non-negligible taxation advantages to investors as explained by McAndrew and is particularly interesting when most regulators are thinking about a potential taxation on financial transactions.
On the other hand, drawbacks are numerous and actually we already approached some of them previously in this thesis. First of all, the absence of regulated and easily tradable financial markets is a major obstacle. Actually trades involving emotional assets are made through auctions or on OTC (over-the-counter) markets and hence there is no common and standardized (i.e. with valuation standards in particular) market for these assets even for art. Besides it is recognized as such by Deloitte with 73% of private banks seeing it as one of the main hurdles in the expansion of the art market10.
Then transaction costs are high. In fact, trades are made through intermediaries and experts because of the nature itself of these assets : they are heterogeneous by nature because they are all unique and different, with few similar pieces traded each year, so there is necessarily a need for valuation and certification for instance before each trade. In addition, as further developed by Mamarbachi, Day and Favato in 2006, there usually are large differences in expertise between buyers and sellers so the risk is accrued which makes being cautious even more compulsory before making a trade. That is basically why transaction costs in emotional assets are much higher than for any other
10
Deloitte Art & Finance Report 2011
11
C. McAndrew, « The international Art market 2007-2009 : Trends in the art trade during global recession » pg 21, 2010
10 asset even real estate, and which makes for instance short-term speculation very hard and subsequently slowing the financial development of these asset classes.
Other costs to store these kinds of assets are also high. Indeed, since they are « hard » tangible assets, they need to be stored, restored for some of them like art or stamps in order to be maintained in a good shape and thus keep their value. There is also a need for accrued security around these types of assets because they have a high value, and owning art or diamond requires the implementation of specific security systems for instance. All these arguments explain that storage costs are quite significant for investors in emotional assets and that from a pure financial point of view, as these types of assets are generally expected to be kept during a certain amount of time given the transaction costs, these storage costs cannot be avoided and need to be taken into account when calculating historical or estimating expected returns just like transaction costs.
Other drawbacks add up to the ones previously mentioned, among which the low liquidity of emotional assets’ markets, although this issue is well-known and markets players are continually trying to address it. Low liquidity implies an increased spread between buy and sell prices and as much transaction costs and potential loss on your investment. In addition, investments in emotional assets are necessarily large investments – buying a painting or diamonds is expensive - which means that portfolios must be large enough in order to be able to benefit from such a diversification. As a result, altogether this also adds risk to these types of investments because on one hand you buy expensive assets so you can buy only few assets and on the other hand, since markets are illiquid, the risk at the resale is real.
Low transparency of markets is a major concern too. Information on emotional assets is definitely scarce and discrepancies in knowledge and expertise between market players very important. Today it is particularly hard to find the right expertise when investing in emotional assets. In addition, data about return, volatility for instance are not as easy to access and to use as for other asset classes. Actually, one significant issue and bias when making financial investments in emotional assets and calculating returns or risk is that the data you can get are hardly comparable with stocks for instance because you can only get yearly or at best quarterly or monthly data, and because the way to calculate returns and by extension volatility are also different (hedonic approach for example), so you cannot really appreciate to what extent your calculations can be considered as right or biased, but we will discuss this further later in the thesis.
11 Some other drawbacks are put forward by Mamarbachi, Day and Favato (2006) : Markets have a much weaker equilibrium process than other securities, and as the equilibrium price of such assets is unknown, an objective valuation (by discounting future cash flows for instance) is generally impossible. Elasticity of supply is very low and in certain cases even equal to zero (i.e. in art for dead artists, for antiques like violins or rare books for instance). Finally, there exist monopolies especially for owners of art which means that investors are generally in a position of weakness when buying emotional assets.
Eventually, Baumol (1986) describes this lack of equilibrium price for art in particular, as a « floating crap game », since prices of such items « can float more or less aimlessly », and « their unpredictable oscillations are apt to be exacerbated by the activities of those who treat such art items as « investments » and who, according to the data, earn a real rate of return very close to zero on the average ». Indeed, he used data of art prices over a very long period (1650-1960) and took out the effects of inflation to demonstrate that the real rate of return of art investment is close to zero (0.55% per year on the average). Although this analysis points out some major issues of emotional assets like the absence of equilibrium price, it also includes several important biases : first he went back very long in the past when financial markets and investments obviously did not exist instead of focusing only on the very recent period which is very different from what we ever knew before. Then this analysis was made in 1986 at a time when financial markets were much smaller and markets for emotional assets were just nearly inexistent. Therefore, it does not take into account, the fact that an increasing wealth and demand globally, that a much bigger, more liquid and more regulated market can totally change the results for future returns. Eventually he considers art investing just for itself and completely disregards all the benefits to derive from diversification of financial portfolios or from the potential resilience of such assets to economic and financial crises. In addition, the absence of equilibrium price for emotional assets is probably not that worrying from a financial perspective since for other asset classes, change in prices is always stochastic, so nearly unpredictable, which means that investing in financial assets in a way is always a floating game.
12
C. Investor behavior : consumption vs. financial investment
As previously mentioned, reasons for investing in emotional assets are not only financial. As analyzed by McAndrew (2010), the first reason for investing in emotional assets is by passion. Indeed almost all collectors report that they buy emotional assets by passion first even though they also admit that these investments also have financial purposes since they generally have strict price criteria for instance.
Other authors analyzed more in depth the behavior of investors in emotional assets and the rationale behind the « consumption » of such assets. To begin with, Burton and Jacobsen (1999) discussed what the nature and behavior of investors in emotional assets is, and what consequences it may have on prices and returns of collectibles. They describe the market for emotional asset as being dual to some extent, with a large proportion of people investing in emotional assets for non-pecuniary purposes (i.e. just « to enjoy owning them » - referred as consumption goods), so that given the low number of investors and the relative illiquidity of the market, it may be easy for pure financial investors to manipulate this market in order to get very high returns and make a lot of money, all the more than there are no cost fundamentals or production concerns since you are in the resale market. This analysis is probably a bit too simple, because first it is impossible as for any other financial market to predict what the next « hot spot » or bubble is going to be and thus what market or asset is going to outperform others. Then, they probably underestimate the weight of financial rationale when investing in emotional assets because, at the end of the day, any investor is willing to make a good investment and get a positive return even though it is not his main concern, his primary driver (51% of investors would be concerned according to Deloitte12). However, it might lead to behavioral anomalies like the « endowment effect » (« an art object owned is evaluated higher than one not owned »), the « opportunity cost effect » (« not considering returns from alternative use of funds ») or the « sunk cost effect » (building up a collection) as stated by Frei and Eichenberger (1995).
Belk (1995) introduces the idea of luxury consumption, that emotional assets like collectibles are bought in particular because they are unique and useless objects, and that investors want to acquire « inessential consumer goods that are removed from
13 any functional capacity they may once have », so just because they are unique or very rare. To a certain extent, this is linked to the notion of conspicuous consumption that we will talk about later in this part, because having unique and expensive objects refers in a way to the pleasure to show to other people that you own something special that they cannot afford or simply have. Koford and Tschoegl (1998) took over this analysis to demonstrate that rarity has a positive impact on the value of a consumer good like for emotional assets. They use the example of rare coins to prove that in the case of emotional assets, the fact that these assets are unique or very rare increases the utility function and as a result adds up value to the asset for the investor without increasing the quality of the item.
Campbell, Koedjik and De Roon (2008) extend to emotional assets the multi-attribute utility function defined by Bollen (2007), which models the utility of investors by lower risk-adjusted returns compensated by the additional utility that derives from « investing in financial assets which adhere to their societal or personal objectives »13. They include the fact that this additional utility might also be a function of wealth given that people with the greatest incomes are the ones that invest the most in emotional assets. They also put forward the notion of consumption for emotional assets giving them therefore an intrinsic value such as consumption goods and apart from their monetary value. As a result, this intrinsic value corresponds to a form of aesthetic pleasure for instance and thus to the emotional part from the utility function of these assets which can explain why people may buy emotional assets for more than their pure monetary value13. Like them, I believe that this emotional utility part is real for investors and that it is logically included into the prices and returns of emotional assets because prices are the quantitative reflection of all the potential utility for investors. Nevertheless, it might be abusive to dissociate the monetary value from the emotive value from a quantitative perspective since it is nearly impossible to quantify each part and indeed they might be different from one investor to another.
To go further into the analysis of emotional assets as a consumption good, Corneo and Jeanne (1994) define conspicuous goods as « goods that are mainly purchased because of the demonstration effects that their consumption exerts on others ». It is kind of a social consumption and enables indeed its owner to signal and
13
Campbell, Koedjik and De Roon, « Emotional Assets and Investment Behavior », 2008
14 raise his social status and thus « the amount of deference shown by others » and his « approval by the society ». They model this form of consumption as a « signaling game » depending on your wealth (both what you can afford and what you want to show as being your social status). It is particularly true for certain emotional assets like art or diamonds for instance. Thus, Scott and Yelowitz (2010) take the example of diamonds and claim that such goods can be consumed as conspicuous assets, « not just for their intrinsic utility but also for the impression their consumption has on others ». They find that people are willing to pay quite significant premia on average just to marginally increase the quality of the diamond they buy and reach the next threshold.
Finally, Mandel (2009) took the example of art to explain that the « determinants » of the value of such an asset are different from other financial assets. Indeed, on one side « art offers no claim on an underlying stream of payments », and on the other side the elasticity of supply is nil because the market is « dominated by the masterstrokes of dead artists » and « many living artists are relegated to the domain of fad, avocation, or financial ruin » so that at the end the only driver of art returns is the « dynamic demand » for art what is of course very different from other financial assets. Then, he further develops the notion of conspicuous consumption by defining it as a « consumption that is unrelated to the intrinsic value of a good », and which is applicable to all assets that are consumed, for aesthetic pleasure for instance, but that are not used, so with a very low rate of depreciation (i.e. mainly objects that you consume by the pleasure of owning, watching, showing them – « non-pecuniary benefits »). He explains and models the fact that art, and by extension all emotional assets, tend to have low or even negative risk premia (through a simulated consumption-based CAPM) and therefore underperform equity consequently to an utility that is not only financial. I agree with the fact that investors in emotional assets can be likely to accept the risk of getting lower returns because of this additional utility. Nevertheless, the relation between consumption and returns is probably even more complex and that it cannot fully explain lower returns for art or other emotional assets since it is not because investors may have another rationale for investing in emotional assets, may have non-pecuniary benefits and an additional utility, that they automatically get low returns or disregard their investment return. In addition, in Mandel’s experiment, the correlation
15 between art real returns and equity remains low14 and likely to be still very interesting from a financial perspective especially in prevision of bearish markets and high volatility of other asset classes, all the more than on an historical basis, partly due to the booming demand for art, it is said to have outperformed equity over the 2000-2011 period15. Anyway, we will investigate this later in the thesis.
D. Summary and classification
To sum up, we can acknowledge that emotional assets are very different from traditional investments on many points, and especially because unlike other asset classes they do not generate cash flows apart from their sale nor are consumed for their intrinsic value. They are consumed as conspicuous goods and therefore their valuation is first variable (no equilibrium price) and linked to demand only, and secondly very hard since it’s really tough to estimate their utility function at least for the emotive part. However, they can still be considered as financial assets because they are traded like any other assets though on OTC-like markets, and have indeed each very interesting features from a financial perspective, all the more than demand in particular from Asian emerging countries is booming.
14
B. Mandel, « Art as an investment and conspicuous consumption good », 2009 : Table 3
15
16 T a b le 1 C h a ra ct er is ti cs o f m a in e m o ti o n a l a ss et s
A
rt
W
in
e
S
ta
m
p
s
D
ia
m
o
n
d
s
O
th
e
r
A
n
ti
q
u
e
s
L
e
v
e
l
o
f
d
e
v
e
lo
p
m
e
n
t
o
f
th
e
m
a
rk
e
t
H
ig
h
M
e
d
iu
m
L
im
it
e
d
M
e
d
iu
m
L
im
it
e
d
/
V
e
ry
lim
it
e
d
E
la
st
ic
it
y
o
f
su
p
p
ly
A
lm
o
st
n
il
L
o
w
N
il
L
o
w
N
il
L
iq
u
id
it
y
o
f
th
e
m
a
rk
e
t
L
im
it
e
d
L
im
it
e
d
V
e
ry
l
im
it
e
d
L
im
it
e
d
V
e
ry
l
im
it
e
d
D
a
ta
&
i
n
fo
rm
a
ti
o
n
a
v
a
ila
b
le
G
o
o
d
M
e
d
iu
m
L
im
it
e
d
L
im
it
e
d
V
e
ry
r
a
re
D
e
g
re
e
o
f
u
n
iq
u
e
n
e
ss
U
n
iq
u
e
L
im
it
e
d
V
e
ry
l
im
it
e
d
L
im
it
e
d
V
e
ry
L
im
it
e
d
D
e
g
re
e
o
f
c
o
n
sp
ic
u
o
u
s
c
o
n
su
m
p
ti
o
n
V
e
ry
h
ig
h
L
im
it
e
d
(
y
o
u
c
a
n
n
o
t
c
o
n
su
m
e
i
t
w
it
h
o
u
t
lo
o
si
n
g
i
ts
v
a
lu
e
)
M
e
d
iu
m
V
e
ry
h
ig
h
M
e
d
iu
m
P
e
ri
sh
a
b
le
?
N
o
Y
e
s
N
o
N
o
N
o
L
e
v
e
l
o
f
tr
a
n
sa
c
ti
o
n
c
o
st
s
(d
e
g
re
e
o
f
e
x
p
e
rt
is
e
,
in
te
rm
e
d
ia
ri
e
s)
V
e
ry
h
ig
h
M
e
d
iu
m
V
e
ry
h
ig
h
H
ig
h
V
e
ry
h
ig
h
L
e
v
e
l
o
f
st
o
ra
g
e
c
o
st
s
H
ig
h
M
e
d
iu
m
H
ig
h
M
e
d
iu
m
H
ig
h
C
y
c
lic
a
lit
y
o
f
d
e
m
a
n
d
(s
u
b
je
c
t
to
h
o
t
sp
o
t
a
n
d
ri
sk
a
t
th
e
r
e
sa
le
)
M
e
d
iu
m
i
n
g
e
n
e
ra
l
(d
e
p
e
n
d
s
m
o
re
o
n
th
e
t
y
p
e
o
f
a
rt
)
L
o
w
H
ig
h
L
o
w
H
ig
h
M
is
v
a
lu
a
ti
o
n
/F
a
k
e
r
is
k
H
ig
h
M
e
d
iu
m
H
ig
h
M
e
d
iu
m
H
ig
h
17
II. Performance of emotional assets and portfolio
optimization in literature
A. Methodology used : hedonic vs. repeat sales, and the
emergence of the hybrid approach
There exist several methods to calculate historical returns for emotional assets. Basically, given the specificity and heterogeneity of these assets and the relative lack of information and transactions, you cannot use the same methods as for other assets like stocks. Indeed, since each emotional asset is unique like for art for instance, and is traded only rarely contrary to stocks which are traded several million times each day, you are forced to mix comparable assets, make regression, construct indices… We must in particular « address the heterogeneity issue » as well as « distinguish many different collecting categories since returns may vary dramatically » from one to another [Ginsburgh, Mei & Moses (2006)]. As a result, there are of course several methodologies for calculating returns based on historical data that have been developed in existing literature.
Burton and Jacobsen (1999) present and analyze the three main methodologies that are commonly used. The first one is to construct composite indices based on selected sample sets of objects that vary over time: it is largely used by non-economists because easier to implement. The main drawback is that it is not very accurate because rely on several strong assumptions. Indeed it presupposes that all the assets of the asset class are very comparable and thus have exactly the same performance on average since only a few number of assets are generally going to be traded over each period of time and that you even change the sample over time. Then, depending on your sample selection, your results can be very different and be biased depending on which assets inside the sample were traded over the period analyzed. Therefore, it appears not to be an appropriate method to evaluate returns for emotional asset markets.
The second method to construct a price index presented by Burton and Jacobsen (1999) is to run a hedonic regression. This kind of model is frequently used in real estate. In this method, you regress the price of selected items in order to adjust and solve issues deriving from having heterogeneous assets. This is the case for emotional assets, since for instance all works of art are considered as unique, and thus you can regress prices relative to several features like age (particularly important in the case of
18 wine for instance), purchase price, provenance, size, name of the artist/producer, sale location.... This method can in particular be aimed to evaluate the capital gain attributable to ageing in a certain asset class like wine. This is a very powerful method which enables to take into account a very large number of factors and all transactions (not only repeat sales as we will see in the next subpart). However, first you cannot take into account every factor and therefore it is very hard to justify which ones you choose to adjust prices and why not other factors. In addition, it is also very hard to estimate the impact of a qualitative feature from a quantitative perspective, so that you can easily claim that the assumptions made to calculate returns with the hedonic methodology are unrealistic for instance. Indeed, according to Triplett (2004), « its major liability (i.e. of the hedonic method) is the difficulty in introducing weights » into the hedonic function. Then, as stated by Collins, Scorcu and Zanola (2007), the hedonic regression includes drivers that are not time-varying and therefore implies some very strong assumptions regarding the structure and stability of the market over time. Finally, to implement such a methodology, you need to have a lot of information on each individual sale and goods’ attributes so eventually as for the repeat sales method you will need to take out many transactions on which you do not have enough information. This method is applied today by Artprice Artist index for example whose hedonic regression function takes into account most of the characteristics of an art work, and serves as a reference among art analysts willing to use this methodology.
So the third methodology is the repeat sales approach. It records the changes in price for the same asset over time across a fixed selection. Thus, contrary to composite indices, the sample set does not vary over time. However it has the strong disadvantage to include in the set only assets that are often traded and at least twice over the sample period so it implies a certain bias and disregarding a very large part of transactions. This issue is identified as the « sample selection bias » by Collins, Scorcu and Zanola (2007). It is for instance widely used in art (Mei & Moses Art Price index) and generally considered as « the most consistent and reliable method » to calculate returns since it « averts the need to deal with the many issues associated with the heterogeneous nature of art »16 or other emotional assets in general. It is also adapted to some other emotional assets that are frequently traded like wine but on the contrary, pretty much unadapted to some other emotional assets like most antiques or rare books for instance.
16
19 According to a study from Chanel, Gérard-Varet and Ginsburgh (1994), over long periods results deriving from various methodologies are closely correlated. Therefore, they suggest that, at the end of the day, « returns can be computed using all sales and not resales only » as generally made by authors on art and thus defend in a way the hedonic approach for long-term returns at least. At a similar level, Fogarty and Jones (2010) compare hedonic, repeat sales and hybrid approaches for calculating returns to Australian wine over the period 1988-2000 using 14,102 auction sales. They suggest from their results that the repeat sales approach leads to « significantly higher return estimates » than other methods, what had already been pointed out by Ashenfelter and Graddy (2003) based on their results. Fogarty and Jones also suggest that the hybrid approach, first established by Case and Quigley (1991), by regressing prices according to hedonic criteria while identifying repeat sales as such, though rarely used in existing literature, is the most efficient one. In fact, when looking at their results, returns from the repeat sales approach are slightly higher than with other methods in particular due to a better performance at the beginning of the period. In addition, evolution over time tends to be smoothed especially relative to the hedonic approach. Then, still according to Fogarty and Jones (2010), the hybrid approach provides estimates that are indeed more precise (lower standard error). This conclusion is confirmed by the analysis on Picasso prints completed by Locatelli and Zanola (2005), since they empirically find that the hybrid model provides the most precise estimates by reducing price volatility. However, this relative gain is likely to be largely compensated by the significant additional issues and workload implied by combining both methods especially because of the difficulty to identify time-varying variables – as noticed by Chanel, Gérard-Varet and Ginsburgh (1996), what necessarily leads to further strong assumptions and imprecision – and when elaborating databases, all the more than you might need to ignore some repeat sales data because of missing information and required in order to apply the hedonic function. On the other hand, the Art Market Research (AMR) for instance also uses a slightly different approach, with an index based on a fixed basket of artists for each specific art market (over 500 indices – to address the heterogeneity issue) to show trends in average returns on a monthly basis.
To conclude on return calculation methodologies for emotional assets, one of the main drawbacks of all these methods is that you always need to constitute very large samples and have a large quantity of transactions in order to be accurate, so there is a
20 large amount of work associated to such methods and you need to have access to very large sets of data what in general is hardly the case for emotional assets over short periods at least. Also, given the need of having a large quantity of transactions, you can only get quarterly or semi-annual returns what makes the comparison with returns from other asset classes quite tough. In addition, as stated by Deloitte, such index-based return calculation approach has some other limitations and biases17 : First, you consider only a part of the transactions on the market (c.50% for art) since other transactions are either private or primary sales and therefore not taken into account. Then, you only take into account successful transactions (when the sale has been completed) and totally ignore unsold items. This is identified as the survivorship bias, stressing winners (successful transactions) over losers, and may lead to fairly optimistic results. Moreover, samples are generally built up from auction data which means that transactions retained are the ones which had enough demand to attract competitive bidders that is to say that samples generally include items with strongest demand and ignore those with lower demand. These kinds of indices also ignore transaction costs, which as we saw previously are quite significant in the case of emotional assets. Finally, it lacks predictive power as such indices only reflect historical prices and give no clue for estimating expected returns17. Nevertheless, it remains the best methods to calculate historical returns across a particular emotional asset class.
B. Historical risk-return performance of various emotional
assets
Many authors have calculated and analyzed rate of returns for specific emotional assets. They use various methods, time periods and adjustments, for transaction or storage costs for instance, so that at the end they get sometimes very different results. Papers like Burton and Jacobsen (1999) summarize these results and try to find tendencies on the long run. They also analyze the risk profiles of emotional assets and in particular, in addition to volatility, their correlation both between each other and with stock markets in order to find out whether emotional assets can be considered as a potential hedge against stock markets’ volatility or against inflation for instance. Indeed, they present ideas from Kane (1984 : coins), Ibbotson and Brinson (1987 : coins, stamps, Chinese ceramics, art) or Cardell et al. (1995 : stamps) according to
17
21 which collectibles can provide « hedges against stock market risk » thanks to negative correlation or negative sensitivities to inflation for instance. Other studies suggest on the contrary positive correlation between emotional assets and financial asset markets like Goetzmann (1993) and Chanel (1995) in the case of art.
We will now discuss into more details the rate of returns and volatility for each main emotional asset over the past decades based on literature.
1) Art
Art (i.e. paintings) is definitely the emotional asset on which the largest amount of work has been done so far to calculate historical returns and volatility. It is in addition a very heterogeneous asset class so depending on the approach, data sets considered, and assumptions made, you can potentially obtain very different results.
We can go back to the 1970’s to find the first calculations of rate of returns in art and to Anderson (1974) in particular. He first noticed that art might have had very interesting returns over the past 2 decades, and that art, as previously wrote in this thesis, is a very heterogeneous asset class so that returns could sharply vary depending on many factors like the artist, « the artistic merit of the particular work », or school. He went back very far in the past, until 1780, and up to 1970, to try and establish art long-term returns, which for him are indeed much lower than the most recent returns at that time. In his calculations, he quantified and included certain additional costs and factors to get the real rates of return and eventually found out « that paintings are not very attractive investments unless one also includes the consumption value of art ». He used both hedonic and repeat sales approaches and found a nominal rate of return for art of 3.3% per year on average (until 1960 only - real return of 2.6%) and 3.7% (1780-1970 – real return of 3.0%) respectively for each approach, while more modern works (impressionists, 2Oth century paintings) have generally higher returns than old masterpieces, and returns over the last twenty years (1950-1970) were significantly in excess to the long term average. He also estimated the standard deviation (volatility) in annual returns to be 56% (for both 10 and 20 years holding periods) before concluding that considering the low risk-adjusted performance of art that the primary motivation for investing in art must be its consumption value and not financial. As previously stated in this paper, although it is helpful to have calculations of long term rate of returns, we should notice that the most recent and expected returns for art are absolutely not the
22 same as long term historical returns over the past two or three centuries. Indeed, art prices and returns are notably linked to demand, or to the level of development of the art market, which is today definitely not comparable to what we ever knew in the past (especially because of the increasing wealth worldwide, the booming demand in emerging countries, or the appearance of speculators on the art market), and what as a result can for instance lead to different conclusions on the interest of art from a financial perspective.
Baumol (1986) made a comparable work by analyzing, through the repeat sales approach, a sample of 642 transactions from 1642 to 1961. This study seems to include strong biases, first because, as for Anderson, it goes very far in the past in order to find several transactions on the same art work and thus can only deliver long term returns that are, according to me, totally disconnected to the reality of today’s returns, which are actually the ones of interest for potential financial investors (actually the further back you go in the past, the lower average returns are). This is even amplified by the fact that he excludes all transactions that were made within an interval of twenty years because too close to each other in his view, what actually tends to remove from the sample all best performing art works that were frequently traded during the 20th century, to eventually retain a quite small sample (640 transactions vs. more than 1,500 artworks retained, i.e. more than 3,000 transactions, for Anderson and more than 2,800 works for Goetzmann over shorter periods) with mainly underperforming pieces of art. Thus, he finally gets an average real rate of return of 0.55% per year for art (with a median slightly higher at 0.85% - 1.25% and 1.55% respectively for nominal rates of return) and compares art returns to returns from other asset classes like government bonds to see that there is an « opportunity loss upon the holder of the painting of close to 2% per year ». However, his calculation of government securities’ return is somehow unclear (« Probably about 3.25% was a representative nominal rate of return for the period ») and in particular it seems to disregard the fact that for instance over the period analyzed, some historical events, like revolutions, depressions, World Wars, communism, could have actually made governments securities much riskier than what we could imagine. So although investing in emotional assets alone may not be interesting from a pure financial perspective especially because of its higher risk profile, results from Baumol are probably underestimating the financial potential of these emotional assets.
23 Goetzmann (1993) uses a similar methodology as Anderson over the period 1715-1986 and constructs an art return index from art works traded at least twice over the period. He evaluates the risk-return performance of art investment in comparison to stock markets in particular. He finds out that since 1850, since the index has been « well estimated » (before 1850 estimations are proved to be poorly accurate according to his results), art returns outperform stocks and bonds with a rate of return at 6.2% per year but volatility is high at 65%. He also finds evidence of a strong positive correlation between art demand and increase in global wealth, thus proving what we intuitively stated previously in this thesis. He also infers the high positive correlation between art and stock and bond markets that from a financial perspective, art might not be « an attractive purchase for investment purposes alone » especially for a risk-averse investor despite « returns in the second half of the 20th century have rivaled the stock market ». Nevertheless, one cannot ignore the very high rates of return found since 1900 (17.5% per year on average), all the more than volatility is lower over the period 1900-1986 (52.8%) than ever before and is particularly high actually because of the strong underperformance and bearish market during the global recession in the 30’s or wars as proved by other authors (standard deviation found by Mei and Moses (2002) since 1950 is much lower at 21.3% for instance while it is at 35.5% since 1900 for instance18). In addition, correlation between art and other financial markets, though significantly positive, is at the end not that high (54% with bonds, 78% with LSE since 1900), given that economic and political troubles over the first half of the century is likely to make it increase and given what Bernstein and Pinkernell stated in 2007 about the very strong correlation across all financial asset classes. Furthermore, results from other studies tend to show that actual volatility and correlation between art or other emotional assets and stocks are in fact lower than what stated by Goetzmann (i.e. Mei & Moses or Rachel Campbell for instance).
Pesando (1993) analyzed the market for modern prints with a semi-annual index built up through repeat sales methodology over the period 1977-1992. Like peers, he observes that the risk-adjusted performance of art is lower than for other financial assets and thus art compares « unfavorably » to other asset classes. From his print price index, he states that between 1977 and 1992 art prices and nominal returns reach their
18
Mei and Moses, « Art as an investment and the underperformance of masterpieces », 2002
24 historical high in 1990 (5x higher than in 1977) before falling at the beginning of the 1990’s to 3x the level of 1977. Therefore, the annualized average nominal rate of return over the whole period is 7.6% per year while annual real return is 1.5% only, below real returns of other financial assets like stocks or bonds. However, it is interesting to notice that until 1990 only, its highest level over the period, the nominal return is 13.7% per year and that standard deviation of art is more or less in line with other financial assets (19.9% for art in general and 23.4% for Picasso prints vs. 22.5% and 21.8% for stocks and US government bonds respectively) while correlation is significantly lower with stocks (30%) than what observed by previous authors (i.e. Goetzmann) and even negative with bonds (-10%). He is also among the firsts to argue that masterpieces underperform the market for art with the lowest cumulative return between 1980 and 1992, what will be then reformulated by Mei and Moses in particular.
Mei and Moses (2002) constructed a price index for the period 1875-2000 based on the repeat sales methodology, and which is today widely used among art analysts because it tries and addresses the issues linked to heterogeneity of artworks and infrequency of trading. In addition, this index is more « exhaustive », on the American market at least, since it takes into account a much higher number of transactions than previous studies from Goetzmann, Baumol or Anderson for instance. They find that return for art is on average slightly lower than stocks in particular over the more recent period (1950-1999) and significantly higher than government bonds which are much less risky assets. Indeed art provides a nominal rate of return of 4.9% per year over 1875-1999 and of 8.2% over 1950-1999. Standard deviation for art is slightly higher than for stocks over 1950-1999, which means that art compares unfavorably to stocks, but records a very important fall in volatility over the more recent period from 42.8% over 1875-1999 to 21.3% over 1950-1999. Furthermore, correlation between and other assets appear to be very interesting from a financial perspective (4% with S&P 500 and -15% with government bonds). From their CAPM analysis, they find that art beta (relative to S&P 500) is 0.719. Then, like Pesando they observe the sharp drop in art prices at the beginning of the 1990’s after the 1990 bubble. They also present some more evidence, further to Pesando analysis, of relative underperformance of masterpieces.
Campbell (2005, 2007, 2009) first based her analysis on the two main art indices that are the Mei & Moses and the AMR indices. As noticed earlier in this thesis, the repeat sales approach used by Mei & Moses leads to higher returns (10.1% per year
25 between 1976 and 2001) than the AMR index for instance (5.3% per year). She then desmoothes the returns for art in order to capture the « true » return and volatility of the market and in particular to get rid of the « appraisal-induced biases » and also includes additional and necessary costs linked to art investment. She ends up with an average annual return for art of 6.76% between 1980 and 2008 and a standard deviation of 17.30% (significantly higher than bonds at 7.25% and slightly higher than stocks and gold at 14.61% and 14.53% respectively). Correlation with all asset classes (stocks, bonds, commodities and real estate) is found to be very interesting for portfolio diversification strategies, often negative and in any case no higher than 10% (Commodity index).
Some other authors like Chanel, Gérard-Varet and Ginsburgh (1994) use the hedonic approach enabling them to consider all sales and not only resales which is aimed to give wider and more accurate results. They also decided to take into account all other costs to calculate real returns from nominal returns and in particular, in addition to transaction costs, all storage and insurance costs, but excluding inflation. For their well-known 32 painters hedonic index, they obtain an annual average nominal rate of return of 13.3% and a real rate of return significantly lower at 7.0% over the period 1962-1988, while inflation rate is estimated to be at 5.9% per year. It is also interesting to notice the great performance of art during the 1980’s (real return of 19.6% per year between 1980 and 1988).
Richard Agnello (2002) also proposes a hedonic approach to calculate art returns and volatility. He uses a significant number of features to build up his hedonic function and applies this model to a very large number of transactions (25,217), what altogether tends to give reliability and accuracy to his results. He obtains an overall return of 4.2% per year between 1971 and 1996 with significant discrepancies between various submarkets (school, subject of the painting in particular) and an annualized standard deviation of 23.1% (vs. 11.6% return and 12.1% volatility for S&P 500). Correlation with S&P 500 and government bonds is relatively low at 23% and 7% respectively for the overall art market.
This approach was favored by Renneboog and Spaenjers (2011) as well, over a 50-year period, between 1957 and 2007. They provide an extensive and robust model, resulting in a quite low annual return at 3.97% per year, probably suffering from the fact that they go back as far as 1957 to calculate art returns. Indeed, over the last 25 years only, the annual mean return is significantly higher at 5.19% per year. Standard
26 deviation over the whole period is high at 19.05%, which implies a Sharpe ratio at 0.2, quite lower than the ones of traditional financial asset classes (i.e. stocks and corporate or government bonds) but higher than US government bonds alone, commodities and real estate. In addition, correlation is found to be negative with S&P 500 and bonds while positive but still low with global stocks, commodities and real estate.
Kraussl and Van Elsland (2008) use a 2-step hedonic model, which enables to estimate the regression coefficients on a sub-sample of artists and which will then be used into the regression function to calculate returns for the whole sample. This is aimed to provide more accurate returns by enhancing the robustness of the hedonic equation. This methodology is thus applied to the German art market over the period 1985-2007 and provides an average annual rate of return of 7.3% for an annualized standard deviation of 17.9%. With this model, correlation of art with other asset classes appears to be lower than all other assets between each other and therefore the most interesting for investors (-6.8% with commodities, 15.4% with Real Estate, 16.4% and 25.3% with corporate and government bonds respectively, 18.9% with stocks). At the end of the day, results obtained from the 2-step hedonic model are very closed to the ones derived from the traditional methodology, so that the utility of such an enhancement of the hedonic approach seems to be very limited.
To sum up, most of results show that art risk-adjusted returns tend to compare unfavorably with other asset classes, with bonds in particular. Nevertheless, despite what some of them may claim (i.e. Baumol, Goetzmann), it seems that art provides returns that may be of interest for financial investors, especially thanks to their attractive correlation with other financial assets. Then, returns obtained in various papers can differ significantly because of many reasons like the period chosen. This includes how far you go in the past, and also how you include the significant art bubble that occurred at the end of the 1980’s, and burst at the beginning of the 1990’s. Indeed, articles that analyze the 1990’s period (Locatelli and Zanola (2005) for instance) can present relatively poor returns while other papers focused on the 1980’s or on the 2000’s would tend to show more bullish returns. Other issues are the methodology used (repeat sales returns tend to outperform hedonic returns), the way it is applied, the selected sample, adjustments to calculate real returns (actually, definition of what nominal and real returns are, can vary significantly from one author to another, whether they include transaction, storage or insurance costs, inflation etc.)… Finally, two
27 indices are widely used today among art analysts : the Mei & Moses index, as established in 2002 and based on the repeat sales approach, and the second one, the AMR index, whose methodology refers more to the hedonic approach.
Table 2 - Summary table on literature on art returns and volatility
2) Wine
Wine is one of the emotional assets, after art, on which most work has been done so far. Wine is also a very specific emotional asset with particular features. Indeed, the quality of wine is probably much more concrete than for art for instance where you
Author(s) Period
analysed Methodology Annual return
Annualized volatility
Correlation with other asset classes 3.7% (nominal) 3.0% (real) 3.3% (nominal) 2.6% (real) 1.25% (nominal) 0.55% (real) 1850-1986 6.2% (nominal) 65% 1900-1986 17.5% (nominal) 52.8% 7.6% (nominal) 1.5% (real) 13.3% (nominal) 7.0% (real)
1875-1999 4.9% (nominal) 42.8% 4% with S&P 500 1950-1999 8.2% (nominal) 21.3% -15% with gov. bonds
23% with S&P 500 7% with gov. bonds Rachel Campbell
(2005-2009) 1980-2008
M oving average -
Desmoothed AM R 6.76% (real) 17.3%
Negative with corp. and gov. bonds, lower than
10% for stocks and commodities Kraussl/Van Elsland
(2008) 1985-2007 2-step hedonic 7.3% 17.9%
Negative with commodities and hedge
funds, lower than 25% for other assets
1957-2007 3.97% (real) 19.05%
1982-2007 5.19% (real) 18.04%
Negative with S&P 500 and bonds, lower than
50% with Real Estate and commodities Richard Agnello
(2002) 1971-1996 Hedonic 4.2% 23.1%
M ei/M oses (2002) Repeat sales
Renneboog/Spaenjers
(2011) Hedonic
Chanel/Gérard-Varet/Ginsburgh (1994)
1962-1988 Hedonic n.a. n.a.
William Goetzmann
(1993) Repeat sales
54% with bonds, 78% with LSE since 1900 James Pesando (1993) 1977-1992 Repeat sales 19.9% (23.4% for Picasso p rints) 30% with stocks, -10% with bonds n.a. n.a. William Baumol
(1986) 1642-1961 Repeat sales n.a. n.a.
Robert Anderson (1974) 1780-1970 1780-1960 Repeat sales Hedonic