HAL Id: hal-01781691
https://hal.archives-ouvertes.fr/hal-01781691
Submitted on 2 Oct 2018HAL is a multi-disciplinary open access archive for the deposit and dissemination of sci-entific research documents, whether they are pub-lished or not. The documents may come from teaching and research institutions in France or
L’archive ouverte pluridisciplinaire HAL, est destinée au dépôt et à la diffusion de documents scientifiques de niveau recherche, publiés ou non, émanant des établissements d’enseignement et de recherche français ou étrangers, des laboratoires
Modelling solid solubilities in SC-CO2 and cosolvent :
development of enhanced density-based models
Martial Sauceau, Jean-jacques Letourneau, Dominique Richon, Jacques Fages
To cite this version:
Martial Sauceau, Jean-jacques Letourneau, Dominique Richon, Jacques Fages. Modelling solid solu-bilities in SC-CO2 and cosolvent : development of enhanced density-based models. 8th meeting on supercritical fluids: chemical reactivity ans material processing in supercritical fluids, ISASF Interna-tional Society for the Advancement of Supercritical Fluids, Apr 2002, Bordeaux, France. p.735-740. �hal-01781691�
DENSITY-BASED MODELS
Sauceau M. a, Letourneau J.-J.a, Richon D.b, Fages J.a
a LGPSD, École des Mines d’Albi-Carmaux, 81013 Albi, France b TEP/CENERG, École des Mines de Paris, 77305 Fontainebleau, France
E-mail: [email protected] - Fax: 33 5 63 49 30 25 The solubility of a solid of pharmaceutical interest in supercritical carbon dioxide, with or without cosolvent has been measured by means of a novel apparatus. This solubility data has been correlated by means of several density–based semi– empirical models, which have been extended and modified to be applicable to mixtures with cosolvent.
INTRODUCTION
Supercritical fluids (SCF) are widely used in a broad field of applications. The interest in using this technology is due to the special properties that are inherent to this class of fluid, including the ability to vary solvent density and to effect a change in solvent properties by changing either the pressure or temperature. For particle generation, processes like RESS (rapid expansion of a supercritical solution) or SAS (supercritical anti-solvent) allow obtaining fine and mono-dispersed powders in mild operating conditions.
Although carbon dioxide (CO2) is one of the most common gases used as a SCF, it does
have limitations. In particular, for most high molecular weight, non-volatile organic compounds, the solubility in SCF is low thus requiring high temperatures and pressures for substantial loadings. The accurate knowledge of this solubility is thus a key data for process choice and design.
However, the solubility of most pharmaceutical compounds is unknown. Thus, a novel apparatus based on an open circuit method [1] has been developed to carry out accurate measurements of the solubility in pure and mixed supercritical solvents. In previous papers, the solubility of a pharmaceutical compound was measured in pure supercritical CO2 [2], and
in CO2-cosolvent mixtures with ethanol and dimethylsulfoxide (DMSO) [3]. A low solubility
was found in pure supercritical CO2 (10-6 at 25 MPa and 318.15 K), which was greatly
enhanced using the two cosolvents studied (for instance, the solubility is multiplied by a factor of 10 with either CO2 + 6 % of ethanol or CO2 + 2 % of DMSO).
In this work, these experimental equilibrium solubilities are correlated by two different methods [4].
DATA CORRELATION
The two data correlation methods use density-based semi-empirical models. Indeed, modelling the solubility using the density as the independent variable does not require the physical properties of the solid, which are not available for complex solids.
The first model was proposed by Chrastil [5]. This may be considered as a macroscopic description of the surroundings of the molecules in the fluid phase. It is based on the
hypothesis that one molecule of a solute A associates with k molecules of a solvent B to form one molecule of a solvato-complex ABk in equilibrium with the system. The definition of the
equilibrium constant through thermodynamic considerations leads to the following expression for the solubility:
ln(C2) = k ln(ρf ) + α
T +β ( 1 )
where C2 is the concentration of the solute in the supercritical phase and ρf the density of the
fluid phase. k is the association number, α depends on the heat of solvatation and heat of vaporization of the solute and β depends on the molecular weights of the species. k , α and
β are adjusted to solubility experimental data.
The second model was developed by Ziger and Eckert [6], partly on the basis of the regular solution theory and the van der Waals equation of state (vdW EoS). In this treatment, the vdW EoS and mixing rules are used to evaluate the fugacity coefficient of the solute in the SCF phase in terms of solubility parameters of the solute and the solvent. The Hildebrand solubility parameter, δ , is an indicator of the strength of intermolecular forces present in a solute or solvent and is defined as the square root of the cohesive energy density :
δ = ΔH
V
− RT
v ( 2 )
The final expression for the semi-empirical correlation derived by Ziger and Eckert [6] is represented by the following equation:
log E = η ε2 Δ y1(2 -Δ y1) - log 1+ ( δ1 2 P ) ⎛ ⎝ ⎜ ⎞ ⎠ ⎟ ⎡ ⎣ ⎢ ⎤ ⎦ ⎥ +ν ( 3 ) where E = y2P P2sat , ε2 = δ2
( )
2v2L 2,3RT and Δ = δ1 δ2 ( 4 )with yi the equilibrium mole fraction of the compound i in the SCF phase, P the total
pressure, P2 sat
saturated vapour pressure of the solute, δi the solubility parameter of the
compound i, R the universal gas constant and v2
L the molar volume of the solute in liquid
state. E is the enhancement factor defined as the ratio between the observed equilibrium solubility and that predicted by the ideal gas law at the same temperature and pressure, ε2
represents a dimensionless energy parameter and Δ is the ratio of solubility parameters for solvent and solute. η and ν represent constants obtained by regression of the experimental data that are characteristics to each solvent and solute, respectively.
The correlation represented by Eq. ( 3 ) requires the estimation of the thermodynamic properties of pure components, for both the solvent and the solute. As noted by Giddings et al. according to the vdW theory [7], the solubility parameter of the pure SCF could be written as follows:
δ1=
(a1)1/ 2
ρ1
M1 ( 5 )
where M1 is the solvent molecular weight and a1 the energy parameter of the solvent in vdW
equation, calculated by : a1 =27 R 2T C 2 ( 6 )
Ziger and Eckert [6] treated the solid solute as a subcooled liquid and hence evaluated all the solute parameters after extrapolation of liquid properties from the melting point using a thermal coefficient. Gurdial et al. [8] suggested that thermodynamic properties could be estimated more readily from an atomic and group contribution method as proposed by Fedors [9]. This approach was adopted for the evaluation of the solubility parameter and molar volume of our solid, being treated as a subcooled liquid.
RESULTS AND DISCUSSION 1. Data in pure CO2
The two correlations were first applied to data in pure CO2. The solubility in pure CO2
of the solid used is very low and thus, the increase of density due to the presence of the solid is negligible [2]. As a consequence, the density of the saturated supercritical phase is taken to be equal to the density of pure carbon dioxide. This density is calculated by using the Peng-Robinson equation of state [10] (PR EoS).
To apply the Ziger and Eckert model requires knowledge of the saturated vapour pressure of the solute, P2
sat, for calculating the enhancement factor, E . As this pressure is
unknown for our solid, P2
sat is replaced by a Clausius-Clapeyron equation:
ln P2
sa t
= i − j
T ( 7 )
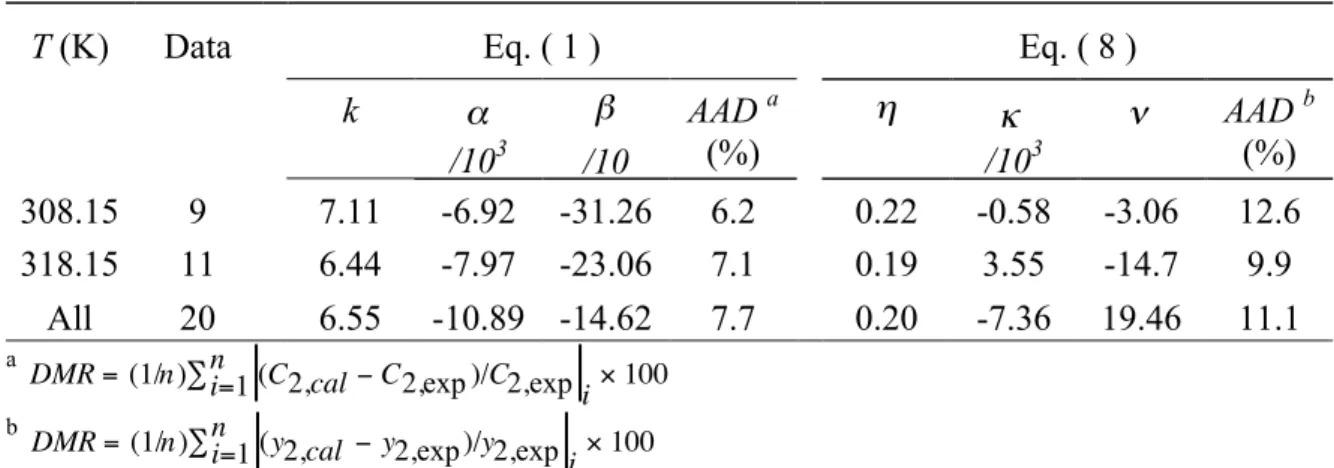
where i and j are two constants. A novel correlation with three adjustable parameters is thus obtained: log y2P = η ε2 Δ 1 − y2 (2 - Δ 1 − y2 ) - log 1+ (δ1 2 P ) ⎛ ⎝ ⎜ ⎞ ⎠ ⎟ ⎡ ⎣ ⎢ ⎤ ⎦ ⎥ + κT +ν ( 8 ) The results for the correlation of the data in pure CO2 with the Eqs. ( 1 ) and ( 8 ) are listed in
Table 1. The two isotherms are well fitted by this correlation, the average absolute deviation (AAD) being less than 13 % with however smaller values for Eq. ( 1 ) (lines 1 and 2). The k and η values obtained show a small temperature dependence. If the data of the two isotherms are gathered before parameter adjustment, the AAD remains practically constant (line 3). Finally, this provides two relations between C2, P, T and y2, P, T , with constant values of
k, α, β and η, κ, ν respectively, which can be used for prediction purposes in other experimental conditions.
T (K) Data Eq. ( 1 ) Eq. ( 8 )
k α /103 β /10 AAD a (%) η κ /103 ν AAD b (%) 308.15 9 7.11 -6.92 -31.26 6.2 0.22 -0.58 -3.06 12.6 318.15 11 6.44 -7.97 -23.06 7.1 0.19 3.55 -14.7 9.9 All 20 6.55 -10.89 -14.62 7.7 0.20 -7.36 19.46 11.1 a
DMR = (1/n) i=1(C2,cal − C2,exp )/C2,expi× 100 n
∑
b
DMR = (1/n) i=1(y2,cal − y2,exp)/y2,expi× 100 n
∑
2. Data in CO2 with cosolvents
Correlations require knowledge of supercritical mixture densities. For the mixtures involving a cosolvent, the density is calculated from the work of Kordikowski et al. [11] by using the PR EoS [10], with two quadratic mixing rules and two binary interaction parameters, kij and lij.
The Chrastil model is applicable to pure fluids. Thus, we could apply it to mixtures at constant cosolvent mole fractions, with the hypothesis that at constant concentration these mixtures behave like pure fluids. The results are listed in the Table 2. The data are well correlated with an AAD less than 6 %.
T (K) Cosolvent Data Eq. ( 1 )
k α /103 β AAD (%)a
318.15 K Ethanol: 5% 11 7.18 -28.92 -39.53 5.9
318.15 K DMSO: 2% 6 10.13 -7.24 -47.34 4.7
a
AAD = (1/n) i=1(C2,cal − C2,exp)/C2,exp i ×100
n
∑
Table 2: correlation with Eq. ( 1 ) for data at constant cosolvent mole fractions
However, the same treatment as in Chrastil’s model could be done, with the assumption that one molecule of a solute A associates with k1 molecules of a solvent B and k3 molecules
of a cosolvent C to form one molecule of a solvato-complex ABk1Ck3. Finally, it leads to the
following expression:
ln(C2) = (k1+ k3) ln(ρf) + α
T +β ( 9 )
k1, k3, α and β are adjusted to experimental solubility data. The values of k obtained in Table
2 are thus the number of molecules of solvent k1 and cosolvent k3 associated with one
molecule of solute. These numbers are higher than that in pure CO2 : 7.2 with 5 % of ethanol
and 10.1 with 2 % of DMSO instead of 6.5 in pure CO2. This confirms the importance of
specific interactions in the solubility enhancement phenomenon [3].
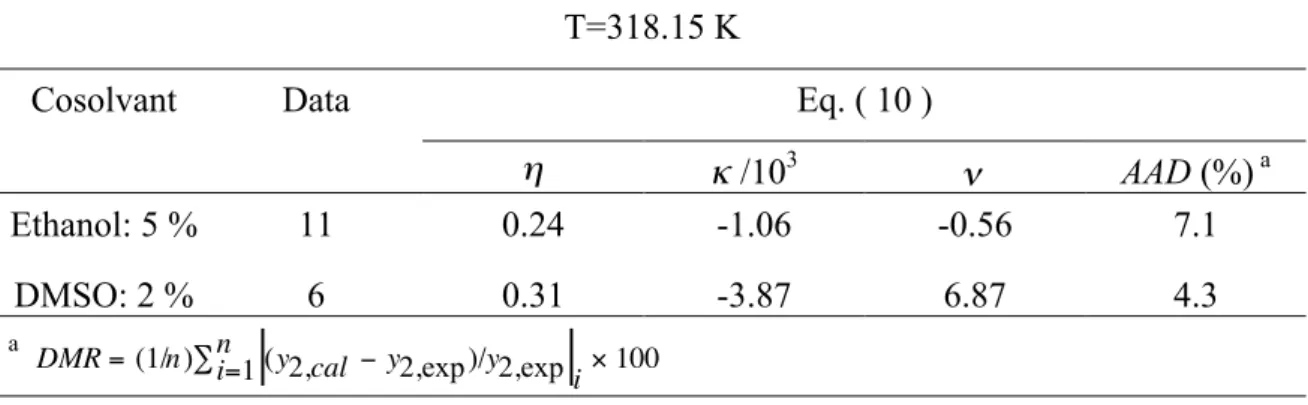
The eq. ( 8 ), issued from the model of Ziger and Eckert, is also modified to be applicable to cosolvent mixtures. The new expression is :
log y2P = η ε2 Δ 1 − y2 (2 - Δ 1− y2 ) - log 1 + (δm 2 P ) ⎛ ⎝ ⎜ ⎞ ⎠ ⎡ ⎣ ⎢ ⎤ ⎦ ⎥ + κ T +ν ( 10 ) with δm = (am)1/ 2 ρm y1M1 + y3M3 ( 11 )
where am is the energy parameter in vdW equation of the solvent-cosolvent mixture
calculated from pure component parameter by using a quadratic mixing rule :
am = yiyjaij
j
∑
i
kij is a binary interaction parameter, already used before. The results are listed in Table 3. A
good correlation is obtained with an AAD less than 7 %. The parameter η , characteristic of the solvent, is increased in presence of cosolvent: from 0.20 for pure CO2 to 0.24 with 5 % of
ethanol and to 0.31 with 2 % of DMSO. This confirms that the mixtures at constant concentration behave like a pure fluid, which is a better solvent than pure CO2.
T=318.15 K
Cosolvant Data Eq. ( 10 )
η κ /103 ν AAD (%) a
Ethanol: 5 % 11 0.24 -1.06 -0.56 7.1
DMSO: 2 % 6 0.31 -3.87 6.87 4.3
a
DMR = (1/n) i=1(y2,cal − y2,exp)/y2,expi× 100 n
∑
Table 3 : correlation with Eq. ( 10 ) for data at constant cosolvent mole fractions
CONCLUSION
Solubility data of a pharmaceutical solid have been correlated by means of two density– based semi–empirical models: the Chrastil model and the Ziger and Eckert model.
The Ziger and Eckert model has been modified to be applicable when the saturated vapour pressure of the solute is unknown. The application of the two correlations to the data in pure CO2 leads to expressions, which can be used for prediction purposes in other experimental
conditions.
In addition, the two models have been extended and modified to be applicable to mixtures with cosolvent. It shows the importance of specific interactions in the cosolvent effect.
NOMENCLATURE
a : energy parameter in vdW equation (Pa.m6.mol-2)
AAD : average absolute deviation C : concentration (kg.m-3)
E : solubility enhancement factor, defined in Eq. ( 4 ) k : association number (Chrastil model)
kij : binary interaction parameter
lij : binary interaction parameter
M : molecular weight (kg.mol-1)
P : pressure (MPa)
R : universal gas constant (J.mol-1.K-1)
T : temperature (K)
v : molar volume (cm3.mol-1)
Greek symbols
α, β : coefficients for Eqs. ( 1 ) and ( 9 ) δ : Hildebrand solubility parameter (Pa1/2)
Δ : ratio of solubility parameter, defined in Eq. ( 4 ) ΔHv : enthalpy of vaporization
ε2 : dimensionless energy parameter, defined in Eq. ( 4 )
η, κ, ν : coefficients for Eqs. ( 3 ), ( 8 ) and ( 10 ) ρ : density (kg.m-3)
Subscripts
1 : light solvent component (carbon dioxide) 2 : heavy solute component (solid)
3 : cosolvent c : critical point f : supercritical phase Superscripts
EoS : equation of state L : liquid
S : solid V : vapor
REFERENCES:
[1] Sauceau M., Fages J., Letourneau J.-J. and Richon D., Ind. Eng. Chem. Res., Vol. 39,
2000, p. 4609
[2] Sauceau M., Letourneau J.-J., Richon D. and Fages J., Proceedings of the 7th Meeting on Supercritical Fluids, Antibes/Juan-Les-Pins, France, 2000, p 959
[3] Sauceau M., Letourneau J.-J., Richon D. and Fages J., Proceedings of the AIChE Annual Meeting, Reno, United-States, 2001, CD-ROM
[4] Sauceau M., thèse de l’École des Mines de Paris, septembre 2001 [5] ChrastilJ., J. Phys. Chem., 86, 1982, p 3016
[6] Ziger D. and Eckert C., Ind. Eng. Chem. Process Des. Dev., 22, 1983, p 582 [7] Giddings C. J., Myers M. N. and King J. W., J. Chromatogr. Sci., 7, 1969, p 276 [8] Gurdial G. and Foster N., Ind. Eng. Chem. Res., 30, 1991, p 575
[9] Fedors R., Polym. Eng. Sci., 14, 1979, p 147
[10] PengD.-Y.and RobinsonD.,Ind. Eng. Chem. Fundam., 15, 1976, p 59
[11] Kordikowski A., Schenk A. P., Van Nielen R. M. and Peters C. J., J. Supercrit. Fluids, 8,