HAL Id: hal-01070417
https://hal-mines-paristech.archives-ouvertes.fr/hal-01070417
Submitted on 17 Nov 2014
HAL is a multi-disciplinary open access
archive for the deposit and dissemination of
sci-entific research documents, whether they are
pub-lished or not. The documents may come from
teaching and research institutions in France or
abroad, or from public or private research centers.
L’archive ouverte pluridisciplinaire HAL, est
destinée au dépôt et à la diffusion de documents
scientifiques de niveau recherche, publiés ou non,
émanant des établissements d’enseignement et de
recherche français ou étrangers, des laboratoires
publics ou privés.
Forecasting Innovation Pathways (FIP) for new and
emerging science and technologies
Douglas K. R. Robinson, Lu Huang, Yan Guo, Alan L. Porter
To cite this version:
Douglas K. R. Robinson, Lu Huang, Yan Guo, Alan L. Porter. Forecasting Innovation Pathways
(FIP) for new and emerging science and technologies. Technological Forecasting and Social Change,
Elsevier, 2013, 80, pp.267-285. �hal-01070417�
Forecasting Innovation Pathways (FIP) for new and
emerging science and technologies
Douglas K.R. Robinson
a,⁎
, Lu Huang
b, 1, Ying Guo
c, 2, Alan L. Porter
d, 3a
Post-Doctoral position, Centre for Management Sciences, Ecoles des Mines, Paris, France bSchool of Management and Economics, Beijing Institute of Technology, China cManagement Science and Engineering, Beijing Institute of Technology, China d
Director of R&D, Search Technology, Inc. USA
a r t i c l e i n f o
a b s t r a c t
Article history:
Received 1 November 2010 Received in revised form 21 May 2011 Accepted 1 June 2011
Available online 5 July 2011
“New” and “Emerging Science” and “Technologies” (“NESTs”) have tremendous innovation potential. However this must be weighed against enormous uncertainties caused by many unknowns. The authors of this paper offer a framework to analyze NESTs to help ascertain likely innovation pathways. We have devised a 10-step framework based on extensive Future-oriented Technology Analyses (“FTA”) experience, enriched by in-depth case analyses. In the paper, we describe our analytical activities in two case studies. The nanobiosensor experience is contrasted with that of deep brain stimulation in relative quantitative and qualitative emphases. We close the paper by reflecting on this systematic FTA framework for emerging science and technologies, for its intended goal, that is to support decision making.
© 2011 Elsevier Inc. All rights reserved.
Keywords:
New and emerging science and technologies Future-oriented technology analyses Technology forecasting Innovation pathways Nanotechnology Biosensors Brain implants 1. Introduction
In an age of strategic science and high-investment projects decision makers want to identify possible and promising directions and options for technology emergence in advance, to help choose the right path. New and emerging science and technologies, such as proteomics, bioelectronics or nanotechnologies, may impact many sectors with a variety of industrial structures. Regulation and policy instruments therefore need support systems to augment their targets— a variety of (and often shifting) industrial contexts. This emphasizes the requirement of relevant and timely strategic intelligence to enable effective decision making and strategy development.
For such a support system, FTA tools have to be well tailored to be able to capture the complex world of emerging technologyfields, at an early stage, and be robust enough to produce useful intelligence in real-time, often when data are heterogeneous and dispersed.4 Research and innovation activities for NESTs are embedded in uncertainties, promises, and, sometimes, concerns because:
• The technology is either new or rapidly evolving;
• Applications and markets range from the non-existent to relatively advanced; ⁎ Corresponding author. Tel.: +33 621716728.
E-mail addresses:douglas.robinson@teqnode.com(D.K.R. Robinson),lhuang127@gmail.com(L. Huang),violet7376@gmail.com(Y. Guo),
aporter@searchtech.com(A.L. Porter). 1
Tel.: + 86 13401183006. 2Tel.: + 86 13810027376.
3Tel.: + 1 404 384 6295; fax: + 1 770 263 0802. 4
When attempting to capture R&D at early stages of emergence, the analyst is often faced with a subject that has little or no history, few stabilized definitions of what thefield actually contains (or doesn't contain), and a difficulty to define community of actors involved either at the core or periphery of the field. 0040-1625/$– see front matter © 2011 Elsevier Inc. All rights reserved.
doi:10.1016/j.techfore.2011.06.004
Contents lists available atSciVerse ScienceDirect
• Knowledge is emerging in distributed pockets of research and development, often with no easily identifiable community; • A variety of objectives and visions proliferate; and
• The platform nature of many new technologies means that a variety of routes to diverse applications may be possible. Thus, FTA for NESTs requires adaptation of traditional technology forecasting methods. Furthermore, the variations within NEST technology management situations demand that FTA methodologies beflexible. For instance, in one case one may have time series data on technical parameters and market development; in other cases, this may not be so.
“Nano” (nanoscience and nanotechnology) includes a range of potential NESTs. In contrast with biotechnology or neuro-cognitive science, nano is not a domain with substantial coherence. It can be defined as being about everything interesting that happens at the molecular level. Nano is an umbrella term (continuing to exist because of the rhetorical and resource-mobilization force of the label), and under this umbrella there are domains with very different dynamics.
Unlike previous high-technology waves, nanotechnology covers diversefields of sciences and engineering, crosses boundaries between them, and aims to utilize the very fundamental characteristics of matter by manipulation and control at the nanoscale. As they cross many disciplines, also many industrial and technology chains, nanotechnologies are reshaping existing organizational arrangements. Nano R&D requires a large degree of integration, from convergence of research disciplines in newfields of inquiry, to new linkages among R&D labs, multinationals and start-ups, and a panoply of stakeholders.
Nanotechnologies, and other NESTs, have the potential to influence many value chains, create new ones, and will co-evolve with governance processes (markets, regulation, user practices etc.). Thefield is new; with limited history which complicates trend extrapolation, and there are relatively limited applications in the marketplace. In addition nanotechnologies can be novel themselves, or they can augment existing technologies, and even reinvigorate previously dormant technology developments.
Decision makers interested in developing targeted research and innovation policy, or industrial strategies for that matter, require support in capturing, sorting and distinguishing the actual developments in a particular technology or product application area from the plans and promises (including expectations) in circulation. Forecasting NEST innovation pathways poses a considerable challenge for FTA practitioners.
1.1. A tailored approach
For innovation to succeed in areas like nanotechnology, actor alignment from the research laboratory to product development and eventual application area is necessary. Alignment is easier to achieve where the technologyfield is well understood; the actors are known, with their relationships already functioning; and where regulation is largely unambiguous. This is the case with incremental innovation in established technological paradigms. For NESTs, such as micro/nanotechnologies where architectural (radical) innovations might occur, conditions of non-linearity and high technology and market uncertainty are typical[1–3].
Despite the high uncertainty, decision makers need to identify possible directions and promising options. Supporting them presents challenges for current strategic technology intelligence and forward-looking assessment tools.
A promising approach to do this, which is sensitive to the complexities of emergence of NESTs, is that of capturing and exploring multiple potential innovation pathways[4,5]. In our approach of Forecasting Innovation Pathways (“FIP”), indicators of developments in thefield of technology are ascertained and explored to identify path dependencies. Such pathways may be broad and tentative, but offer opportunities for insights into shared expectations[6], and emerging stabilizations in the technology development processes. These can be brought together to identify endogenous futures — because there are emerging irreversibilities in ongoing socio-technical developments, based on plans and other forms of shared agendas, mutual dependencies and network ties. Pathways from the present to the future are based on the dynamics of the present– this means there are “endogenous futures”[7]embedded in the present which can give indications and insights into the transition from present into future– even if capturing these indications is a formidable challenge.
Such an approach relies on awareness of the rapidly evolving nature of thefield and smart ways of capturing a large amount of data sufficient to ascertain the dynamics of emergence. A characteristic feature of NESTs is that data are often located in a variety of pockets, and are often heterogeneous in nature— a consequence of the NEST being at a nascent stage of development. Keeping this in mind, any FTA tailored for a NEST should combine empirical and expert information resources to capture indications of potential innovation pathways if it is to be effective.
2. Towards an FIP framework for NESTs
In order to create a framework for capturing indications of endogenous futures, we distinguish distinct aspects that help us formulate requirements for an FIP analytical system:
(1) How best to capture the NEST's development situation? Many existing FTA approaches focus on exploring future possibilities, neglecting to make sure that we understand key“forces and factors” of the current situation[8–10]. (2) How to build upon the current analyses to address the emergence and evolution of the field? Which dynamics are
important?— This has implications for point 1. What sorts of data and analyses are needed[11]for evaluating emerging fields of technology? — This has implications for the following point 3 as well.
(3) How best to evaluate the analyses described above? Most FTA approaches favor expert engagement, but identifying experts is a non-trivial task. In many cases, the types of actors to be engaged vary. Therefore there is a requirement to translate the analysis from point 2 into useful intelligence to feed into multi-actor engagement approaches.
(4) How do we translate the evaluations into concise, but still rich, reports for use by the target decision makers[12,13]?
These four points summarize many complex practical issues.
In their portfolio of activities, we have explored each of these four requirements, in different contexts and in projects that lean variously on some elements rather than others. We draw on these experiences, in particular two illustrative projects, toflesh out the FIP requirements. Our intent is to develop a framework that can both be used to put existing tools to work, and to identify weak spots in the current FTA toolset. Comparing notes from our various projects, we created the system inFig. 1.
The remainder of the paper willflesh out some potential tools in the context of two case studies that show contributions in different regions of the system. In thefirst case, investigating nanobiosensors, the analysis is richer in most steps in Stages 1 and 2 (Steps A, B, C, D, and E). In the second case, of deep brain stimulation technologies, the study provides insights for Stages 3 and 4 (Steps F, G, H, I and J).
Following the description of these“case vignettes,” we discuss a palette of tools that could be put to work in such a system. 2.1. The FIP framework
The FIP framework includes four stages: (1) Understand, (2) Profile and Link, (3) Project and Assess and (4) Report, and can be further divided into ten steps. It should be noted that Step J– Engage Experts – begins in the first stage and ideally would continue to occur throughout all stages, identifying and persuading knowledgeable technical and contextual (e.g., business, markets, policy) persons to assist in the process. Preferably on an ongoing basis, they help formulate data search processes, inform analyses, and interpret results over the course of the study. Such key informants are important if the process and eventual output of the FIP process is to remain close to real-time activities in thefield. Sometimes the FTA analysts are themselves highly conversant with the technology; that certainly facilitates FIP.
Stage 1 serves to understand a technology's level of maturation and the contextual dynamics that could affect its potential innovation pathways. There are different ways to characterize stages of technology development. For example, Technology Readiness Level (“TRL”)[14]is a measure which is used by some United States government agencies and many of the world's major companies (and agencies) to assess the maturity of evolving technologies. NESTs could be categorized by the status of technology itself and its application markets. As we know, technology and society are interrelated, and they co-evolve[15,16]. Various representations of such“systems” address the socio-technical interactions for emerging innovations[17,18]. In this paper, we use the Technology Delivery System (“TDS”) approach to reflect contextual dynamics because of its suitability for “emerging” technologies by distinguishing: 1) the enterprise to develop the innovation and take it to market, and 2) the key contextual factors affecting the success of that innovation process.
Stage 2 builds on empirical characterizations to profile R&D and link to potential applications. We search for R&D activity in suitable Science, Technology & Innovation (“ST&I”) databases, and profile the activity and actors from these data (Steps C and D). We then shift tofiguring out how technological characteristics link to functional advantages, applications, and potential users (Step E). There are many analytical tools to help profile R&D, including bibliometric analyses, social network analyses, and trend analyses. We can adopt or adapt them to facilitate our study as a function of the NEST state of development and the desired innovation indicators.
Stage 3 brings expertise to bear on the empirical results. Convening a workshop with multiple perspectives can anchor Step G explorations of possible futures. Step F digests the prior results to present those to the participating experts and stakeholders. Step H follows the workshop to assess the technology in two ways. First, we evaluate how the technology stacks up against alternative means to deliver comparable functionality. Second, we perform impact assessment to delineate the‘indirect, unintended, and delayed’ implications of the projected development elements, resulting products, and their life cycles.
Stage 4 consists of integration and communication. Step I synthesizes what has been revealed about alternative innovation pathways. It communicatesfindings to the target users. This may entail presenting the findings in multiple media forms (including interactive modes) and/or an additional diagnosis based on thefindings leading to the generation of recommendations. 3. Two illustrative cases
In the following we report on the two case vignettes. They will be described in terms of the stages shown inFig. 1, with differing emphases.
3.1. Case study 1: nanobiosensors
Biosensors have been in development for more than a half-century, but only in the last decade have commercial applications, augmented by a number of other enabling technologies, become available to any significant degree. To date, few biosensors based on nanomaterials are at an advanced stage of commercialization; meanwhile, anticipation of the potential of nanobiosensors is garnering great interest in three application domains: healthcare, environmental monitoring, and agrifoods. Of the three, healthcare is receiving the most interest from industrial actors. Nanobiosensors will also likely be involved in other potential markets— such as homeland security and defense.
J. Engage Experts Stage 1:
Understand
Objective:
Understand the NESTs & their TDS (Technology Delivery System)
- Technology description
- Key organizations & contextual forces characterization - Key Management of Technology (MOT)
Issues, Questions & Indicators to be addressed
Stage 2:
Profile & Link
Objective:
Profile R&D and link to potential applications
D. Profile innovation actors & activities
C. Profile R&D E. Determine potential
applications
- Profile of the R&D activities - Map of innovation activities - Listing of candidate applications
Stage 3:
Project & Assess
Objective:
Project and assess prospective innovation pathways
F. Layout alternative innovation pathways
G. Explore innovation components H. Technology assessment
- Depiction of promising NESTs Innovation Pathways - Identification of innovation leverage points
- Elucidation of desirable & undesirable facets mitigation options, if warranted
Stage 4:
REPORT
Objective:
Usable output for decision support
I. Synthesize & Report
- Report on the Innovation Pathways
- Elucidate possible policy & managerial action options
B. Model the Technology Delivery System (TDS) A. Characterize the nature
of the technology
Fig. 1. Framework to forecast NEST innovation pathways.
270 D.K.R. Robinson et al. / Technological Forecasting & Social Change 80 (2013) 267 – 285
Nanobiosensors constitute an area promising a vast array of potential applications, but high uncertainty on where (and if) they will enter the market, speculation on what sort of support they will need (including desirable governance modes). The ever increasing interest with regards to promising applications is mirrored in the world of research were we have seen a steep increase in research activity reported in the scientific peer-reviewed press.
For our aim of further developing the FIP framework, nanobiosensors offer an interesting case to capture and explore emerging innovation pathways. We highlight activities pertaining to the four stages described inSection2of our framework (Fig. 1).
3.1.1. Understand: understand the NEST and its TDS
In general, we could divide NESTs into two types according to the status of their applications: 1) emerging technologies where applications are still very speculative (no actual applications on the market); and 2) emerging technologies with some applications in the market.
Thefirst type of NEST shows research with minimal focus on applications — i.e., mainly fundamental, not applied. Data on potential applications can be captured in thisfield (seeBox 1) but speculations about applications are between Sci-Fi and Guiding vision[29]. The second NEST type includes R&D that begins to note applications that may not be well defined yet, or others with application areas that are well developed, but amenable to notable enhancement. Here, anticipation of potential applications lies between Guiding Vision and Proof in theBox 1classification scheme. Nanobiosensors would be located in this second type because there are some applications in thefield of healthcare and pharmacy already.5
To undertake the Technology Delivery System (TDS) analysis, we have operationalized two perspectives to model this complex system to realize the elements in the journey along the road from R&D toward commercial (or other) innovation [19]. “Push-to-Pull Enterprise Analyses” are used to identify the key players and their requirements to make prospective technological innovation occur.“Contextual Forces & Factors Analyses” uncover factors that will drive innovation in particular ways, including any barriers that could hinder particular developments.
Following this, in thefirst stage of the project, we identified which elements (actors, infrastructure and interactions) are necessary to“deliver” nanobiosensor applications to the market and for them to be taken up and be used in society. Modeling of the TDS[3], involves multiple perspectives, including identifying R&D activities, institutional involvements, major actors, and key markets. To anticipate the potential avenues of development within thefield of nanobiosensors, it is also essential to identify interactions among players and to explore potential supports and barriers in the environment.
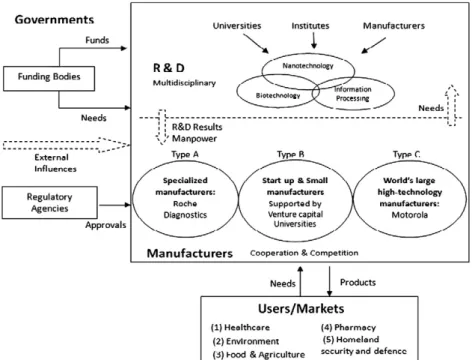
In devising a TDS model for this case, we emphasized the situation and institutions of the United States— a world leader in biosensor research. InFig. 2, through expert engagement and document analysis, we created afirst round socio-technical system composed of institutions directly or indirectly involved in the development of nanobiosensor technology. At the societal level, we categorized four key player types: Governments, R&D groups, Manufacturers, and Users.
The TDS includes the key actors. Various government entities are (or could be) involved in addressing social, political, and economic aspects related to this new technology. In relation to R&D funding, we observe two levels:
Federal agencies, which provide the major share of support— such as the National Science Foundation (NSF), Environmental Protection Agency (EPA), Department of Energy (DOE), and National Institutes of Health (NIH).
State agencies also contribute to R&D support with relatively smaller shares (e.g., constructing new nano research facilities at universities, including Georgia Tech).
Since nanobiosensor applications relate strongly to food and healthcare markets, relevant agencies are involved in regulating product development, like the CDC (Centers for Disease Control and Prevention), the USDA (U.S. Department of Agriculture), and, especially, the FDA (Food and Drug Administration). Examples of large funding organizations include the DOD (Department of Defense) and the DHS (Department of Homeland Security), which places an emphasis on early applications in detection for security. These agencies may provide a market as well— i.e., government purchasing could act as an initial client and in this way, provide an incentive for particular innovation pathways.
Research in the nanosciences and nanotechnologies is highly multidisciplinary; this is visible in nanobiosensor R&D groups whose activities entail the integration of material sciences, molecular engineering, chemistry, biotechnology, and electrical engineering. In addition to the academic and non-profit/governmental research effort, some of the major biosensor companies are engaged in R&D programs related to nano.
Manufacturers of nanobiosensors in the US can be divided into three groups: (1) specialized manufacturers, (2) start-up and small manufacturers, and (3) large national or multinational companies. In the current early stages of nanobiosensors, start-up companies are the most active in development, most of which are funded via venture capital and university spin-off support. An important characteristic for thefield of nanobiosensors is that their technological development and manufacture are strongly linked to universities.
Afirst step for us was to identify the important issues in the TDS which need to be ascertained to allow us to evaluate the field. Understanding the NEST developmental situation provides a general sense of the key actors, interests, and potential innovations. Such an understanding helps the analyst to specify the key technology management issues.Table 1offers a set of such issues from which to choose. It must be pointed out that these issues can vary widely, depending on the technology itself, its particular contextual situation, and the particular interests of the intended users of the FTA[20].
5For example a number of (relatively) simple nanobioarrays have been produced which follow on from the well embedded microbioarrays. As thefield moves closer to more complex, and multi-component nanobiosensors, the variety and scope of potential applications increases.
Based on the nanobiosensor development situation, we identify our case study's key Management of Technology (“MOT”) issues (Table 1) as:
I. Collaboration in technology development, and
K. Tracking and forecasting emerging or breakthrough technologies (opportunities and threats) These translate into target MOT questions to address for nanobiosensor innovation prospects: • What are the key nanotechnologies/nanomaterials?
• What are key technologies' competing functions? • Which countries are the research leaders? • Which organizations are the research champions?
• Which at the main academic and industrial connections for those organizations? • Which sub-topics are garnering the most attention and by whom?
• What are the most promising pathways for future commercialization?
Following this, we specify innovation indicators to address these MOT questions. Because nano-enhanced biosensors could improve existing biosensor applications, it's very important to identify their commercialization opportunities at this stage. In this Box 1
Classifying speculations on applications.
In a special issue on Nanotechnology in the Journal of Scientometrics, Robinson, Ruivenkamp and Rip[30]categorize the strength of statements made about nanotechnology applications in the world of R&D. They distinguish six categories to locate the forms of speculation, and the evolution over time. Such a taxonomy can disentangle the different forms of anticipatory coordination in afield of R&D through analysis of statements made by experts either in texts or in interviews. The six categories are: (1) Science Fiction (it may happen accepted as fantasy), (2) Visionary Statements (it may happen but accepted as a reality based fantasy), (3) Guiding Vision (it may happen and we include that in our repertoire of possible directions), (4) Expectations (it will happen), (5) Agendas (We are going to make it happen) and (6) Proof (it is proven and/ or demonstrated).
The spread or concentration of statements across this scale, and in certain communities, can help get a keener grasp on future-oriented statements and expectations for a target NEST.
Fig. 2. Nanobiosensor TDS for the USA.
way, we focus more on commercialization aspects, especially the connection between R&D and applications. The main indicators that were generated for this case study lead to the following requirements:
• Locate nanobiosensor research on the map of science
• Map collaborations, with a view to identifying pointers toward potential commercial development • Compare national R&D efforts, as an indication of commercialization strengths
• Develop a matrix of leading companies with topical research and patenting emphases • Cross-chart nanostructured materials with functions and potential applications
This provides the entrance point for digging deeper into thefield. 3.1.2. Profile and link: profile R&D and link to potential applications
Once these indicators have been articulated, the next step is the detailed profiling work – Stage 2 inFig. 1– “Profile and Link.” Stage 2 leads us toward three elements of FIP: Profile R&D, Profile innovation actors and activities, and Determine potential applications.
Here, we adapt existing analytical tools to facilitate our R&D study. At the same time, we have devised the process of “S&T-Function-Application Cross-Charting” to visualize the bridges across the gap between R&D and Applications. This is vital to understand how particular technologies might link to potential applications.
In our nanobiosensors case, we began with the assumption that“nano” could contribute to biosensors. After analyzing sets of R&D article abstracts and interacting with nanobiosensor researchers, we found it helpful to systematically array the attributes of the technology (here, the features that nano offers) in terms of functional advantages, and, in turn, how those functions could translate into enhanced applications.
In this study and in companion analyses of nano-enhanced solar cells[21], we have found value in:
(1) Subdividing the technical elements (e.g., distinguishing among various nanostructured materials);
(2) Engaging with those knowledgeable about the technology through the process of further specifying the set of important, and distinctive, functions;
(3) Exploring which functions pertain to particular applications (in some cases requiring partitioning functions and/or application sets);
(4) Considering links between applications and commercial opportunities (users, sectors, etc.).
Later in this section we explore the results of this stage of the project (Fig. 4). The main dataset in this case study comes from global nanotechnology research publications for the time period 2001 through 2008 (part year) extracted from the Science Citation Index (“SCI”), from which we have extracted 1400 records pertaining to nanobiosensors.
3.1.2.1. Exploring R&D multidisciplinary aspects. We applied science overlay mapping[22]to locate nanobiosensor R&D among the disciplines. This approach uses the Subject Categories that Web of Science assigns to journals. So, for a set of publications indexed by Web of Science (in this case, by the Science Citation Index, SCI, which is part of Web of Science), we locate this research via the journals in which it appears.Fig. 3overlays nanobiosensor research over a base map reflecting the 175 Subject Categories shown by the background intersecting arcs. The Subject Categories are grouped into“macro-disciplines” using Principal Components Analysis based on the degree of co-citation of the Subject Categories in a large sample of articles indexed by Web of Science. Those macro-disciplines become the labels in thefigure. The nanobiosensor research concentrations appear as nodes in the map, with larger nodes reflecting greater numbers of publications.
Fig. 3illustrates that global nanobiosensor research involves a very extensive range of researchfields. It is concentrated in the Materials Science and Chemistry macro-disciplines, also involving a number of Biomedical Sciences and various otherfields. This analysis helps understand the S&Tfields involved, to help identify technical experts.
Table 1
Technology management issues and concerns (Source: Tech Mining[21]). R&D portfolio selection
R&D project initiation Engineering project initiation New product development New market development Mergers
Acquisitions of intellectual property (“IP”) Exploiting one's own intellectual assets Collaboration in technology development Identifying and assessing competing organizations
Tracking and forecasting emerging or breakthrough technologies (opportunities and threats)
Strategic technology planning Technology roadmapping
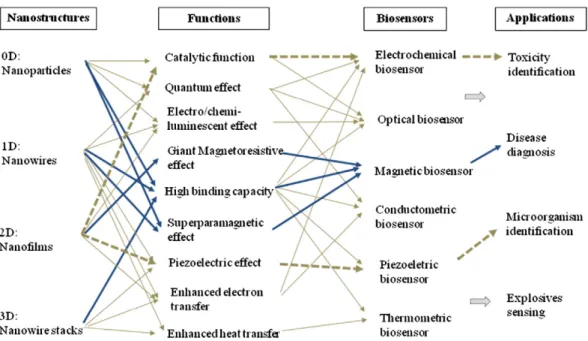
3.1.2.2. Exploring R&D to application connections. A general“cross-chart” from fundamental nanotechnology to market applications (Fig. 4) reveals vital links among nanostructured materials, biosensors, and applications. It also explores the underlying functions of how nanomaterials can enhance biosensors, which can help future innovation path mapping.
Fig. 4. General nanobiosensor technology— application cross-chart.
Cognitive Sci Computer Sci Geosciences Agri Sci Ecol Sci Chemistry Physics Engr Sci Mtls Sci Infectious Diseases Clinical Med Health Sci
Env Sci & Tech
Biomed Sci.
Fig. 3. Locating worldwide nanobiosensor research over a base map of science (Database: SCI). 274 D.K.R. Robinson et al. / Technological Forecasting & Social Change 80 (2013) 267–285
In generatingFig. 4, we sought to identify the added value of nanostructured materials for biosensors (“nanobiosensors”). Structures at the nanoscale can provide advantages over the same material used at a coarser scale.6Cross-charting helps elucidate
how particular nanostructures7enable functionalities that can enhance particular applications.
Nanostructured materials can contribute to the biorecognition element, the transducer of a biosensor, or both. The functions of nanomaterials used in biorecognition can be divided into two classes. Thefirst class is referred to as “target labeling” using “0D” (zero-dimensional) or “1D” (one-dimensional) nanostructured materials (e.g., semiconductor nanoparticles). For this nanobiosensing system, nanostructures arefixed to the biomolecules (or species) that are to be sensed.
The second class of nanomaterial functions used in biorecognition is mainly in the form of replacing the traditional molecular recognition layers. This takes the form of 2D or 3D structures (or constructs) upon which a biomolecule will interact (think of a liquidflowing across a plate, or through a sieve — the nanobiosensing elements will be fixed to the plate or sieve and detect the biomolecules in the liquid).
These are two broad generalizations of the two classes of biosensor and you can imagine that with the variety of nanoscale constructs and functionalities of nanoparticles and quantum dots, plus a variety of materials, the field of nanobiosensors is inherently diverse and could potentially enable many applications in a variety of sectors.
In the cross-chart analysis, the left-hand-side allows us to see if certain nanostructures contribute to particular functions that are essential for specific applications. Conversely it can also show where there are gaps in solutions (or R&D) for a particular biosensor application.8
For instance, the use of 3D nanostructures might only be applied to a limited subset of functions that contribute to only one or two types of biosensors. The next steps could then key in on the organizations focusing on that cluster of innovation pathway. Results do not localize neatly (Fig. 4) but do give an indication of the clusters of innovation pathways that are under development, and can help direct the next steps of the FIP framework.
Note also that several types of nanostructures are more suited to providing particular functions over others. For example, if we wanted to“zoom in” on one type of biosensor (e.g., thermal),Fig. 4would orient us toward particular gains (e.g., patents pertaining to enhanced heat transfer or binding capacity). We highlight with thicker arrows inFig. 4the cluster of paths that lead to a particular biosensor (magnetic biosensor) and the most promising application (i.e., that which is most touted in the literature and from our interviews).
Another way is to look at a specific nanostructured material. The dotted arrows trace two pathways that are part of the cluster of activities that stems from thin films. One pathway leads to electrochemical sensors[30–32]. The potential advantage of such nanoparticles dispersed through polymer films as an electrochemical nanobiosensor is that the distribution (as well as the nanoparticle size and type) can be controlled based on the type and processing of the polymer matrix. These dispersions in thinfilms provide conductivity improvements by orders of magnitude (excellent for detecting minute traces of toxic substances).
Another pathway indicated links thinfilms to piezo-electronic sensors. Thin films offer unique advantages for piezo-electric sensors, overcoming some of the technical barriers to providing this functionality (such as creating the desired structures, and at a relatively low cost)[33]. Applications of this technology include detection of microorganisms such as Salmonella, Escherichia Coli, and Staphylococcus aureus.
The cross-chart is a useful representation, as it allows the analyst to move back from an application to potential nanostructures, or vice versa. Or, one could start from the middle, focusing on a particular nanobiosensor (such as optical biosensing) to explore downstream toward applications and, then, market segments; and/or upstream, toward key contributing research topics. Cross-charting can also help spotlight a particular community of research and industrial actors.
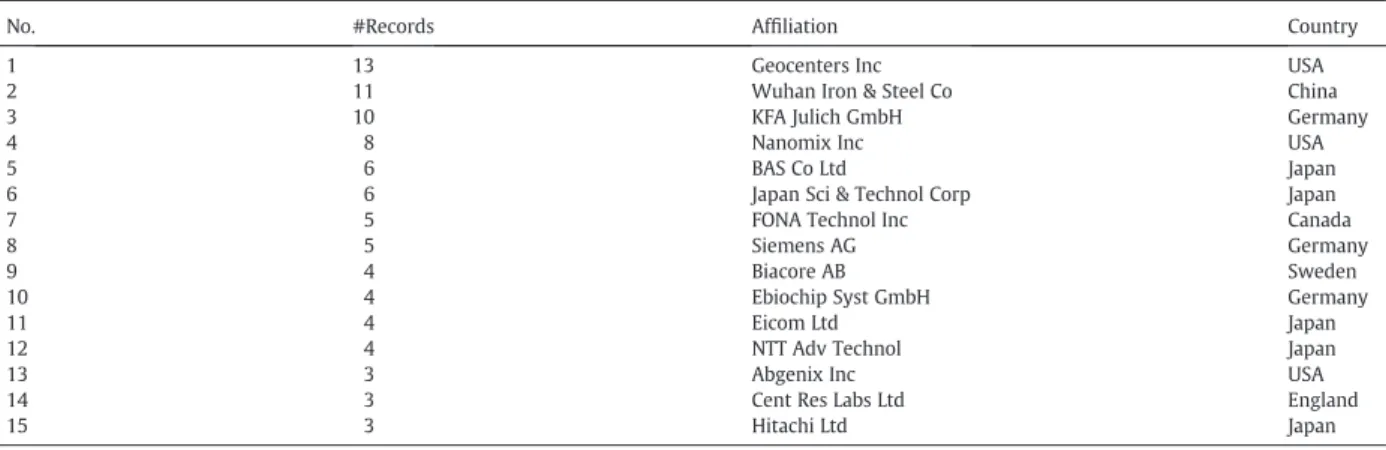
3.1.2.3. Exploring commercialization of nanobiosensors. To explore the nanobiosensor commercialization prospects, a list of the leading corporations around the world is provided inTable 2(based on research publications, as indexed in SCI). From this table, we can see the countries with active industry involvement include the USA, China, Germany, Japan, Canada, and Sweden. Although the no. 1 company in the list is American, we conclude that industrial R&D on nanobiosensors is led by Japanese companies, with 5 companies in the top 15. Therefore we use Japan as our initial focus to explore leading edge commercialization.
3.1.2.4. Capturing early signals of intent to commercialize. The map inFig. 5explores co-authoring among the top corporations and other R&D organizations in Japan. This can help answer a number of important questions: Are there networks among the key nanobiosensor research groups? How are the industry players networking with other R&D organizations? What are such networks emphasizing? Some observations:
(1) A relatively large number of Japanese corporations are publishing on nanobiosensor research;
(2) We can observe notable cooperation between industry–industry and industry–academic organizations within Japan; (3) Academic organizations provide the core of these research networks, connecting several corporations (as circled in red inFig. 5);
6
Nanoscale structures are similar in size to the biomolecules that are to be sensed. Biomolecules can range from 10s to 100s of nanometers and it is this advantage, creating structures that have the same resolution as the study object, which makes nanotechnology so promising for biosensors. Developments in nanobiosensing are already unveiling information about the interactions of biomolecules with other complex biomolecules, such as enzymes and other proteins, antibodies, DNA, RNA, and larger biological species such as organelles or cells.
7A variable that, through our earlier analytical steps, we found to be one of the key characteristics which determine a variety of biosensor functionalities. 8This is dependent on the goal of the exercise. The theme of this project was to locate which nanostructures are being researched and how they connect to biosensing applications. A next step could be to identify the gaps in the cross-chart (i.e. linkages/arrows that are not being explored).
Fig. 5. Cooperation between companies and other organizations in Japanese nanobiosensor research (Database: SCI). Table 2
Top 15 nanobiosensor corporations in the world (Database SCI).
No. #Records Affiliation Country
1 13 Geocenters Inc USA
2 11 Wuhan Iron & Steel Co China
3 10 KFA Julich GmbH Germany
4 8 Nanomix Inc USA
5 6 BAS Co Ltd Japan
6 6 Japan Sci & Technol Corp Japan
7 5 FONA Technol Inc Canada
8 5 Siemens AG Germany
9 4 Biacore AB Sweden
10 4 Ebiochip Syst GmbH Germany
11 4 Eicom Ltd Japan
12 4 NTT Adv Technol Japan
13 3 Abgenix Inc USA
14 3 Cent Res Labs Ltd England
15 3 Hitachi Ltd Japan
(4) The key academic organizations that are engaged with industry include: Keio University, Kyushu University, University of Tokyo, National Institute of Advanced Industrial Science & Technology, Tokyo University of Technology, and University of Tsukuba. In addition, we also investigated more deeply to find what these networks are doing through text analysis of their co-authored papers.
(1) The network around Keio University: has a focus on the enhancement of biosensor sensitivity via improving catalytic ability of nanoparticles in electrochemical sensing[23];
(2) The network around Kyushu University: has a focus on the enhancement of biosensor sensitivity via using magneticfields of magnetic nanoparticles[24];
(3) The network around the University of Tokyo: focus on the enhancement of SPR biosensor sensitivity and stability via using thinfilm and SAM (a 2D nanostructure)[25];
(4) The network around the National Institute of Advanced Industrial Science & Technology: focus on the enhancement of biosensor sensitivity via taking advantage of the biocompatibility of polymer nanoparticles in mass/piezoelectric sensing[26].
3.1.3. Project and assess prospective innovation pathways
This stage was conducted in two rounds. Thefirst round involved face-to-face interviews with researchers at Georgia Institute of Technology (US), which provided input to allow afirst evaluation of our analyses. The second round entailed a campus workshop (~10 participants including ~5 with particular knowledge in nanomaterials, biomolecular engineering, and biosensing). This focused on mapping likely innovation avenues, following the process described and demonstrated by Robinson and Propp[4]. We then called upon our experts again to review our interpretations from the workshop. In the future, we should engage persons knowledgeable in broader innovation aspects, including production, regulation, marketing, and use.
3.1.4. Report: usable output for decision support
Based on these analyses and inputs from the workshop in Stage 3, we constructed two potential innovation avenues. Here we refer to the two approaches as FIP-1 and FIP-2.
FIP-1 is based on the roles of nanostructured materials in biosensors. Two different innovation avenues identified are: Pathway 1. Enhancing biorecognition/bioconjugation using nanostructured materials in biosensors. In general, this path uses nanomaterials passively, that is it focuses on surface properties, such as surface to volume ratio, surface affinity, and selectivity to biomolecules and cells.
Pathway 2. Enhancing signal transduction or creating new transduction mechanisms using nanomaterials in biosensors. In general, this pathway seeks to utilize nanomaterials, in a more active way, taking advantage of unique properties of materials with nanoscale dimensions, such as quantum effects, piezoelectric effect, etc.
FIP-2 is based on differences in the sensing target. Here, we identify three different paths taking advantage of nanomaterial enhancements:
• Pathway 1: cell-based sensing
• Pathway 2: sensing macromolecules, such as proteins and DNA • Pathway 3: sensing small chemical molecules such as Fe, O2, etc.
The 1st of these focuses on sensing the behaviors of whole cells without knowing detailed information about the sub-cellular matrix, organelles and metabolic pathways. The 2nd path senses by probing biomolecular interactions, either on the cell membranes or inside the cell bodies themselves. The 3rd path emphasizes the presence and concentration level of biologically relevant chemical substances. All three innovation pathways may use nanomaterials either passively or actively.
At the time of writing we are still developing these potential Innovation Pathways. Such charts and maps should address specific key nanomaterials or nanotechnologies, and the particular obstacles, along every path. We didn't explore Stage 4 to the full extent in this case study. Further innovation pathway development should be tailored to meet particular technology management interests.
To gain insights for the latter stages of the FIP framework, the following case vignette describes a different NEST FIP situation, and places more emphasis on describing these latter stages.
3.2. Case study 2: deep brain interface devices
In this project, the objective was not to capture a wholefield, but to explore the potential technological paths that a particular research institution could/should take in relation to its nascent nanotechnology-bioelectronics research program. The organization had a broad idea of what the next 10 years of technical research in nanotechnology/bio-electronics may look like but also articulated its wish to further explore new areas, such as interfacing with brain functioning. In addition, as part of its strategic research drive, it wished to explore medical applications at an early stage and use this to help guide R&D. The key question was, therefore, how to enhance current interfacing of technology with brain functions (including one-way stimulation approaches) through targeting the institute's research in nanotechnology and bioelectronics.9
With this in mind, a key element was to forecast potential innovation pathways to evaluate the ways that the technology could co-evolve with regulation, markets, patients' perspectives and demands, clinical practice, etc.— in order to identify suitable strategies. In the following we track through case highlights with respect to the four stages of our FIP framework (Fig. 1).
3.2.1. Understand: understand the NEST and its TDS
The trigger for this project came from a research group leader about to embark on creating a portfolio of application-oriented research projects with the broad (and as yet unarticulated) vision of the research program leading to a closed-loop-implant system for the brain.10The researchers realized that as a micro/nanoelectronics center wishing to develop technologies for
interfacing with the brain, they would need support in exploring the potential innovation pathways that could be pursued. Consequently, they wished to speculate in a controlled way on the possible pathways that would (a) deliver innovative technologies (in-line with their institute objectives), (b) be optimized for uptake in healthcare practices, and (c) would be in line with the EU Nano Action Plan (“responsible innovation” was a key driver in this group).
Theirfirst idea was to target their R&D agenda to improve current capabilities in stimulating the brain, and to target their activities in the area of deep-brain stimulation (“DBS”) for physical and psychological disorders. The next steps would create a smart self-managing implant. DBS– currently a niche technology – is seen by many to be on the verge of wider application, leading to an external interest from neurosurgeons, medical device manufacturers and regulators— and hence was a great opportunity for FIP methodology development.
At the time of this FIP project, DBS (a 4-point electrode with stimulating signalfixed during direct physical access to the brain after removal of skull cap) was under clinical investigation for a broad selection of neurological and psychiatric conditions, such as epilepsy, dystonia, Tourette's syndrome, depression, obsessive–compulsive disorder, and cluster headache.
Although knowledge of the mechanism of action of DBS is limited, developments to improve and refine the stimulation process are underway, augmented by technological advances infields such as micro- and nano-fabrication, imaging, and improvement of stereotactic methods, to name but a few lines of investigation. Still a niche technology, with applications to patients who have no alternative therapy, the promise of DBS has prompted industrial development in Parkinson's (Medtronic), epilepsy (Medtronic and Neuropace), and in other disorders too.
The situation for the R&D group wishing to create a 10-year plan translated into a 1st round multi-path perspective shown in
Fig. 6(created together in early interviews prior to the commencement of the project). Located at the bottom of the Y-axis, the research institute wished to place on their research agenda new technology development that would link up with innovation
9
This FIP exercise was organized as part of a constructive technology assessment project within a European R&D network for nanotechnology for the life sciences. Constructive Technology Assessment (“Constructive TA”) is a support tool for reflexive co-evolution of technology and society which takes as its starting point ongoing and evolving socio-technical dynamics and those emerging irreversibilities that crystallize out in the evolution of NESTs.
10
Closed-loop means that the system stimulates the brain, records the changes in brain functioning and adapts further electronic stimulations through real-time analysis of the data (without human intervention). Open-loop systems mean there is no reactivity of the device, i.e. the electronic pulse rate and level of electro-stimulation remains constant. Open-loop systems are the current stat-of-the-art, where the pulse rate isfixed during the actual operation of implanting the electro-stimulation device into the brain.
pathways in the area. Thus they needed to get a handle on the situation at all stages of development (up the Y-axis) and speculate how these would evolve over the next 10–15 years. This initiated the FIP exercise.
The mapping activity looks for strong and weak signals as indicators of patterns and directions in the emergingfield and is broken down into three steps. Step 1 is the mapping of the network of actors and linkages among them. Step 2 involves the exploration of anticipatory expectations that shape the strategies and action of these potential stakeholders[5]. Such analysis of expectations (seeBox 1earlier) can provide strategic intelligence on weak signals of emerging paths and trends. Step 3 involves finding indication of emerging structures, path dependencies and other entanglements which are shaping the activities in the field
[1]. These emerging entanglements, path dependencies and forceful expectations add up to endogenous futures.
All three of these are important to map possible innovation pathways and understand the various dynamics at play. The socio-technical mapping helps describe the landscape of actors and other key elements in the field, the relationships and dynamics.
In interviews (and in their strategic agendas) we observed that technology developers projected futures and worked with them to guide their design and experimentation activities. They articulated requirements based on this vision of the future and set out milestones (or in large projects, create roadmaps) to guide the design, development and optimization.
Even though, in actual practice, technology developers (especially those designing, developing and optimizing) observe that the path to innovation is far from linear with many twists, turns and setbacks, they still use a linear, chain-like model: • To project paths to follow
• To draw boundaries on requirements to be fulfilled, based on the vision of applications and expectations on others involved in the development process, their roles and responsibilities.
To capture the non-linearity of innovation processes, the metaphor of the‘innovation journey’ has been used to reveal the complex twists in the emergence of a new product[27]. The innovation journey idea of Van de Ven, which has been picked up elsewhere in technology management circles, is a way of re-framing notions and premises of innovation dynamics— innovation is non-linear and characterized by learning processes of actors about artifacts and actants.
A schematic innovation journey was put forth by Voss[28]to highlight key elements, (multiple) origins, coupling, forks, shifts, setbacks (up to halting the journey), and projections. This diagram is quite useful but it also makes clear a tension for FIP. From an observational standpoint we have recognized that innovation is de facto recursive learning, but from a management point of view, it needs to be managed efficiently. How to reconcile?
Thefirst step is to embrace these complexities with a deeper understanding of innovation journeys, and the endogenous futures that become more visible as the journey progresses. The second step is to identify loci for influencing the dynamics of innovation emergence. These have been core research lines in thefield of constructive technology assessment.11
For this FIP project, the idea was to capture the complex activities and dynamics in the evolvingfield of deep brain stimulation, to explore them with relevant experts, and to translate thesefindings back into the perspective of the technology developers, who in their everyday practice rely on roadmaps and linear projections.12
We developed the innovation chain (“IC”) as an FIP tool to start a process of broadening the linear model to a chain of arenas of development of the technology (note actors are not placed in this diagram; it is a matter of activities). Thefinal IC result can be seen in
Fig. 7.
(1) The IC brushes over the actual details of the technology development process of DBS in that it does not show the differences among existing or emerging platforms or solutions. For example, there is no distinction between open- and closed-loop systems (while there is a distinction in terms of the exploitation paths of integrated devices: i.e., going quickly for niche applications, or focusing on generic devices). Thus another style chart is necessary as an output of the FIP exercise. The TDS is here transformed into a chain of innovation steps, arenas of action that will shape the development of the technology.
(2) The IC is also autonomous with regard to time. Progress at research level can, over time, lead to completely new prospects of technological exploitation; hence the chains of the IC diagram could relate to fundamentally different kinds of activities. What the IC diagram allows is quick identification of R&D and product introduction challenges within the broader context of economic (competition), societal, ethical and consumer, and expectations-related issues.
By this stage we have identified the main actors, the arenas of activity and the mechanisms of assessment of our target audience (technology developers trying to identify a more robust roadmapping style agenda). The next step was to dig deeper into this data to identify the endogenous futures and innovation journey dynamics, and translate this into something that can be explored and evaluated by experts in thefield (in the move towards a final usable output).
3.2.2. Profile and link: profile R&D and link to potential applications
The next step was to translate the previousfindings into material that could be evaluated by relevant (potential) stakeholders. We chose the approach of socio-technical scenarios as a means of synthesizing and presenting the data gathered from stage 1 of the FIP approach.
Socio-technical scenarios combine a large number of elements and dynamics relating to potential innovation chains. These translate endogenous futures into scenarios which not only take actors' initiatives and interactions into account, but also the
11This has also been extended through a form of constructive technology assessment known as Strategic Niche Management (SNM). 12
Fig. 7. The DBS innovation chain populated with key issues drawn from workshop.
surrounding or ensuing dynamics and shifts in agendas that slowly become irreversible. Scenarios are not used here to extrapolate particular developments into the future. Rather, they provide insights into how plausible futures may unfold from the present, constructed in narratives that reflect innovation journeys, they can present a complex story of the interplay of actor strategies, technologies and infrastructures and other socio-technical linkages (and how they become stabilized over time).
The function is to present a collection of“playings out” of plausible, non-mutually exclusive innovation journeys to capture complexities revealed by the in-depth analysis of the state-of-emergence, and so allowing a platform on which the interactive workshop can build. The scenarios are structured around social studies of science and technology (notably STS and innovation studies) and provide an opportunity for the workshop organizer to present dilemmas, choices to be made (in the form of forks), and actions. One can also bring in elements from other cases as plausible contributors to the emerging innovation journeys described.
3.2.3. Project and assess: project and assess prospective innovation pathways
Workshops are key for bringing together knowledge from the above analysis with the experience and expertise of multiple stakeholders. In addition they provide an opportunity for stakeholders to “probe each other's world perspectives,” share knowledge, and collectively create new knowledge.
The DBS workshopfirst focused on discussing the technology options, the scenarios, and elements that would shape potential innovation pathways. This led to identification of the key elements and issues. We also explored actor strategies (beginning with scenario characters and moving to those in the real world). For DBS, we co-located large and small medical device manufacturers, researchers and experimental neurosurgeons with the aim of exploring the various potential innovation journeys from laboratory to wider clinical practice in motor and psychiatric disorders (such as Parkinson's, epilepsy and obsessive compulsive disorder).
One key aspect is the diversity of the participants. Recalling the Innovation Chain, we made sure that each arena of activity in the innovation chain was covered in the participant lists. In this way a combination of scenarios, expert knowledge, and the gained through thefirst stage of the FIP process could be combined and fed into deliverables.
3.2.4. Report: usable output for decision support
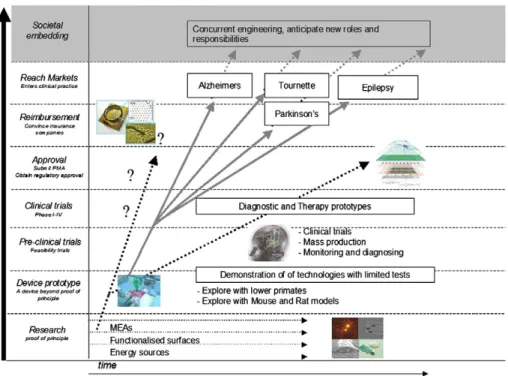
In the workshop we discussed the major challenges faced by key actors along the innovation chain. To identify the key factors that would shape development processes in thisfield of technology, the innovation chain diagram was used to locate some key issues (seeFig. 7). On the diagram, you can locate various stakeholder groups that will dominate that area of the innovation chain and will be able to shape it most strongly. The participants in the workshop reflected this — experimental (innovation driven) neurosurgeons, device manufacturers, techno start-ups and researchers. For this workshop thefindings were translated into the innovation chain diagram and a similar depiction, but including development details and a time aspect. For the latter, a number of successive innovation avenues (generations) that in the workshop were deemed necessary in the move towards advanced, closed loop, deep brain interface devices, are shown inFig. 8.
Figs. 7 and 8represent an important output for the project. The results of this FIP exercise have been drawn upon in the agenda-setting activity of the group, who has now, at the time of writing, developed their 10 year R&D plan.
Through this FIP process, for DBS we have identified the many players and explored indicators of plausible futures. We translated this information into scenarios. These scenarios were used to explore potential playing out of the development of DBS and thus allowed identification of the key dynamics, challenges and opportunities in near and mid-term futures. Such scenarios show various actor positions and strategies, and allow discussions (especially in sensitive areas). In this case, the large and smallfirms involved in the exercise could not discuss their own company strategies but could evaluate and respond to characters in the scenarios.
As an output, a usable form of intelligence for the actors was created, potential innovation avenues amidst a landscape of challenges, opportunities, etc. In addition the innovation chain diagram revealed issues for particular arenas of development that are crucial for the creation of an advanced DBS value chain. The two diagrams provide support for alignment of actors involved in the Technology Delivery System.
4. Wrapping and opening up
In our two case studies, we operationalize tools developed in house for a number of steps in an FTA process emphasizing future innovation pathways for NESTs. What we see is commonality in the steps, even though the projects were initiated in different contexts. The partitioning of assessment steps, from the menu of tools that may be applied, constitutes a system for tailoring the FTA to the innovation context— leading to a flexible approach. Such a flexible approach is absolutely necessary for NESTs, where more often than not, the forms of data that are possible to obtain will differ greatly. In addition the scope of the FTA may differ, for example in this paper, we explore nanobiosensor developments at a national/international level, and thus have a macro-level perspective on the Technology Delivery System. In the deep brain stimulation case, we explore the socio-technical system evolving around DBS technology, but focus in on the micro-level of an R&D group's technology strategy considering innovation value chains.
Of key interest to the authors is productive combination of qualitative and quantitative tools in the Profile, Project and Assess steps of the approach. For the DBS case, qualitative tools were emphasized, requiring the FTA actor to spend a significant amount of time in thefield to gather the relevant indicators for constructing a socio-technical map and innovation chain. The richness of the data is unquestionable, but labor-intensive.13However for broader application of an FIP approach, other tools would be advantageous. The
13For research purposes such deep qualitative investigations are worth the investment. In this case, it was part of PhD research into the co-evolution of nanotechnology and society.
Fig. 8. Simplified chart showing the main DBS innovation pathways with key issues and opportunities along these pathways. 282 D.K.R. Robinson et al. / Technological Forecasting & Social Change 80 (2013) 267 – 285
FIP frameworks and candidate tools.
Step Analyses Candidate tools
State-of-emergence Step A: characterize the technology's nature ●Describe the technology and what it does Technology readiness levels
●Technology development stage analyses
Step B: model the TDS ●Contextual forces and factors analyses Socio-technical mapping
●Push-to-pull enterprise analyses Techno-economic networks
Fleshing out potentials Step C: profile R&D ●Bibliometric analyses Tech mining
●Top actors and topic analyses Publication analyses
●R&D disciplinary analyses Patent analyses
Social network analyses Trend analyses
Step D: profile innovation actors and activities ●Enterprise cooperation analyses Cross charting matrix
Step E: determine potential applications ●Competing technologies analysis Data mining on co-authoring among top corporations
●Competitor, risk and market analyses Platform profiling
●Commercialization pathway exploration and assessment ●Refined, specific opportunities analysis
Projecting and assessing futures Step F: layout alternative innovation pathways ●Consolidate Intelligence from Steps A–F Multi Path Mapping (1st round) ●Analysts nominate promising innovation paths (IPs) and contingencies Scenarios
Visualizations like TDS/Innovation Chain
Step G: explore innovation components ●Analyze IPs within key selection Interviews with multiple experts
Step H: technology assessment ●“Winning” potential innovation pathways impact assessment Multi-path mapping (2nd round based on Step G) ●Alternative technologies comparative impact assessment Innovation chain (2nd round)
Technology comparison matrix
Reporting Step I: synthesize and report ●Iterative review Papers
●Communicate findings (use multiple media; interactive as possible) Standard reports
Supporting Step J: engage experts ●Support to the analyses from Step A to Step I Interviews
Questionnaires Workshops Co-author papers 283 D.K.R. Robinson et al. / Tech nological Forecasting & Social Change 80 (2013) 267 – 285
nanobiosensor project shows some of the tools that can be applied, capturing the global data on nanobiosensor development and finding indications of applications, indications of the intent to commercialize, etc. The scenarios, workshops and charts (the multipath maps, innovation chain diagrams etc.) of the DBS enabled focusing on particularly relevant issues in the emergingfield.
To truly address strategy-relevant intelligence, a systematic framework for capturing and exploring potential innovation pathways for NESTs is necessary. As we have outlined, we see that tools for smart capture of information,fleshing out the model of the Technology Delivery System, identifyingfirst round potential innovation pathways, and then zooming into these through augmented expert engagement exercises is an effective approach. In this paper, we have done this by drawing on a variety of tools and approaches that have been emerging in Europe and the United States based around the concept of FTA and potential innovation pathways as a means of forecasting and assessing the emergence of nanotechnologies.
Drawing on insights and lessons learned from the two case examples of nanobiosensors and nano-enabled deep-brain interface devices (and more broadly in recent FTA work on NESTs), we have further articulated vital steps in a systematic forecasting framework focused on identifying potential innovation pathways.Table 3outlines candidate tools that could be selected for application to each step of our integrated FTA process. These analysis steps and related tools could help anticipate future innovation pathways and target effective emerging technology strategies.
Acknowledgments
This research was undertaken at Georgia Tech drawing on support from the National Science Foundation (NSF) through the Center for Nanotechnology in Society (Arizona State University; Award No. 0531194); and the Science of Science Policy Program— “Measuring and Tracking Research Knowledge Integration” (Georgia Tech; Award #0830207). The findings and observations contained in this paper are those of the authors and do not necessarily reflect the views of the National Science Foundation. The research findings on Deep-Brain Implants were conducted as part of PhD research undertaken as part of the Technology Assessment Programme of the Dutch national nanotechnology initiative, NanoNed. These were part of the FRONTIERS European Network of Excellence,financed by the European Commission 6th Framework Programme. The contribution of D. K. R. Robinson to the further development of the notion of Innovation Pathways is part of a Post Doctoral research under the project ANR-RITE Regimes de Conception.
References
[1] A.D. Romig Jr., A.B. Baker, J. Johannes, T. Zipperian, K. Eijkel, B. Kirchhoff, H.S. Mani, C.N.R. Rao, S. Walsh, An introduction to nanotechnology policy: opportunities and constraints for emerging and established economies, Technol. Forecast. Soc. Change 74 (2007) 1634–1642.
[2] A. Pilkington, Linda L. Lee, Casey K. Chan, Seeram Ramakrishna, Defining key inventors: a comparison of fuel cell and nanotechnology industries, Technol. Forecast. Soc. Change 76 (2009) 118–127.
[3] T. Fleischer, M. Decker, U. Fiedeler, Assessing emerging technologies—methodological challenges and the case of nanotechnologies, Technol. Forecast. Soc. Change 72 (2005) 1112–1121.
[4] D.K.R. Robinson, T. Propp, Multi-path mapping as a tool for reflexive alignment in emerging S&T, Technol. Forecast. Soc. Change 75 (2008) 517–538. [5] D.K.R. Robinson, Constructive Technology Assessment of Emerging Nanotechnologies: Experiments in Interactions, PhD Manuscript, University of Twente,
The Netherlands (November, 2010.
[6] L. Huang, Y. Guo, Z.C. Peng, A.L. Porter, Characterizing a technology development at the stage of early emerging applications: Nanomaterial-enhanced biosensors, Technol. Anal. Strateg. Manag. 23 (2011) 527–544.
[7] P. Larédo, E. Jolivet, E. Shove, S. Raman, A. Rip, E. Moors, B. Poti, G.-J. Schaeffer, H. Penan, C.E. Garcia, SocRobust Final Report. Paris: Ecole des Mines, Project SOE 1981126, 'Management tools and a Management Framework for Assessing the Potential of Long-Term S&T Options to Become Embedded in Society, TSER Programme of the European Commission, January 2002.
[8] P. Groenveld, Roadmapping integrates business and technology, Res. Technol. Manage. 40 (1997) 48–55.
[9] R. Phaal, C.J.P. Farrukh, D.R. Probert, Technology roadmapping— a planning framework for evolution and revolution, Technol. Forecast. Soc. Change 71 (2004) 5–26.
[10] T.A. Kappel, Perspectives on roadmaps: how organizations talk about the future, J. Prod. Innov. Manag. 18 (2001) 39–50.
[11] R.N. Kostoff, E. Geisler, Strategic management and implementation of textual data mining in government organizations, Technol. Anal. Strateg. Manag. 11 (1999) 493–525.
[12] S. Lee, Y. Park, Customization of technology roadmaps according to roadmapping purposes: overall process and detailed modules, Technol. Forecast. Soc. Chang. 72 (2005) 567–583.
[13] E. Lichtenthaler, The choice of technology intelligence methods in multinationals: towards a contingency approach, Int. J. Technol. Manag. 32 (2005) 388–407.
[14] J.C. Mankins, Technology Readiness Levels, White Paper, NASA, April, 1995.
[15] A. Rip, A co-evolutionary approach to reflexive governance — and its ironies, in: J.P. Voß, R. Kemp (Eds.), Reflexive Governance For Sustainable Development: Edward Elgar Publishing, 2008.
[16] F.W. Geels, Towards sociotechnical scenarios and reflexive anticipation: using patterns and regularities in technology dynamics, in: K.H. Sørensen, R. Williams (Eds.), Shaping Technology, Guiding Policy: Concepts, Edward Elgar, Spaces and Tools, Cheltenham (UK), Northampton (MA, USA), 2002. [17] S. Jacobsson, A. Johnson, The diffusion of renewable energy technology: an analytical framework and key issues for research, Energy Policy 28 (2000)
625–641.
[18] S.O. Negro, M.P. Hekkert, Explaining the success of emerging technologies by innovation system functioning: the case of biomass digestion in Germany, Technol. Anal. Strateg. Manag. 20 (2008) 465–484.
[19] E. Wenk Jr., T.J. Kuehn, Interinstitutional networks in technological delivery systems, in: J. Haberer (Ed.), Lexington Books, Lexington, MA, 1977, pp. 153–175. [20] A.L. Porter, S.W. Cunningham, Tech Mining: Exploiting New Technologies for Competitive Advantage, Wiley, New York, 2005.
[21] Y. Guo, L. Huang, A.L. Porter, Nanotechnology-enhanced thin-film solar cells: analysis of global research activities with future prospects, 18th International Conference on Management of Technology, Orlando, April, 2009.
[22] L. Leydesdorff, I. Rafols, A global map of science based on the ISI subject categories, J. Am. Soc. Inf. Sci. Technol. 60 (2009) 348–362.
[23] T.Y. You, et al., Reductive H2O2 detection at nanoparticle iridium/carbonfilm electrod and its application asL-glutamate enzyme sensor, Eletroanalysis 16 (2004) 54–59.
[24] A. Tsukamoto, et al., Development of multisample biological immunoassay system using HTS SQUID and magnetic nanoparticles, Appl. Supercond. 15 (2005) 656–659.
[25] J.W. Park, et al., Piezoelectric immunosensor for bisphenol A based on signal enhancing step with 2-methacrolyloxyethyl phosphorylcholine polymeric nanoparticle, Analyst 131 (2006) 155–162.
[26] D.J. Qian, et al., A hydrogen biosensor made of clay, poly (butylviologen), and hydrogenase sandwiched on a glass carbon electrode, Biosens. Bioelectron. 17 (2002) 789–796.
[27] A.H. van de Ven, D.E. Polley, R. Garud, S. Venkataraman, The Innovation Journey, Oxford, Oxford University Press, 1999.
[28] J-P Voss, Designs on Governance— Development of policy instruments and dynamics in governance. PhD Thesis. University of Twente, 2007.
[29] D.K.R. Robinson, M. Ruivenkamp, A. Rip, Tracking the evolution of new and emerging S&T via statement-linkages: vision assessment in molecular machines, Scientometrics 70 (2007) 831–858.
[30] K. Akamatsu, N. Tsuboi, Y. Hatakenaka, S. Deki, In situ spectroscopic and microscopic study on dispersion of Ag nanoparticles in polymer thinfilms, J. Phys. Chem. B 104 (2000) 10168.
[31] T.C. Wang, M.F. Rubner, R.E. Cohen, Polyelectrolyte multilayer nanoreactors for preparing silver nanoparticle composites: controlling metal concentration and nanoparticle size, Langmuir 18 (2002) 3370.
[32] O.A. Sadik, S.K. Mwilu, A. Aluoch, Smart electrochemical biosensors: from advanced materials to ultrasensitive devices, Electrochim. Acta 55 (2010) 4287–4295.
[33] Y. Xiao, Y. Liu, G. Borg, C.M. Li, Design of a novel disposable piezoelectric co-polymer diaphragm based biosensor unit, Mater. Sci. Eng., C 31 (2011) 95–98. Douglas K. R. Robinson is Managing Director of teQnode S.A.R.L. a limited company active in providing strategic intelligence, innovation analysis and foresight covering a variety of areas of new and emerging science and technologies (www.teqnode.com). He also holds a position as Research Associate at the Centre for Innovation Management (CGS), Ecoles des Mines, Paris (France), where he continues to explore the challenge of design and management of innovation pathways and socio-technical systems.
Lu Huang is a faculty member in the School of Management and Economics, Beijing Institute of Technology. Her specialty is science and technology management, particularly the study of technology forecasting and assessment. She is focusing on research on emerging science and technology topics.
Ying Guo is a Ph.D. candidate in Management Science and Engineering, Beijing Institute of Technology of China. Her current specialty is technology management and assessment, particularly focusing on how to forecast the likely innovation pathways for emerging nano-related technologies and their applications. Alan Porter is director of R&D for Search Technology, Inc. He is also Professor Emeritus of Industrial & Systems Engineering, and Public Policy, at Georgia Tech, where he continues to co-direct the Technology Policy & Assessment Center. His current interests focus on improving“Tech Mining” tools for technical intelligence, research program assessment, and forecasting & assessment of emerging technologies.