HAL Id: hal-02064096
https://hal-mines-albi.archives-ouvertes.fr/hal-02064096
Submitted on 29 Apr 2019
HAL is a multi-disciplinary open access
archive for the deposit and dissemination of
sci-entific research documents, whether they are
pub-lished or not. The documents may come from
teaching and research institutions in France or
abroad, or from public or private research centers.
L’archive ouverte pluridisciplinaire HAL, est
destinée au dépôt et à la diffusion de documents
scientifiques de niveau recherche, publiés ou non,
émanant des établissements d’enseignement et de
recherche français ou étrangers, des laboratoires
publics ou privés.
IN-PLANE and out-of-plane deformation at the
SUB-GRAIN scale in polycrystalline materials assessed
by confocal microscopy
J.H. Liu, N. Vanderesse, J.-C. Stinville, T.M. Pollock, P. Bocher, Damien
Texier
To cite this version:
J.H. Liu, N. Vanderesse, J.-C. Stinville, T.M. Pollock, P. Bocher, et al.. IN-PLANE and out-of-plane
deformation at the SUB-GRAIN scale in polycrystalline materials assessed by confocal microscopy.
Acta Materialia, Elsevier, 2019, 169, pp.260-274. �10.1016/j.actamat.2019.03.001�. �hal-02064096�
In-plane and out-of-plane deformation at the sub-grain scale in
polycrystalline materials assessed by confocal microscopy
J.H. Liu
a,**, N. Vanderesse
a, J.-C. Stinville
b, T.M. Pollock
b, P. Bocher
a, D. Texier
a,c,*aMechanical Engineering Department, !Ecole de technologie sup!erieure, 1100 Rue Notre-Dame Ouest, Montreal, H3C 1K3, QC, Canada bMaterials Department, University of California Santa Barbara, 93106, Santa Barbara, CA, United States
cClement Ader Institute (ICA), Universit!e de Toulouse, CNRS, IMT Mines Albi, INSA, ISAE-SUPAERO, UPS; Campus Jarlard, F-81013, Albi, France
Keywords:
Nickel-based polycrystalline superalloy High Resolution-Digital Image Correlation (HR-DIC)
Laser scanning confocal microscopy (LSCM) In-situ tensile testing
Strain localization
a b s t r a c t
High-resolution digital image correlation (HR-DIC) techniques have become essential in material me-chanics to assess strain measurements at the scale of the elementary mechanisms responsible of the deformation in polycrystalline materials. The purpose of this study is to demonstrate the use of laser scanning confocal microscopy (LSCM) coupled with DIC techniques to deepen knowledge on the deformation process of a polycrystalline nickel-based superalloy at room temperature. The LSCM tech-nique is capable of detecting both in-plane and out-of-plane strain localization within slip bands at the sub-grain level. The LSCM observations are consistent with previous in-situ scanning electron microscopy (SEM) studies: The onset of crystal plasticity occurs primarily near S3 twin boundaries with macroscopic loading in the elastic domain (macroscopic stress as low as 80% of the 0.2% offset yield strength (Y.S.0.2%)).
This intense irreversible strain localization occurs with either a high Schmid factor (m>0.43) or a sig-nificant elastic modulus difference between the pair of twins (DЕ >100 GPa). In the plastic deformation domain, transgranular slip activity following slip systems with the highest Schmid factor is mostly responsible for the deformation at the grain level, thus leading to strain percolation. The simultaneous in-plane and out-of-plane deformation assessment via the HR-LSCM-DIC technique was found to be essential for the identification of active slip systems. Finally, the HR-LSCM-DIC technique enabled the quantification of the glide amplitude involved in the three-dimensional shearing process at the grain level that solely in-plane measurements cannot provide.
1. Introduction
The mechanical performance of polycrystalline materials sub-jected to static or cyclic loading is controlled by the plastic activity at the sub-grain scale during deformation. While macroscopic tensile tests document the global mechanical behavior of the ma-terial, the onset of strain localization, which occurs at the sub-grain scale prior to the macroscopic yielding, informs the critical microstructural features that are responsible for damage initiation [1e3]. The difficulty of assessing such local irreversible deformation
at the microscale lies within the capability to observe and measure small displacements induced by the deformation mechanisms, including slip localization and deformation twinning [3e7]. Slip localization was found to develop in grains favorably oriented for slip activity in fcc materials (high Schmid factor (SF)) [8e10] or in the vicinity of and parallel to twin boundaries presenting either a high Schmid factor or a significant difference in elastic properties between the twin and the parent grain [2,3,11]. Such local and intense strain localization befalls at macroscopic stresses signifi-cantly below the yield strength of the material and degrades its fatigue life under cyclic loading.
As the subject of heterogeneous deformation in polycrystalline materials becomes of greater interest, new techniques have been developed to characterize slip activity at the sub-grain scale. Owing to its high spatial resolution, scanning electron microscopy (SEM) has been frequently used in order to document sub-grain dis-placements. It has provided substantial information on crack initiation sites under cyclic loading that are often associated with
*Corresponding author. Clement Ader Institute (ICA), Universit!e de Toulouse, CNRS, IMT Mines Albi, INSA, ISAE-SUPAERO, UPS; Campus Jarlard, F-81013, Albi, France.
**Corresponding author. Mechanical Engineering Department, !Ecole de tech-nologie sup!erieure, 1100 Rue Notre-Dame Ouest, Montreal, H3C 1K3, QC, Canada.
E-mail addresses:jia-hong.liu.1@ens.etsmtl.ca(J.H. Liu), damien.texier@mines-albi.fr(D. Texier).
slip localization [12,13]. In addition, in-situ SEM tensile character-ization is also capable of documenting the onset of crystal plasticity due to the emergence of slip bands or extrusions within individual grains at the surface of the deformed specimen [8]. This qualitative slip characterization is incapable of quantifying the displacement amplitude associated with individual slip bands nor the in-plane/ out-of-plane gliding direction. While complementary ex-situ atomic force microscopy (AFM) observations aim to quantitatively investigate the out-of-plane intensity of the slip band emergence and/or extrusions [8,14], the timeliness of this nanoscale charac-terization technique is not suitable for the investigation of nearly-millimeter-squared regions of interest, required for the statistical study of crystal plasticity in tens-of-micrometer grain size mate-rials [3]. Therefore, alternative solutions are needed for the quan-titative and statistical assessment of slip localization, i.e. in-plane and out-of-plane strain localization, at the sub-grain level.
Full-field digital image correlation (DIC) techniques have proven their capability for quantitatively measuring in-plane strain fields of polycrystalline materials at the sub-micrometer level using optical [15e17] or scanning electron observation [18e20]. In the first instance, these techniques experimentally demonstrated the heterogeneous mechanical response of mate-rials at the sub-grain level due to anisotropic properties as well as neighborhood effects, i.e. strain accumulation of slip transfer at grain boundaries. However, these techniques were not sufficiently resolved to observe and quantitatively document slip localization. Signal-to-noise ratio, artifacts in image acquisition and spatial resolution were critical limitations [21]. Ongoing improvements of image acquisition techniques and speckle patterning now make it possible to assess in-plane discrete deformation via individual slip bands [4e6,14,22,23]. HR-SEM-DIC also demonstrated the capa-bility to assess reversible elastic but intense deformations of a polycrystalline nickel-based superalloy due to the anisotropic stiffness of individual grains in relation to the macroscopic loading [5]. While such techniques provide very high spatial resolution, they are time consuming (5e15 min per micrograph for HR-SEM-DIC), provide data on a small region of interest, and solely inform on the in-plane deformation. While HR-SEM-DIC tech-niques succeed in slip plane identification and in-plane deforma-tion level, they are not sufficient to fully identify active slip systems inherent to the three-dimensional character of the Bur-gers vectors. Such slip system identification and evaluation of local deformation is not possible using solely conventional in-plane DIC methods due to the continuum mechanics approach affecting the displacement values in the vicinity of the discontinuity. To remedy issues associated with slip-band induced localization, discontinuity-tolerant Heaviside-DIC and relative displacement ratio methods were recently developed to in-situ identify active slip systems using solely in-plane information and indirect calculation of the out-of-plane response [14,24]. These methods allow an accurate assessment of the in-plane sliding and shearing displacements in the vicinity of a slip band, but is not capable of providing in-situ out-of-plane displacements. In order to have representative response of the microstructure and three-dimensional information on the glide direction and deformation amplitude sustained by individual slip bands, a more efficient method with faster image acquisition and the required spatial resolution is needed.
As aforementioned, out-of-plane measurement at the slip scale is a necessary condition to adequately identify slip systems acti-vated in polycrystalline materials and also to quantify the ampli-tude of the three-dimensional shearing process at the sub-grain level following Burgers vectors. Laser scanning confocal microscope (LSCM) imaging offers promising spatial three-dimensional reso-lution that is worth investigation for simultaneous measurement of
in-plane and out-of-plane deformation. Wouters et al. [25] analyzed the roughness of a deformed polycrystalline specimen following a linear trend as a function of both strain and grain size. This finding arises from the combined effect of a self-affine roughening at a sub-grain scale and a grain scale roughening caused by orientation differences between neighboring grains. Lackmann et al. [26] used LSCM-DIC and EBSD to correlate topo-graphic changes to strain concentration in polycrystalline NiTi materials. Bertin et al. [27] used height measurements for 3D sur-face displacements characterizations via integrated DIC associated with crystal plasticity finite element modelling. Although a corre-lation was observed for all those LSCM studies between strain concentration and grain microstructure, the resolution of the strain fields was not capable of fully capturing the discrete displacements at the sub-grain scale due to slip activity.
The goals of the present study are threefold: (i) to demonstrate the capability of near-UV LSCM for HR-DIC analysis of strain localization within individual slip bands (in-plane and out-of-plane measurements), (ii) to identify microstructural configurations responsible for the irreversible deformation of materials in different loading regimes in statistically representative regions of interest, and (iii) to better quantify the amplitude of the three-dimensional shearing process within grains. To this end, different loading conditions are scrutinized to document slip activity below and above the yield strength of the material. EBSD characterization is employed to correlate the relationship between grain orienta-tion, activated slip system, and in-plane versus out-of-plane mea-surement sensitivity due to the identified gliding direction along the slip band.
2. Experimental procedures
2.1. Material and metallographic preparation
The material studied is a wrought polycrystalline nickel-based superalloy, Inconel 718 (In718), with a nominal composition: Nie18.5Cre18.3Fee5.0(Nb þ Ta)e3.0Moe1.0Tie0.6Ale0.3C (wt. %). Tensile specimens were extracted from bars and given a stan-dard heat treatment (955"C-1h-air cooling þ 720"C-8h-cooling
0.83"C.min#1 þ 620"C-8h-furnace cooling). The polycrystalline
material displays an average grain size of 25
m
m and limited texture. Tensile specimens were CNC machined to provide the dogbone geometry depicted inFig. 1(a), and were then sliced with a precision cutting machine to obtained 1 mm-thick specimens. Tensile specimens were manually ground down to a P4000 SiC grit paper, then finally polished down to 1m
m diamond solution andelectro-polished during 10 s in a STRUERS A3 electrolyte solution at 20 V.
2.2. In-situ laser scanning confocal microscopy (LSCM) tensile testing
Tensile tests were conducted with a Kammrath & Weiss ± 5 kN micro-tensile apparatus paired with a Keyence LS-7030 M optical micrometer to first assess the macroscopic stress-strain curve of In718 (Fig. 1(b)) and then, to define specific interrupted stress/ strain levels for full-field HR-LSCM-DIC analyses at the micro-scale. For HR-LSCM-DIC experiments, the micro-tensile apparatus was set up with a 405 nm-wavelength laser scanning confocal microscope Olympus LEXT OLS4100 (Fig. 1(c)). Digital images were acquired in laboratory environment using a MPLAPON100XLEXT lens in laser intensity mode with a resolution of 4096 $ 4096 pixels2for a field
of view of 128 $ 128
m
m2, i.e. 31 nm.pix#1 (Fig. 2(a)). For heightmeasurements, a height pitch of 60 nm was used. Loading was performed with a crosshead displacement rate of 7
m
m.s#1. Fivedifferent loading steps of 1000, 1100, 1200, 1300 and 1340 MPa were investigated in order to document the microscale plasticity below and beyond the macroscopic 0.2 pct. offset yield strength (Y.S.0.2%). For each stress level, the full-field strain measurement was carried out in an unloaded state to document the local plastic behavior of the material. The respective irreversible macroscopic strains, εp,assessed with DIC in the whole region of interest
cor-responded to 0.024, 0.053, 0.22, 1.31, and 2.57%, as shown with red crosses inFig. 1(c).
2.3. High resolution e laser scanning confocal microscopy - digital image correlation (HR-LCSM-DIC)
Digital image correlation was performed using OpenDIC [28]. Reference images were acquired with the LSCM before tensile testing and after each tensile interruption (deformed images). Displacement fields were obtained for each comparison between the initial image and the deformed image using the zero normal-ized cross correlation criterion (ZNCC). Strain fields were then calculated from the displacement fields using Lagrangian finite strain theory. The fineness and repeatability of the speckle pattern is a key parameter in HR-DIC. One of many possibilities for speckle patterning is to exploit the surface texture generated by etching the material [29]. The etchant used for this investigation was: 30% vol. H2O2þ 70% vol. HCl applied for 30 s at room temperature. This metallographic procedure generated a fine and well distributed intragranular pitting as shown inFig. 2(aec). For this study, the observed average pit size is 7.8 $ 7.8 pixel2(0.24 $ 0.24
m
m2) and the average distance between each pit is 19 pixels (0.6m
m). The DIC parameters were chosen to provide a high spatial resolution with the use of a subset size of 25 $ 25 pixel2(0.8 $ 0.8m
m2) and a step size of 8 pixels. Etching also preferentially engraved grain bound-aries with a maximum depth of 320 nm. Guilhem et al. [30] numerically demonstrated that this degree of roughness does not alter strain localization at the sub-grain level using crystal plasticity code.Acquisition of several adjacent micrographs with overlapping areas allow large area investigation while maintaining the high spatial resolution needed for statistical analyses of the heteroge-neous deformation [5]. At each unloading step, 3 $ 2 micrographs were acquired manually with 30% overlap, covering a region of 310 $ 220
m
m2. Image distortions were minimized by performingDIC measurements on 56% of the full micrographs. Reference micrograph positions were obtained from a first stitching operation
Fig. 1. (a) Geometry of the dogbone tensile specimen. (b) Macroscopic stress-strain curve during monotonic tensile loading for the In718 (black curve). Red dashed curve and red crosses (at 0 MPa) correspond to stress-strain curve of the DIC tests and the different steps investigated to document the local deformation of the material at the microscale via HR-DIC, for macroscopic irreversible strain εp,of 0.024%, 0.053%, 0.22%, 1.31%, and 2.57%. DIC measurements were performed in an unloaded state. (c) In-situ micro-tensile setup for
HR-DIC technique (Kammrath & Weiss ± 5 kN apparatus paired with an Olympus LEXT OLS 4100 LSCM). The black arrows indicate the loading direction. (For interpretation of the references to color in this figure legend, the reader is referred to the Web version of this article.)
Fig. 2. (a) Typical high-resolution LSCM micrograph showing the fine and dense speckle pattern generated from etching. (b) Enlarged area from the micrograph showing the intragranular speckle pattern (red dashed box in Fig. 2(a)). (c) Description of different features (pits) within a subset of 25 $ 25 pixel2(red box inFig. 2(b)). (For
interpretation of the references to color in this figure legend, the reader is referred to the Web version of this article.)
with a pixel accuracy [31]. Reference micrograph positions are thus used to compute subset positions for all the DIC areas of interest. DIC calculations were conducted separately for each area of inter-est. The strain maps were finally stitched together to generate a high resolution, wide field-of-view strain map thanks to the reference micrograph positions.
2.4. SEM and EBSD characterizations
After HR-DIC measurements, the region of interest (ROI) inves-tigated was marked with indents to precisely locate it after pol-ishing for EBSD measurements. Diamond polpol-ishing then chemical-mechanically polishing with 0.05
m
m colloidal silica were carried out for 12 h. EBSD measurements were conducted with a FEI Versa field emission gun - scanning electron microscope equipped with an OIM-Hikari XM4 EBSD detector from EDAX. The operating pa-rameters to assess the 400 $ 300m
m2EBSD scan were anacceler-ating voltage of 20 keV, a beam current of about 0.2 nA, a square measurement grid with a step size of 0.5
m
m, and a 4 $ 4 binning mode. An affine transformation was applied between the EBSD and LSCM sets of data to correct for distortions.2.5. Height difference maps
To pixel-to-pixel measure and compare the height variation at the sub-grain level through different loading steps, it is necessary to reconstruct the height maps of the ROIs in a loaded state in com-parison to the reference image position, i.e. the ROI prior to defor-mation. By using the in-plane kinematic field obtained by HR-LSCM-DIC, every height of a pixel in the initial coordinates of the reference image is calculated based on the translated coordinates of the deformed image using the following method:
hrefftgðx; yÞ ¼ hdefftg
! x0
; y0"
¼ hdefftgðx þ Uftgðx; yÞ; y þ Vftgðx; yÞÞ
where href and hdef corresponds to the height values in the
refer-ence and deformed coordinate systems, t the current loading step, Uand V the displacements, x and y, the initial coordinates and x’ and y’, the final coordinates after translation.
Since the displacements are non-integer values (subpixel dis-placements), the coordinates in the deformed image are non-integer as well, i.e. x0
¼ x þ Uftgðx; yÞ;ℕ and y 0
¼ y þ Vftgðx;
yÞ;ℕ. Therefore, the height value considered in the deformed image coordinates is assumed to be the sum of value of each pixel around the x’ and y', defined as hdefftgðX; YÞ with X;Y2ℕ, weighted
by their area of coverage AdefftgðX; YÞ:
Hdefftg!x0 ; y0"¼X 1 i¼0 X1 j¼0 !
hdefftgðX þ i; Y þ jÞ: AdefftgðX þ i;Y þ jÞ"
Adef ftgðX þ i;Y þ jÞ ¼ 8 > > < > > : i ¼ j ¼ 0; #1 ##x0 # X""!1 #!y0 # Y"" i ¼ 1; j ¼ 0; #x0 # X"!1 #!y0# Y"" i ¼ 0; j ¼ 1; #1 ##x0 # X""!y0# Y" i ¼ j ¼ 1; #x0 # X"!y0# Y" Height difference maps were thus calculated by directly sub-tracting the unloaded initial height map from deformed steps. Discontinuities in height were thus distinguishable from etching artifacts and local variance filters with a 2-pixel diameter radius on
the height difference maps were used in order to document the discrete out-of-plane deformation at the sub-grain level.
2.6. Burgers vector of the active slip system
EBSD data combined with simultaneous in-plane and out-of-plane measurements were used to identify active slip systems. At room temperature, twelve slip systems are possible for the FCC
g
-Nimatrix with three configurations for a given plane due to the three 〈110〉 slip directions per plane.
The global coordinate system is based on the sample orienta-tion; however, information regarding the slip localization, i.e. Bur-gers vector aligned with the slip direction, is related to the orientation of each individual crystal. To extract a vector known in the crystal orientation to the sample's orientation, a rotation matrix gis employed. This matrix is determined by Euler angles measured via EBSD measurements (41,
F
, 42). For any vector known in thecrystal orientation, the equivalent vector in the sample's orienta-tion is obtained following by the expression: v!s¼ g#1: v!cwhere
v
!sand v!ccorrespond to the vector expressed in the sample and crystal coordinate system, respectively, and denoted b!sand b!cfor
the Burgers vector of the active slip system in the sheared grain. Experimental in-plane and out-of-plane displacement measure-ments from both sides of slip bands were calculated and normal-ized so that the norm of the three-dimensional displacement is equal to 1. This normalized displacement can be directly compared to projected Burgers vector normalized by$$$ b!s
$ $
$ for slip system identification and is further called “elementary displacement” in the whole manuscript.
3. Results: in-plane and out-of-plane strain localization assessment HR- LSCM-DIC
The strain component along the loading direction (LD, which corresponds to the horizontal direction for all the figures), εxx, is
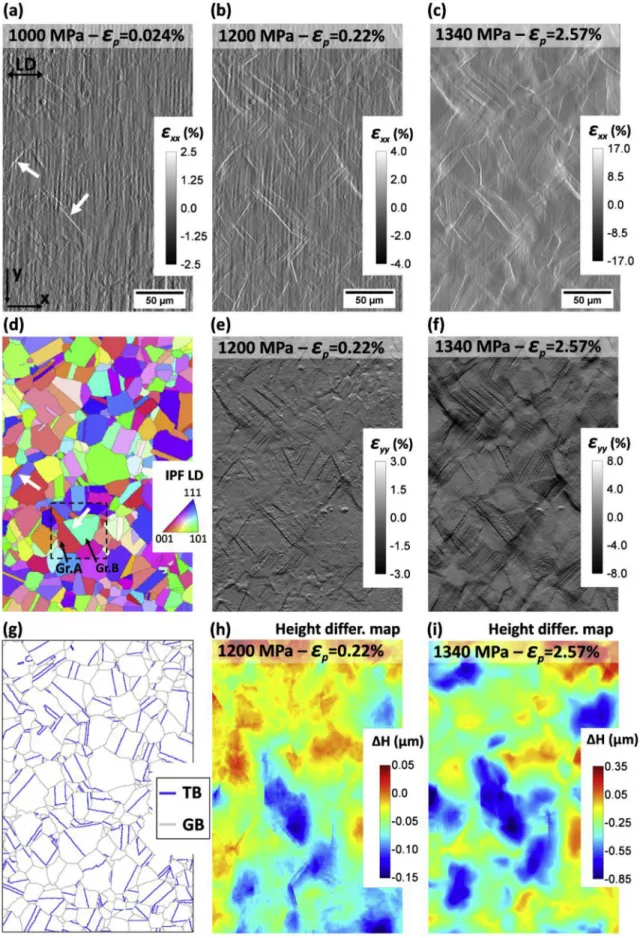
depicted inFig. 3(aec) for three loading steps with irreversible macroscopic deformation ranging from εp¼ 0.024% to εp¼ 2.57%. The grain structure of the ROI is represented as an inverse pole figure (IPF) map according to the loading direction inFig. 3(d) and as grain boundary map inFig. 3(g). The white arrows inFig. 3(a) show intense strain localization at slip bands appearing at εp¼ 0.024%. Assessment of discrete strain localization events
within slip bands is thus detectable with the HR-LSCM-DIC tech-nique at the sub-grain level. The EBSD map inFig. 3(d and g) reveals that they are located in the vicinity of twin boundaries. At higher stress conditions, i.e. at Y.S.0.2% and above, transgranular strain
localization is detected. Such strain localization can also be observed in εyystrain fields (Fig. 3(e and f)). Aside from high strain
localization within slip bands, vertical and periodical bands (every 4e5
m
m) are observable in all the εxxstrain fields, especially at lowstresses (Fig. 3(a and b), but not observable in εyy strain fields
(Fig. 3(e). These vertical bands are mainly due to the scanning strategy (line scan along the y direction and line jump in the x di-rection) and the inherent artifacts induced by the microscope.
Height difference maps for the same loading conditions are also depicted in Fig. 3(h and i). After subtracting the initial surface roughness, sub-grain displacements as low as tens of nanometers were measured. Topographic observations outlined the evolution of the average roughness due to plastic deformation. While the roughness remains quite low and constant in the macroscopic elastic domain (Ra<25 nm below yielding), it strongly increases
above Y.S.0.2% (Ra¼ 83 and 149 nm at 1300 MPa - εp¼ 1.31% and 1340 MPa - εp¼ 2.57%, respectively). In the macroscopic plastic domain, facets of individual grains are formed, leading to peaks and valleys (hot and cold colors in (Fig. 3(h and i)), respectively). Height
Fig. 3. (aec) εxxstrain maps obtained from LSCM-DIC for three different loading steps, i.e. 1000 MPa - εp¼ 0.024%, 1200 MPa - εp¼ 0.22%, and 1340 MPa - εp¼ 2.57%, (d) corre-sponding IPF map in reference to the loading direction, (eef) εyystrain maps obtained from LSCM-DIC for two different loading steps, i.e. 1200 MPa - εp¼ 0.22%, and 1340 MPa -εp¼ 2.57%, (g) Grain boundary map of the ROI showing grain boundaries and twin boundaries, (hei) Height difference maps for two different loading steps, i.e. 1200 MPa -εp¼ 0.22%, and 1340 MPa - εp¼ 2.57%. The white arrows show the observed slip bands in the first loading step and their corresponding location in the IPF map. The black dashed box inFig. 3(d) corresponds to the area of interest inFig. 4.
discontinuities, also denoted as height jumps, resulting from slip activity were also observed at the sub-grain level, even for loading conditions as low as 1100 MPa - εp¼ 0.053%. The density and in-tensity of height discontinuities increased with deformation. By simultaneously measuring in-plane and out-of-plane deformations at the grain level, it is possible to correlate the deformation with the height variation across some local discontinuities (Fig. 3(h and i) and Fig. 4). Fig. 4 shows in-plane strain localization within slip bands (in the vicinity of a twin boundary (Gr.A/Gr.B TB) and transgranular (Gr.B)) and topographic measurements showing some height discontinuities for a reduced region that displayed
early strain localization. Profile plots of the height along the dashed arrow depicted inFig. 4are illustrated inFig. 5. The vertical dashed lines inFig. 5corresponds to the location of identified slip planes and the color code corresponds to the loading condition at which the onset of plasticity was found.
Using the procedure detailed in section 2.5, height difference and the variance of height difference representations were used for slip activity assessment. At low stress level (80% of Y.S.0.2%up to
Y.S.0.2%), a few out-of-plane slip bands were detected at the surface
but did not significantly influence global roughness. Such height discontinuities could not be detected solely from raw topographic
Fig. 4. Identification of discrete in-plane and out-of-plane strain localization at the sub-grain level in the ROI defined inFig. 3(d) for three loading conditions: 1000 MPa -εp¼ 0.024% (80% of the Y.S.0.2%), 1200 MPa - εp¼ 0.22% (zY.S.0.2%), 1340 MPa - εp¼ 2.57% ([ Y.S.0.2%). (aec) εxxstrain field, (def) height difference maps, (gei) variance of height
data, making height difference representations a valuable tool to document the three-dimensional character of slip deformation. Above Y.S.0.2%, facets start to develop at the surface of the specimen
due to the plastic deformation within individual grains, as shown in
Fig. 4(e and h) andFig. 5(b: red curve). Such facet formation leads to an increase of the global roughness of the plastically deformed specimen (Fig. 3(h and i)).
For the identification of active slip system and the three-dimensional glide measurement, the ROI scrutinized in Fig. 4 is
particularly interesting since two slip systems can be active in the same grain for the most highly stressed slip plane. At 80% of Y.S.0.2%,
intense strain localization was observed in the vicinity of the twin boundary (Fig. 4(a)) while no discontinuity in topographic mea-surements was detected in terms of height difference and variance of height difference maps (Fig. 4(d and g)). The particularly low out-of-plane character of this slip system is also apparent inFig. 5(b and c) (red vertical dashed line on the left) compared to its in-plane character (intense blue peak on the left inFig. 5(a)). Height dis-continuities were evident at this location at higher stress level but at a relatively low intensity compared to in-plane discrete defor-mation (Fig. 4(c, f, and i) andFig. 5). However, this slip plane also demonstrated a particularly high out-of-plane character in a transgranular manner compared to its in-plane character, as shown inFig. 4at Y.S.0.2% and above and inFig. 5(b and c) (red and green vertical dashed lines in the middle). In this specific case, the slip systems associated with the near-twin boundary and transgranular strain localization were ð111Þ½101) and ð111Þ½110) with similar Schmid factors of 0.430 and 0.432, respectively. The ð111Þ½101) slip system was found to have a particularly low out-of-plane character while the one of the ð111Þ½110) slip system is very intense (Table 1
andFig. 6(b)). Interestingly, low out-of-plane and intense in-plane strain localization (Y component) was evident for a transgranular slip band, the one highlighted with the vertical black dashed line on the right inFig. 5(b and c).
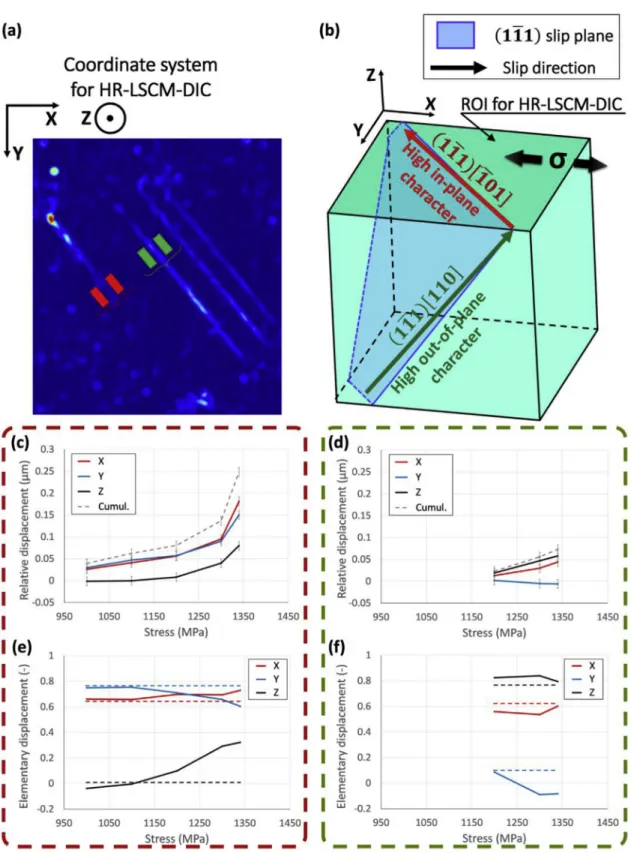
A closer inspection of the relative displacement along the X, Y and Z directions on both sides of slip bands have been conducted for a S3 TB and a transgranular slip band (Fig. 6). The relative displacement, representative of the cumulated Burgers vector, gradually increases as the macroscopic deformation increases (Fig. 6(c and d)). Transgranular strain localization was found at 1200 MPa for the incremental loading. The intersection of the four relative displacements (X, Y, Z and cumulated) with the abscissa would suggest that the plastic activity developed earlier, at approximately 1150 MPa. Interestingly, the relative displacement for the transgranular slip localization exhibited a linear tendency as a function of the macroscopic stress, while the one of the S3 TB slip localization more intensively increased above the Y.S.0.2%. For the
near S3 TB slip localization, the out-of-plane relative displacement develops rapidly beyond yielding (Fig. 4(c and i) andFig. 6(c)).
The elementary displacement was calculated from experimental measurements and compared to the theoretical value of the pro-jected ½101) and ½110) gliding directions, reported as horizontal dashed lines for the ð111Þ½101) and ð111Þ½110) slip systems in
Fig. 6(e and f), respectively. Interestingly, the elementary dis-placements agree relatively well with their theoretical values for the two cases, i.e. ð111Þ½101) and ð111Þ½110) for the near S3 TB and the transgranular slip localization, respectively. Furthermore, the elementary displacement in the Z direction was found to inten-sively increase above the Y.S.0.2%for near S3 TB, while the one in the
Fig. 5. Profiles for identification of discrete (a) in-plane and (b and c) out-of-plane strain localization for the profile line shown inFig. 4.
Table 1
Characteristics of the two active slip systems identified forFig. 6's ROI: Schmid factor in reference to the macroscopic loading direction and elementary dis-placements in the HR-LSCM-DIC coordinate system.
Strain localization config.
Near twin boundary (red arrow inFig. 6(b))
Transgranular (green arrow inFig. 6(b)) Slip system ð111Þ½101) ð111Þ½110) Schmid factor (-) 0.430 0.432 b !,!X=$$$ b!$$$ ðÞ #0.64 0.64 b !,!Y=$$$ b!$$$ ðÞ #0.77 0.11 b ! ,!Z=$$$ b!$$$ ðÞ #0.01 0.76
Fig. 6. Evolution of the relative and elementary displacements within a grain on both sides of a slip band due to shearing process: a) Region of interests, i.e. near S3 TB (in red) and transgranular (in green), b) Schematic of the grain showing two active slip systems (Gr.B) and outlining the high in-plane character of the ð111Þ½101) slip system but the high out-of-plane character of the ð111Þ½110) slip system, c and d) relative displacements in the X, Y and Z directions and norm of the three-dimensional gliding vector for the near S3 TB and transgranular cases, respectively, e and f) experimental elementary displacements in the X, Y and Z directions for the near S3 TB and transgranular cases, respectively (dashed horizontal lines correspond to the theoretical elementary displacement of the Burgers vector projected on the three directions for the ð111Þ½101) and ð111Þ½110) slip systems, respectively). As a reminder, the elementary displacement corresponds to the measured displacement along X, Y, and Z normalized so that the norm of the three-dimensional displacement is equal to 1. (For interpretation of the references to color in this figure legend, the reader is referred to the Web version of this article.)
Y direction decreases Fig. 6(e). Slip activity evolves from a ð111Þ½101) active slip system in the low stress regime (below the Y.S.0.2%) to a ð111Þ½110) slip system in the high stress regime with a
proportion of nearly 15e25% and 30e40% at 1300 MPa - εp¼ 1.31%
and 1340 MPa - εp¼ 2.57%, respectively. In parallel, transgranular slip localization following the ð111Þ½110) slip system was found to develop at Y.S.0.2%, at the same time that this slip system develops in
the vicinity of the S3 TB. For a given slip bands, the active slip system was thus found possible to change as a function of the macroscopic deformation level.
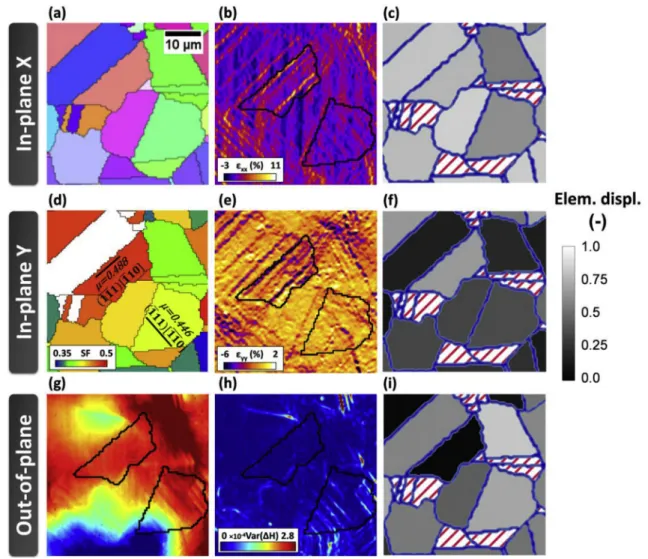
In the present section, the transgranular slip localization will be scrutinized for a large region of 347 grains to document the in-plane and out-of-in-plane characters of each active slip system. In-plane εxxand εyystrain fields as well as out-of-plane variance of
height difference maps are depicted inFig. 7(aec) for 1300 MPa -εp¼ 1.31%. The most intense strain localizations were found at
identical locations for the three representations. While most of the slip bands were identifiable in the εxxstrain field, some differences
in strain assessments were found between the εyystrain field and
the variance of height difference maps. Interestingly, when the strain localization appears particularly strong in εyystrain field, the
discrete out-of-plane deformation was generally weak, and conversely. In addition, the transgranular slip bands follow the
direction described by the highest SF for 94% of all the observed grains. Therefore, the elementary displacement along X, Y and Z directions calculated from EBSD data for the highest Schmid factor for the (111) identified slip plane were reported in Fig. 7(def), respectively. Grains that do not experience slip activity at 1340 MPa - εp¼ 2.57% are represented as striped regions in Fig. 7(def). Interestingly, the values of the glide displacement along X direction appear particularly homogeneous and intense, ranging from 0.4 to 0.8. In comparison, the projections along Y and Z directions were found to be between 0 and 0.7. As for the evaluation of the strain localization between the εyystrain field and the variance of height
difference maps, projection maps along Y and Z directions generally show opposite responses, i.e. “weak gliding amplitude along Y/ strong gliding amplitude along Z00and “strong gliding amplitude
along Y/weak gliding amplitude along Z”. Therefore, the sensitivity for capturing such discrete and three-dimensional deformations depends on the orientation of the glide direction in reference to the different directions investigated via the in-plane DIC (X and Y rections) and the out-of-plane topographic measurements (Z di-rection). While 99% of the active slip bands can be detected with εxx
and εyystrain fields, out-of-plane measurements aimed at detecting
a few cases of non-detected slip activity but more importantly, aimed at identifying active slip system and documenting the
three-Fig. 7. In-plane versus out-of-plane sensitivity of strain localization within system bands (gliding direction of SFmax) for a 1300 MPa e εp¼ 1.31% loading condition: a) εxxstrain field,
(b) εyystrain field, (c) variance of height difference maps. Theoretical elementary displacement for the highest Schmid factor slip system along (d) X direction, (e) Y direction, and (f)
Z direction. Red hatched regions correspond to grains without distinguishable slip bands. (For interpretation of the references to color in this figure legend, the reader is referred to the Web version of this article.)
dimensional gliding that solely in-plane DIC could not assess. The sensitivity study of the in-plane DIC versus out-of-plane variance of the height difference representations to document deformation within slip bands has been investigated more closely inFig. 8for two grains of interest. This region exhibits a plastified grain with in-plane but not out-of-plane slip localization, and inversely a grain depicting out-of-plane but weak in-plane strain localization. The amplitude of the glide displacement projected along the intended X, Y, and Z directions falls with the expected observations showing that slip systems involving low-in-plane character necessarily require out-of-plane measurements to document the magnitude of the intensity. Both in-plane and out-of-plane intense strain localizations were evidenced at the sub-grain level with the HR-LSCM-DIC technique. The simultaneous in-plane and out-of-in-plane measurements added a significant value for detection of the discrete shearing mechanisms experienced during crystal plasticity.
4. Micromechanical deformation due to crystal plasticity 4.1. Macroscopic deformation up to Y.S.0.2%
Irreversible strain localization within slip bands is observable
with the use of in-plane HR-LSCM-DIC for samples deformed in the macroscopic elastic domain. A total of 35 and 58 slip bands are identifiable on the global ROI (347 grains in total) for the steps of 1000 MPa e εp¼ 0.024% and 1100 MPa e εp¼ 0.053%, giving a
density of 565 and 935 active slip bands per mm2, respectively.
Strain localization was mostly encountered near and parallel to S3 twin boundaries (S3 TBs), as shown inFig. 3(a, d, g). However, other less common cases were found: slip bands developing (i) near grain boundaries, and (ii) within grains in a transgranular manner. The identified slip bands were classified into the three categories aforementioned. The ratio of slip bands near S3 TBs compared to the total number of slip bands observed indicates that S3 TBs are of preference for the strain localization in the macroscopic elastic domain. Indeed, the present ratio is 26/35 (74%) for 1000 MPa e εp¼ 0.024% and 35/58 (60%) for 1100 MPa e εp¼ 0.053%. With increasing macroscopic strain, the strain intensity of existing slip bands increases and additional slip bands form. In the macroscopic elastic domain, the strain localization is confined in the sheared grain close to the S3 TBs, without transmission to the adjacent grains on both sides of the S3 TBs. Higher strain intensity was found near twin boundaries via in-plane measurement compared to near grain boundaries or within grains. Since strain localization in the vicinity of S3 TBs appears to be the dominant, a closer
Fig. 8. Region showing in-plane but not out-of-plane slip localization, and conversely a region showing out-of-plane but weak in-plane strain localization: (a) IPF map in reference to the loading direction, (b) εxxstrain field, (c) theoretical elementary displacement along the x direction, (d) Schmid factor map and identification of the active slip system on each
grain of interest, (e) εyystrain field, (f) theoretical elementary displacement along the y direction, (g) height difference map, (h) variance of the height difference map, and (i)
analysis of the role of the microstructural features favoring slip activity is warranted.
Two different regions will be presented in the following sections to address the criteria for local irreversible deformation in the macroscopic domain: (i) high Schmid factor (
m
¼ 0.484) with low difference of elastic modulus (D
E ¼ 5 GPa) between the pair of twins, as shown in Fig. 9(aec), and (ii) low Schmid factor (m
¼ 0.321) with high difference of elastic modulus (D
E ¼ 137 GPa) between the pair of twins, as seen inFig. 9(def). The elastic moduli were calculated for the grains in the map according to the macro-scopic loading direction from EBSD measurements with the compliance matrix, as detailed in Ref. [32]. A high elastic modulus disparity between the pair of twins can thus promote local strain redistribution and slip initiation, as reported by Stinville et al. [2,3]. For every pair of twins observed in the region of interest, the corresponding modulus difference (D
E) in the loading direction is plotted inFig. 10as a function of the common SF for parallel slip configurations. The black dashed curve represents the theoretical maximal E difference for a given common SF for parallel slip con-figurations. Activated systems for different pair of twins are shown in black (square) and red (triangle) for a macroscopic strain of εp¼ 0.024% and εp¼ 0.053%, respectively. In gray (circle) are all the twin pairs without any noticeable slip traces on the twin boundary. Slip traces are systematically observed on twin pairs with high SF and low E difference. Conversely, moderate SF and high E differ-ences can also promote slip initiation. On the other hand, some pairs of twins with high SF and high E differences do not exhibit slip activity (green domain inFig. 10), whereas moderate SF (m
>0.3) with low E differences could also promote slip activity, as shown in the ellipse at the bottom right of the figure.4.2. Plastic deformation
In the present section, sub-grain irreversible deformation in the macroscopic plastic domain is examined. The slip density for different strain localization configurations, i.e. near twin
boundaries, near grain boundaries, and transgranular, are reported for all the loading conditions inTable 2. Above the macroscopic yield strength, the newly developed slip bands are mostly trans-granular and more grains plastified with load increase. For 94% of all the observed grains, the transgranular slip bands follow the direction described by the highest SF and gliding run across the whole grain, from grain boundary to grain boundary. The slip density for the transgranular strain localization configuration significantly increases above Y.S.0.2%. In this plastic deformation
regime, a second slip system is often activated, participating to an increase of the transgranular slip activity. The Schmid factor for the
Fig. 9. (a)(d) εxxstrain fields for a macroscopic strain of εp¼ 0.024% showing slip bands parallel to twin boundaries. (b)(e) SF of involved grains for the system with slip orientation parallel to the twin boundary. (c)(f) Elastic modulus maps in the loading direction for each grain. It is shown that a high SF at the twin boundary promotes slip initiation as well as a low SF if the difference of elastic modulus between the pair of twins is high.
Fig. 10. A plot of the E differences as a function of the common SF for slip systems parallel to the twin boundary for all pairs of twins in the observed region is shown in gray (circle). The pair of twins with visible slip traces at εp¼ 0.024% macroscopic strain is shown in black (square). The additional pair of twins with visible slip traces at εp¼ 0.053% macroscopic strain is shown in red (triangle). (For interpretation of the references to color in this figure legend, the reader is referred to the Web version of this article.)
second active slip system was found particularly high and compa-rable to the one of the primary active slip system (
m
z0.4). As far as strain localization in the vicinity of twin boundaries and grain boundaries are concerned, new plastified locations appear when the applied stress increases. However, it is worth mentioning that the increase of slip density for both strain localization configura-tions considerably slows down and tends to saturate above the macroscopic yield strength of the material, relative to the trans-granular slip activity.The fractional distribution of each type of slip band is plotted as a function of the irreversible macroscopic strain inFig. 11(a). In the macroscopic elastic deformation domain, slip events near twin boundaries are predominant with a fraction of nearly 75% at 80% of Y.S.0.2%. With load increase, the deformation mechanism shifts to
transgranular slip with a rapid transition roughly around Y.S.0.2%. At
0.22% plastic strain, transgranular slip bands represent 67% of the strain localization sites while the near twin boundaries configura-tion drops down to 25%. In all cases, strain localizaconfigura-tion near grain boundaries is a low-represented configuration and its fraction distribution gradually decreases from 15 to 5% in the present deformation range. The fraction of each slip types tends to stabilize above the 1300 MPa - εp¼ 1.31% loading condition.
Grains experiencing transgranular strain localization were plotted on the standard triangle in reference to the macroscopic loading direction (Fig. 11(b)). The color code associates each point to the loading condition at which the onset of strain localization was observed. In the low stress/strain regime, i.e. below the macroscopic Y.S.0.2%(up to 1100 MPa - εp¼ 0.053%), the onset of transgranular strain localization was found to develop for slip systems with SF values higher than 0.43 (black squares and red triangles). However, most of the grains with higher SF did not experience transgranular strain localization below Y.S.0.2%.
There-fore, a high SF is a necessary but not sufficient criterion to docu-ment transgranular strain localization at low stress/strain, in such a FCC polycrystalline and twinned material. Beyond yielding, trans-granular strain localization develops in grains regardless of their crystallographic orientation, i.e. their Schmid factor. Interestingly, in all observed grains via in-plane measurement, the slip bands near twin boundaries are 1.7e3.7 higher in intensity than trans-granular ones for both the loading conditions (Figs. 3and7).
As a summary of the present findings, strain localization in the vicinity of S3 TBs is more intense compared to that of transgranular slip bands. However, the number plastified regions in the vicinity of S3 TBs is much lower than for transgranular grains containing bands beyond yielding. Transgranular slip localization follows the highest Schmid factor, but slip localization at twin boundaries does
not necessarily obey this criterion. Transgranular strain localization is the main contribution responsible for the macroscopic plastic deformation beyond yielding.
5. Discussion
5.1. Technical considerations for the HR-LSCM-DIC technique The 405 nm-wavelength LSCM technique allows for an inter-esting in-plane and out-of-plane resolution due to the conjunction of both the diffraction limit of the blue light (Airy pattern radius ¼ 263 nm) but also the fine height pitch of 60 nm, leading to an estimated out-of-plane resolution of 12 nm. The pixel size of the acquired micrographs, 31 $ 31 nm2, is smaller than the diffraction
limit of the present optical setup, making the speckle pattern slightly blurred. Since the speckle pattern was fine enough and invariant, small subsets with few distinguishable features are possible to track via HR-LSCM-DIC. In addition, the digital image correlation technique that quantifies sub-pixel displacements makes the in-plane sensitivity slightly higher than the one estab-lished by the pixel size. In the end, it is worth noting that the HR-LSCM-DIC technique possessed sufficient in-plane and out-of-plane resolution and repeatability to detect kinematical
Fig. 11. (a) Fraction distribution (in %) of the different types of slip bands observed as a function of the macroscopic strain showing an abrupt transition from near twin boundaries to transgranular slip localization on both sides of Y.S.0.2%. (b) Chronological
history of transgranular slip occurrence reported in the standard triangle for consec-utive loading levels. The onset of transgranular strain localization was found for relatively high Schmid factor's values (m>0.43).
Table 2
Slip density for different strain localization configurations, including near twin boundaries, near grain boundaries, and transgranular, for increasing loading levels.
Loading condition Slip localization density (mm#2)
Near twin boundaries Near grain boundaries Transgranular 1000 MPa -εp¼ 0.024% 419 81 64 1100 MPa -εp¼ 0.053% 563 161 177 1200 MPa -εp¼ 0.22% 966 370 2883 1300 MPa -εp¼ 1.31% 1466 757 16702 1340 MPa -εp¼ 2.57% 1820 902 24015
discontinuities at the sub-grain level in a fine-grain polycrystalline material (Figs. 3e9). As a comparison, previous optical-DIC studies reported in the literature were capable of detecting intense strain localization in polycrystalline materials at the sub-grain level for particular crystallographic configurations but in a more diffuse manner, not representative of the physical mechanisms involved in the crystal plastic deformation, i.e. slip activity within diffuse slip bands [15e17]. Similar diffuse kinematical fields were obtained with conventional SEM-DIC means [18e20], despite a much higher spatial resolution. The assessment of such discrete crystal plastic deformations was hitherto possible only via high resolution-scanning electron microscopy-digital image correlation (HR-SEM-DIC) technique due to mostly a higher spatial resolution and distortion corrections [4e6,14,22,23]. The HR-LSCM-DIC technique is thus particularly interesting for investigating slip activity due to the additional out-of-plane information and its speed/resolution ratio.
In the present investigation, two sets of information, i.e. in-tensity and height micrographs, were systematically acquired with LSCM in order to assess in-plane and out-of-plane kinematical fields, respectively. This approach distinguishes itself from topo-graphic DIC using solely height measurements, as proposed by Bertin et al. [27]. The authors purposely developed a topographic patterning technique to deposit coarse drops of platinum at the surface of the specimen using focused ion beam (FIB) in order to apply a global DIC algorithm to measure the 3D surface displace-ment field at the sub-grain level. While evidencing slip activity in grains surrounding the ROI after application of the systematic error corrections, the technique was yet not successful in capturing 3D kinematical discontinuities using global DIC. In the present study, the generation of a dense, very fine and highly contrasted speckle pattern permitted documentation of localized kinematical mea-surements at the order of the nanometers in scale. The present speckle technique is more appropriate for HR-DIC techniques. In that way, comparing in-plane measurements from HR-LSCM-DIC intensity maps with 3D surface displacement fields would be worth further investigation.
The direct observation of slip emergence at the surface using raw height data is altered by the speckling technique. To this extent, the height difference method was thus developed to avoid such height artifacts, making discrete out-of-plane kinematical discon-tinuities possible to characterize using variance filters (Figs. 4e8). The technical implementations developed in the present study now allows the HR-LSCM-DIC technique to situ document both in-plane and out-of-in-plane kinematical discontinuities at the sub-grain level. Some scanning and vibration artifacts were yet found on εxxstrain fields but not on εyystrain fields inFig. 3but do not
introduce systematic errors. As for SEM, the intensity of such arti-facts was found dependant on the scanning strategy in relation to the strain field component. Artifacts were found more pronounced when the line-scanning direction is orthogonal to the strain component (εxxstrain fields) compared to scanning strategies with
the line-scanning direction parallel to the strain component (εyy
strain fields). While scanning artifacts are slightly different with SEM techniques, i.e. scan line shift artifacts due to positioning er-rors, similar strategies can be used to correct them and improve confocal strain measurements: (i) using global DIC to numerically correct such periodic artifacts [33], (ii) using a numerical scanning rotation of 90"[5], or (iii) physically rotating the specimen of 90"
and working on two sets of images, each set with the line-scanning direction parallel to the two in-plane strain components (εxxand εyy
strain fields). The two latter techniques present the advantage not modifying the raw data of the images. The physical rotation of the specimen is possible using in-situ LSCM means but requires a precise positioning and a particular attention in handling due to
cluttering and connectors. As far as the scanning rotation is con-cerned, LSCM scanning technology generally consists in one or two 1D galvanometer mirrors, making the scanning repeatability physically dependant of the orientation of the galvanometer mir-rors. In the specific case of the LEXT OLS41000, an electromagnetic MEMS scanner handles the X direction, while a high-precision Galvano mirror takes care of scanning in the Y direction [34]. For SEM, the 2D scanning is operated by scanning coils, whose repeatability is nearly isotropic. Therefore, using numerical scan-ning rotation with LSCM means is not physically valuable, contrary to SEM means since the LSCM scanning sensitivity depends on the orientation of the galvanometers and mirror pivot. To circumvent such orientation dependant scanning strategies, alternative scan-ning solutions using an intricate engine driving four independent mirrors is also proposed [35]. In addition, the LSCM technique was found very sensitive to any type of vibrations at such high magni-fications (magnimagni-fications higher than $50). Therefore, using in-situ tensile LSCM within a vibration-proof enclosure such as atomic force microscopy enclosure or passive (springs) or active anti-vibration tables could also improve the scanning repeatability. Despite the LSCM technique could be improved for such high magnification-high resolution application, it is important to keep in mind that this optical approach is accurate and repeatable enough to identify slip events that most conventional SEM based tech-niques cannot assess.
Both the intensity and height micrographs are algorithmically reconstructed images made of line-by-line and layer-by-layer in-formation. While the line-by-line scanning strategy is fixed by the image resolution, i.e. 4096 $ 4096 pixel2, the height pitch can be adapted to any value between 10 nm to tens of micrometers. With finer the height pitch, there is reduced noise but higher acquisition and post-treatment cost. While the height pitch directly affects the quality of the height micrograph, its effect on the image repro-ducibility and systematic errors of the intensity micrographs is not obvious and needs further investigation. In the present paper, the scanning parameters were selected to have the highest in-plane numerical resolution (4096 $ 4096 pixel2) with a constant height
pitch of 60 nm to allow fast enough image acquisition (4e5 to 6e8 min per micrograph) with a height resolution compatible with the discrete out-of-plane height variation to evidence.
5.2. In-plane and out-of-plane kinematical measurements for slip system identification
The joint information of in-plane and out-of-plane discrete displacements obtained by the HR-LSCM-DIC technique enabled quantification of the three-dimensional relative rigid translation from both sides of a slip band due to shearing (Fig. 6). This three-dimensional glide corresponds to the accumulation of Burgers vectors of individual slip systems and only a three-dimensional description allows the characterization of the amount of slip ac-tivity. For a given slip system, the projection of the Burgers vector along the X, Y and Z directions defined the in-plane or out-of-plane character of glide, as depicted inFigs. 6e8. For instance, the pro-jections of the Burgers vector for the slip system presenting the highest Schmid factor is illustrated inFig. 7. For this particular case, i.e.slip system having the highest Schmid factor, the colinearity relationship between the gliding and the loading direction shows a particularly homogeneous amplitude of the glide displacement in the X direction (the macroscopic loading direction) compared to the Y and Z projections, depicting more variability. With the HR-LSCM-DIC technique, it was possible to in-situ identify the proper active slip systems involved in the shearing process in individual grains as well as real accumulated displacements. Such slip system identification is not possible using solely conventional in-plane DIC
methods at the sub-grain level due to the continuum mechanics approach affecting the displacement values in the vicinity of the discontinuity. In order to better remedy such issues with discrete slip systems, a discontinuity-tolerant Heaviside-DIC method has recently been developed in order to in-situ evaluate active slip system via in-plane HR-SEM-DIC, making that the assumption the out-of-plane response necessarily follows the accumulated Burgers vector for one active slip system per slip band [14]. Applying the discontinuity-tolerant Heaviside-DIC method to LSCM data would be worth investigation to dismiss all assumptions on the out-of-plane deformation. Such an analysis will be conducted in a further investigation in order to statistically and quantitatively document the in-plane versus out-of-plane response of each slip band in the 347 grains studied.
As the glide direction is a vector quantity, the ease of identifying in-plane versus out-of-plane displacements depends on the grain orientation in relation to the loading direction and also on ampli-tude. In most cases, in-plane strain localization within a slip band can be identified via εxxstrain fields, which are also visible in
out-of-plane measurements and also in εyystrain fields (Fig. 7). In the
present investigation, the simultaneous analysis of in-plane and out-of-plane kinematical discontinuities was found particularly useful since strain localization within grains with specific crystal-lographic orientation (with glide directions near normal to the surface) was identifiable via out-of-plane measurement and not visible via in-plane measurements (Fig. 8). The inverse case was also verified. The proper identification of all active slip planes thus requires three-dimensional measurements of the gliding direction that solely in-plane measurements could not provide.
Three-dimensional measurement of the glide direction was found necessary for the case of parallel slip bands within the same grain exhibiting different in-plane/out-of-plane displacement ratio from band to band (Figs. 4e6). In this particular case, the top grain experienced both near-S3 TB and transgranular strain localization at a macroscopic loading close to Y.S.0.2%. The strain localization was
found particularly intense in the vicinity of the S3 TB and weak for transgranular slip bands on the εxxstrain field (Figs. 4(b) and6)
while not visible and intense on the variance of the height differ-ence map (Figs. 4(h) and6), respectively. It was thus found that for a similar slip plane, two active slip systems can be activated in the same grain. In this specific case, the slip systems associated with the near-S3 TB and transgranular strain localization were ð111Þ½101) and ð111Þ½110) with similar Schmid factor values of 0.430 and 0.432, respectively. The ð111Þ½101) slip system was found to have a particularly low out-of-plane character while the one of the ð111Þ½110) slip system is very intense, as reported inTable 1. Interestingly, out-of-plane displacements develop further in the vicinity of the S3 TB at higher stress levels (Fig. 4(c and i) and
Fig. 6(c and e)). Using the elementary displacement approach on both sides of slip bands, it is worth noting that two active slip systems could coexist for a given slip band at room temperature for the near S3 TB slip activity (Fig. 6).
5.3. Strain localization in polycrystalline and twinned materials in different loading regimes
The material candidate was purposely chosen in the present investigation in order to document strain localization at the sub-grain level in a FCC polycrystalline material containing a high density of annealing twins. The fine-grain microstructure was selected to demonstrate the applicability of HR-LSCM-DIC tech-nique to high strength materials designed to withstand fatigue loadings. Strain localization was found to develop in one of the three configurations, i.e. near twin boundaries, near grain bound-aries or in a transgranular manner (Figs. 9e11). The systematic
analysis of slip activity in 347 grains aimed at demonstrating a clear transition of microplasticity behavior for loading conditions below and above Y.S.0.2%. Below Y.S.0.2%, strain localization mainly
de-velops in the vicinity of twin boundaries due to either a high SF or a low SF coupled with a high difference in Young's modulus on both sides of the twin boundaries (Fig. 10andTable 2). Twins, and more precisely twin boundaries, were found particularly prone to crack initiation in high twin containing superalloys subjected to fatigue loading, either in VHCF or LCF loading conditions where strain amplitudes are low [2,3,36]. Due to relatively high elastic anisot-ropy at the grain level in Ni-based superalloys, intense strain/stress localization in the elastic domain raises near grain boundaries and even more near twin boundaries [32]. Such intense elastic strain concentration close to twin boundaries was experimentally demonstrated using in-plane HR-SEM-DIC techniques [5]. There-fore, assessing such slip events at the sub-grain level in the high end of the macroscopic elastic domain is necessary for fatigue life prediction. In addition, few transgranular strain localization sites develop in grains having a relatively high SF (
m
>0.43), as shown inFig. 11(b). For loading conditions at or above Y.S.0.2%, transgranular
strain localization is the predominant mechanism (Fig. 11(a) and
Table 2), while the local amplitude of the shearing deformation is higher close to twin boundaries. For the transgranular strain localization configuration, it is worth noting that 94% of the slip bands correspond to slip systems with the highest Schmid factor.
Overall, the HR-LSCM-DIC technique allows for a chronological identification of plastic microdeformation mechanisms at the sub-grain level for various loading conditions, as shown inFig. 6. Such identification of crystal plasticity is particularly useful to define microstructural criteria favorable to crack initiation under cyclic stresses in various loading regimes. In addition, this approach, paired with global DIC algorithms, could also be a step forward for integrated crystal plasticity codes, taking into account the local slip activity obtained with the simultaneous in-plane and out-of-plane response of individual grains.
6. Conclusions
High resolution-laser scanning confocal microscopy (HR-LSCM) combined with digital image correlation (DIC) was used to simul-taneously assess in-plane and out-of-plane discrete deformation of individual grains at the sub-grain level due to slip activity. The HR-LSCM-DIC technique demonstrated a capability to document kinematical in-plane and out-of-plane discontinuities on mm-scaled statistically representative areas with an accuracy of tens of nanometers in the three dimensions. This technique provides information on the shearing mechanism at the microscopic level, thus allowing a better identification of the glide direction, that conventional in-plane full-field measurements are not capable of identifying. The three-dimensional characterization of the glide direction was found necessary to document the onset of strain localization for loading in the high end of the macroscopic elastic regime, i.e. when slip does not follow the highest Schmid factor criterion according to the macroscopic loading direction. This method, applied on a polycrystalline and twinned FCC material, showed that the onset of strain localization developed in the vi-cinity of and parallel to twin boundaries for deformations in the macroscopic elastic domain while transgranular strain localization is the predominant slip mechanism above the yield strength of the material.
Acknowledgements
The authors acknowledge the Minist"ere de l’!Economie, de la Science et de l’Innovation du Qu!ebec for the grant attributed via the
Research Support Program (PSR), Component 4: Support for In-ternational Research and Innovation Initiatives (SIIRI-954) on the “Optimization of functional graded properties for aeronautic ap-plications”. The authors are particularly grateful to prof. E. ANDRIEU from CIRIMAT laboratory for stimulating discussions. T.M. Pollock acknowledges the support of a Vannevar Bush Fellowship, ONR Grant N00014-18-1-3031.
References
[1] J. Schr€oder, K. Hackl, Plasticity and beyond: Microstructures, Crystal-Plasticity and Phase Transitions, Springer, 2014, https://doi.org/10.1007/978-3-7091-1625-8.
[2] J.C. Stinville, W.C. Lenthe, J. Miao, T.M. Pollock, A combined grain scale elastic-plastic criterion for identification of fatigue crack initiation sites in a twin containing polycrystalline nickel-base superalloy, Acta Mater. 103 (2016) 461e473,https://doi.org/10.1016/j.actamat.2015.09.050.
[3] J.C. Stinville, W.C. Lenthe, M.P. Echlin, P.G. Callahan, D. Texier, T.M. Pollock, Microstructural statistics for fatigue crack initiation in polycrystalline nickel-base superalloys, Int. J. Fract. 208 (2017) 221e240,https://doi.org/10.1007/ s10704-017-0241-z.
[4] F. Bridier, J.-C. Stinville, N. Vanderesse, P. Villechaise, P. Bocher, Microscopic strain and crystal rotation measurement within metallurgical grains, Key Eng. Mater. 592e593 (2013) 493e496,https://doi.org/10.4028/www.scientific.net/ KEM.592-593.493.
[5] J.C. Stinville, M.P. Echlin, D. Texier, F. Bridier, P. Bocher, T.M. Pollock, Sub-grain scale digital image correlation by electron microscopy for polycrystalline materials during elastic and plastic deformation, Exp. Mech. 56 (2016) 197e216,https://doi.org/10.1007/s11340-015-0083-4.
[6] F. Di Gioacchino, J. Quinta Da Fonseca, An experimental study of the poly-crystalline plasticity of austenitic stainless steel, Int. J. Plast. 74 (2015) 92e109,
https://doi.org/10.1016/j.ijplas.2015.05.012.
[7] A. Guery, F. Hild, F. Latourte, S. Roux, Slip activities in polycrystals determined by coupling DIC measurements with crystal plasticity calculations, Int. J. Plast. 81 (2016) 249e266,https://doi.org/10.1016/j.ijplas.2016.01.008.
[8] P. Villechaise, L. Sabatier, J.C. Girard, On slip band features and crack initiation in fatigued 316L austenitic stainless steel: Part 1: analysis by electron back-scattered diffraction and atomic force microscopy, Mater. Sci. Eng. A. 323 (2002) 377e385,https://doi.org/10.1016/S0921-5093(01)01381-8. [9] C.J. Boehlert, H. Li, L. Wang, B. Bartha, Slip system characterization of Inconel
718, Adv. Mater. Process. (2010) 41e45.
[10] S. H!emery, V.T. Dang, L. Signor, P. Villechaise, Influence of microtexture on early plastic slip activity in Ti-6Al-4V polycrystals, Metall. Mater. Trans. A Phys. Metall. Mater. Sci. 49 (2018) 2048e2056, https://doi.org/10.1007/ s11661-018-4569-4.
[11] J.C. Stinville, N. Vanderesse, F. Bridier, P. Bocher, T.M. Pollock, High resolution mapping of strain localization near twin boundaries in a nickel-based su-peralloy, Acta Mater. 98 (2015) 29e42, https://doi.org/10.1016/ j.actamat.2015.07.016.
[12] C.A. Stein, A. Cerrone, T. Ozturk, S. Lee, P. Kenesei, H. Tucker, R. Pokharel, J. Lind, C. Hefferan, R.M. Suter, A.R. Ingraffea, A.D. Rollett, Fatigue crack initi-ation, slip localization and twin boundaries in a nickel-based superalloy, Curr. Opin. Solid State Mater. Sci. 18 (2014) 244e252,https://doi.org/10.1016/ j.cossms.2014.06.001.
[13] M. Petrenec, K. Obrtlík, J. Pol!ak, J. Man, Dislocation structures in nickel based superalloy Inconel 792-5A fatigued at room temperature and 700"C, Mater.
Sci. Forum 567e568 (2008) 429e432, https://doi.org/10.4028/www.scienti-fic.net/MSF.567-568.429.
[14] F. Bourdin, J.C. Stinville, M.P. Echlin, P.G. Callahan, W.C. Lenthe, C.J. Torbet, D. Texier, F. Bridier, J. Cormier, P. Villechaise, T.M. Pollock, V. Valle, Mea-surements of plastic localization by heaviside-digital image correlation, Acta Mater. 157 (2018) 307e325,https://doi.org/10.1016/j.actamat.2018.07.013. [15] M. Sachtleber, Z. Zhao, D. Raabe, Experimental investigation of plastic grain
interaction, Mater. Sci. Eng. A. 336 (2002) 81e87,https://doi.org/10.1016/ S0921-5093(01)01974-8.
[16] J. Carroll, W. Abuzaid, J. Lambros, H. Sehitoglu, An experimental methodology to relate local strain to microstructural texture, Rev. Sci. Instrum. 81 (2010) 083703-1e083703-9,https://doi.org/10.1063/1.3474902.
[17] W.Z. Abuzaid, M.D. Sangid, J.D. Carroll, H. Sehitoglu, J. Lambros, Slip transfer and plastic strain accumulation across grain boundaries in Hastelloy X, J. Mech. Phys. Solids 60 (2012) 1201e1220, https://doi.org/10.1016/ j.jmps.2012.02.001.
[18] P. Doumalin, M. Bornert, Micromechanical applications of digital image cor-relation techniques, in: P. Jacquot, J.-M. Fournier (Eds.), Interferom. Speckle Light Theory Appl., 2000, pp. 67e74. https://doi.org/10.1007/978-3-642-57323-1_9.
[19] F. Lagattu, F. Bridier, P. Villechaise, J. Brillaud, In-plane strain measurements on a microscopic scale by coupling digital image correlation and an in situ SEM technique, Mater. Char. 56 (2006) 10e18, https://doi.org/10.1016/ j.matchar.2005.08.004.
[20] M.A. Sutton, N. Li, D.C. Joy, A.P. Reynolds, X. Li, Scanning electron microscopy for quantitative small and large deformation measurements Part I: SEM im-aging at magnifications from 200 to 10,000, Exp. Mech. 47 (2007) 775e787,
https://doi.org/10.1007/s11340-007-9042-z.
[21] M.A. Sutton, J.J. Orteu, H.A. Schreier, Image Correlation for Shape, Motion and Deformation Measurements, 2009, https://doi.org/10.1017/ CBO9781107415324.004.
[22] F. Di Gioacchino, J. Quinta da Fonseca, Plastic strain mapping with sub-micron resolution using digital image correlation, Exp. Mech. 53 (2013) 743e754,
https://doi.org/10.1007/s11340-012-9685-2.
[23] J.C. Stinville, M.P. Echlin, P.G. Callahan, V.M. Miller, D. Texier, F. Bridier, P. Bocher, T.M. Pollock, Measurement of strain localization resulting from monotonic and cyclic loading at 650 +C in nickel base superalloys, Exp. Mech. 57 (2017) 1289e1309,https://doi.org/10.1007/s11340-017-0286-y. [24] Z. Chen, S.H. Daly, Active slip system identification in polycrystalline metals
by digital image correlation (DIC), Exp. Mech. 57 (2017) 115e127,https:// doi.org/10.1007/s11340-016-0217-3.
[25] O. Wouters, W.P. Vellinga, R. Van Tijum, J.T.M. De Hosson, On the evolution of surface roughness during deformation of polycrystalline aluminum alloys, Acta Mater. 53 (2005) 4043e4050,https://doi.org/10.1016/j.actamat.2005.05. 007.
[26] J. Lackmann, T. Niendorf, M. Maxisch, G. Grundmeier, H.J. Maier, High-reso-lution in-situ characterization of the surface evoHigh-reso-lution of a polycrystalline NiTi SMA-alloy under pseudoelastic deformation, Mater. Char. 62 (2011) 298e303,
https://doi.org/10.1016/j.matchar.2010.12.008.
[27] M. Bertin, C. Du, J.P.M. Hoefnagels, F. Hild, Crystal plasticity parameter iden-tification with 3D measurements and integrated digital image correlation, Acta Mater. 116 (2016) 321e331,https://doi.org/10.1016/j.actamat.2016.06. 039.
[28] N. Vanderesse, M. Lagac!e, F. Bridier, P. Bocher, An Open Source Software for the Measurement of Deformation Fields by Means of Digital Image Correla-tion, 2013,https://doi.org/10.1017/S1431927613006090.
[29] A. Tatschl, O. Kolednik, A new tool for the experimental characterization of micro-plasticity, Mater. Sci. Eng. A. 339 (2003) 265e280, https://doi.org/ 10.1016/S0921-5093(02)00111-9.
[30] Y. Guilhem, S. Basseville, F. Curtit, J.M. St!ephan, G. Cailletaud, Numerical analysis of the effect of surface roughness on mechanical fields in poly-crystalline aggregates, Model. Simulat. Mater. Sci. Eng. 26 (2018),https:// doi.org/10.1088/1361-651X/aab217.
[31] S. Preibisch, S. Saalfeld, P. Tomancak, Globally optimal stitching of tiled 3D microscopic image acquisitions, Bioinformatics 25 (2009) 1463e1465,https:// doi.org/10.1093/bioinformatics/btp184.
[32] W. Hermann, H.G. Sockel, J. Han, A. Bertram, Elastic properties and determi-nation of elastic constants of nickel-base superalloys by a free-free beam technique, in: Superalloys 1996, Champion (USA), 1996, pp. 229e238. [33] S. Maraghechi, J.P.M. Hoefnagels, R.H.J. Peerlings, M.G.D. Geers, Correction of
scan line shift artifacts in scanning electron microscopy: an extended digital image correlation framework, Ultramicroscopy 187 (2018) 144e163,https:// doi.org/10.1016/j.ultramic.2018.01.002.
[34] Olympus, Technical Data: 3D Measuring Laser Microscope OLS4100 LEXT, 2013.
[35] David van Duinen, Designing a Laser Scanning Confocal Microscope: a New Scan Engine Layout, Bachelor's Thesis, 2013, pp. 1e38,http://essay.utwente. nl/63632/1/BSc_David_van_Duinen.pdf.
[36] D. Texier, J. Cormier, P. Villechaise, J.C. Stinville, C.J. Torbet, S. Pierret, T.M. Pollock, Crack initiation sensitivity of wrought direct aged alloy 718 in the very high cycle fatigue regime: the role of non-metallic inclusions, Mater. Sci. Eng. A. 678 (2016) 122e136,https://doi.org/10.1016/j.msea.2016.09.098.