HAL Id: hal-01688102
https://hal.archives-ouvertes.fr/hal-01688102
Submitted on 4 May 2018
HAL is a multi-disciplinary open access
archive for the deposit and dissemination of
sci-entific research documents, whether they are
pub-lished or not. The documents may come from
teaching and research institutions in France or
abroad, or from public or private research centers.
L’archive ouverte pluridisciplinaire HAL, est
destinée au dépôt et à la diffusion de documents
scientifiques de niveau recherche, publiés ou non,
émanant des établissements d’enseignement et de
recherche français ou étrangers, des laboratoires
publics ou privés.
Hydrothermal conversion of glucose in multiscale batch
processes. Analysis of the gas, liquid and solid residues
Qian Michelle Yu-Wu, Elsa Weiss-Hortala, Radu Barna
To cite this version:
Qian Michelle Yu-Wu, Elsa Weiss-Hortala, Radu Barna. Hydrothermal conversion of glucose in
mul-tiscale batch processes. Analysis of the gas, liquid and solid residues. Journal of Supercritical Fluids,
Elsevier, 2013, 79 (SI), pp.76-83. �10.1016/j.supflu.2013.03.003�. �hal-01688102�
Hydrothermal conversion of glucose in multiscale batch processes. Analysis of
the gas, liquid and solid residues
Qian Michelle Yu-Wu, Elsa Weiss-Hortala
∗, Radu Barna
Université de Toulouse, Mines Albi, CNRS UMR 5302, Centre RAPSODEE, Campus Jarlard, F-81013 Albi Cedex 09, France
Keywords: Glucose Supercritical water Characterization Batch reactor Hydrogen
a b s t r a c t
Hydrothermal conversion is an interesting process to transform (very) humid biomass into high energy vectors or valuable products in the liquid or solid state. In the supercritical domain, water becomes a solvent for organics as well as a reactant, and thus the cellulosic content is effectively hydrolyzed into glucose, largely considered as its model molecule.
The kinetics of glucose decomposition during the heating step in the batch reactor were investigated through the analysis of glucose concentration. Glucose reacts totally before reaching the supercritical point of water. Among the operating parameters that influence supercritical water gasification, this paper presents only the effect of reaction temperature through gas composition, liquid carbon content and structure of the solid. Glucose gasification in a batch process (5 wt% glucose, 0.5 wt% catalyst, 600◦C,
25 MPa, 60 min) produced 1.5 mol of hydrogen per mol of glucose. The gas has energetic properties (H2,
CH4, C2H6) while the liquid contains substances that could be used as platform molecules (5-HMF). The
solid phase is composed of carbon (almost pure) in two distinct phases: spherical nanoparticles and an amorphous phase.
1. Introduction
The accelerated demand and processing of raw materials and fossil energies is correlated to the observed depletion of resources and has global harmful effects: climate change etc. New tech-nologies should be designed to operate more efficiently with raw materials and to reduce the impact of residues and waste. Sus-tainability is one of the most important challenges for industrial processes. One of the ways to achieve it is the development of an ecological economy, based on the circular structure of mass and energy flow.
Among the renewable energy and material sources, biomass has a central position. According to the EU definition, biomass repre-sents the biodegradable fraction of products, waste and residues from biological origin as well as of industrial and municipal waste
[1]. Biomass is mainly composed of C, H and O, containing other elements like N, P, S, etc. The huge variety of organic substances, associated more or less with metals, salts, water, etc. has allowed the implementation of a large number of traditional industrial pro-cesses converting specific classes of biomass into valuable products.
∗ Corresponding author at: RAPSODEE Center Ecole des Mines d’Albi-Carmaux, Route de Teillet, Campus Jarlard, F-81013 Albi Cedex 9, France. Tel.: +33 563493145; fax: +33 563493243.
E-mail address:elsa.weiss@mines-albi.fr(E. Weiss-Hortala).
Biomass (wood, organic residues, etc.) could be used for heating and energy production and thus competes with fossil fuels.
The biorefinery approach develops integrated complex transfor-mation processes of biomass into compounds for organic synthesis (platform molecules or building blocks), bioliquids and biofuels
[2]. Among these transformation processes, hydrothermal conver-sion of biomass in supercritical or near critical conditions allows transformation of very humid biomass into valuable gaseous, liquid and solid products, characterized by high energetic (hydrogen, low hydrocarbons) and/or chemical potential[3]. These processes are still under research and development at laboratory and pilot scale
[4]. Water becomes a particular “partner” of the organic species in the system when it is brought near to its critical point: Tc= 374◦C
and Pc= 22.1 MPa[5]. During the transition of the system from
nor-mal to supercritical conditions (where the system is monophasic
[6]), the physico-chemical properties of water change continuously
[7]. The change is dramatic in the region close to the critical point
[5]. The change observed in water properties (dielectric constant, density, ionic product, caloric capacity, etc.) on the path from nor-mal to the supercritical domain[8–10]has important consequences on its dissolving properties[5,10]and reactivity. In the subcritical domain, water favors heterolitic/ionic mechanisms[5,11], like cat-alytic hydrolysis, while in the supercritical domain radical reactions
[12]are favored. Sub/supercritical water is an interesting reactant because it optimizes the reaction rate by a concentration effect and higher temperature, diffusivity and collision yield. In these condi-tions, biomass is converted into various gaseous, liquid and solid
products. Schematically, the relative proportion of the three main elements CxHyOzcan represent the organic part of biomass. In fact,
biomass composition is very diverse: cellulose, lignin, hemicellu-loses, fats, proteins, carbohydrates etc. The reactivity of these dif-ferent classes in sub/supercritical water is difdif-ferent, e.g., cellulose (C6H10O5)n, the main component of the lignocellulosic biomass,
hydrolyses quantitatively to glucose before further conversion. Glucose (C6H12O6) is widely considered as one of the simplest
model molecules of cellulosic biomass, and its conversion in super-critical water was largely investigated in batch and continuous operating reactors[12–19]. The main products of glucose SCW con-version identified in the liquid phase are: furfurals (like 5-hydroxy methyl furfural, 5 HMF), carboxylic acids (formic, acetic, levulinic, etc.), aldehydes (formic, acetic, etc.), etc.[16,20–26], and in the gas phase are: H2and CO2but also CO and different light
hydro-carbons (methane, ethane, propane, etc.)[14]. High temperature and alkaline or metallic catalysts[13,27,28]favor gas production and its hydrogen content, while high glucose concentration and/or pressure limits gasification yield[16–18,23,25,26]. In steady state continuous processes the heating rate of the biomass (e.g., glu-cose) is performed very rapidly, and generally it is accepted that non-converted biomass reacts in the supercritical phase. Super-critical water gasification of glucose has been largely investigated, and different degradation mechanisms have been proposed. Liter-ature data indicate that glucose reacts at temperLiter-atures above the critical point[29]. However glucose reactivity during the heating step has not yet been studied. The assumption of “instantaneous” (flash) heating of the biomass is even less realistic when operating batch reactors with limited (known) heating rate. During autoclave heating, properties of water and the composition of the system are changing, which plays an important role in the relative yield of the different possible reactions (successive, parallel, concurrent, etc.) between the components of the system, i.e., water and the more or less converted organic reactant.
The first part of our paper investigates glucose degradation dur-ing controlled heatdur-ing of the 500 mL stirred batch autoclave. The equipment allows sampling of small aliquots of liquid, which is performed after every 10◦C rise in temperature during heating. We
demonstrated previously that the composition of a glycerol solu-tion arriving in supercritical condisolu-tions have been strongly affected by the heating step[30]and seems to depend on the “history” of its operating parameters (heating rate, contact time, initial filling ratio, etc.). Therefore we studied the glucose degradation rate dur-ing heatdur-ing. Then it was decided to investigate the influence of different operating parameters on batch supercritical conversion of glucose solution: the initial liquid ratio and composition, heating time and/or rate, residence time in supercritical conditions (con-trolled temperature and self-generated pressure in the reactor), etc. Special attention was given to the optimal gasification con-ditions. The experiments have been performed at two autoclave scales, 5 and 500 mL, and the gas produced, liquid and solid phases were characterized.Table 1summarizes the ranges of the operating parameters explored by our project, and detailed results are pre-sented by Yu-Wu[31]. According to our experience, the operating parameter with the greatest influence on gasification yield is the steady temperature of the process. Thereafter we will discuss our main results in this respect.
2. Materials and methods 2.1. Reagents and reactors
Experiments were carried out in two kinds of batch reactors of 5 and 500 mL, filled with accurate predetermined liquid mass (precision 0.1 mg). In both cases, the reaction temperature was
Table 1
Summary of all the experiments done by Yu-Wu[31]in 5 mL batch reactors.
Investigated parameter Investigated
range Constant maintained parameters
T 400–600◦C 25 MPa, 60 min, [glucose] = 5 wt%,
[K2CO3] = 1 wt%
t 5–120 min 600◦C, 25 MPa, [glucose] = 5 wt%,
[K2CO3] = 1 wt%
[glucose] 5–20 wt% 600◦C, 25 MPa, 60 min,
[K2CO3] = 1 wt%
[K2CO3] 0–2 wt% 600◦C, 25 MPa, 60 min,
[glucose] = 5 wt%,
P 20–28 MPa 600◦C, 60 min, [glucose] = 5 wt%,
[K2CO3] = 1 wt%
reached after controlled heating, and the autoclave pressure was auto-generated.
2.1.1. Stirred batch reactor, 500 mL
The stirred batch autoclave (500 mL) was used to study the effect of the heating process on the composition of a pure glucose solu-tion. This reactor is composed of a reaction shell in Inconel 718 (6.5 cm diameter) and an outer shell in stainless steel 316. The elec-tric resistance confined in the stainless steel shell provides heating (maximum rate 20◦C min−1), and cooling is achieved by injecting
cold air in the outer shell (rate 10◦C min−1). The installation was
instrumented to control stirring rate, temperature (bottom and top) and to record inner pressure. The reactor comprises a valve con-nected with a long tube, allowing liquid phase sampling from the bottom zone of the autoclave. Small aliquots of liquid (less than
1 mL) have been collected and analyzed every 10◦C during system
heating, between 20 and 250◦C.
2.1.2. Unstirred mini autoclaves, 5 mL
The mini-autoclaves (5 mL) are not instrumented. Made of 316 stainless steel, their inner and outer diameters are 8.5 and 31.4 mm, respectively. A copper joint was used in order to improve the watertight quality. The volume being low, each experiment was carried out with 5 mini-autoclaves running simultaneously, and average results are presented. The mass of initial solution varied from 0.362 g (T = 600◦C) to 0.847 g (T = 400◦C).
The process was conducted by placing the 5 mini-autoclaves in a muffle oven (Nabertherm L5/11/P320) preheated to target tem-perature. After autoclaves introduction, a heating time of 10 min was necessary in the oven to reach the target temperature. At the end of the set reaction time, autoclaves were cooled down to room
temperature (25 ± 2◦C) for 26 min. Estimated heating and cooling
rates were about 50◦C min−1and respectively 20◦C min−1.
The cooled autoclaves were opened in a special sampling system designed to collect separately the produced gas. The overpressure obtained in the calibrated device by opening the autoclave allows the determination of the amount of gas produced in each autoclave (system volume is 16.7 mL).
2.1.3. Reagents
The processed solutions were prepared with pure water, glu-cose (water free, Prolabo) at 5 wt%, and an alkaline catalyst, K2CO3
(99.0–100.0%, Prolabo) at 0.5 wt%.
2.2. Characterization of gaseous, liquid and solid residues 2.2.1. Gaseous residue
The gas phase (H2, CO2, CO, CH4, etc.) was analyzed by a gas
chromatograph (Agilent GC-3000 with 4 columns and 4 TCD detec-tors). Depending on the column, the carrier gases used were argon or helium. The average compositions of the 5 mini-autoclaves
Fig. 1. Temperature and pressure profiles as function of time obtained experimen-tally during the heating of a glucose solution in the 500 mL batch reactor. processed in parallel are presented. Carbon and hydrogen conver-sion X from glucose to gas (H2, CO2, CO, CH4, etc.) are expressed as:
XC,i= mass of C in glucose ×mass of C in gas i 100 (1)
XH,i=mass of H in glucose ×mass of H in H2 100 (2)
2.2.2. Liquid residue
Glucose concentration was measured by HPLC DIONEX ICS-3000 with amperometric detector and NaOH eluant at constant flow rate. The column Carbopac PA 1 leads the quantification of glucose and 5-hydroxy methyl furfural at 35◦C.
The total organic and inorganic carbon in the liquid phase was measured with a TOC analyzer (Shimadzu TOC-5050).
2.2.3. Solid residue
Characterization of the generated solid phase has been per-formed by an environmental scanning electron microscope (ESEM, Philips XL30 FEG) in nitrogen atmosphere at ambient tempera-ture. The EDS detector (energy dispersive spectroscopy) revealed the chemical composition of the surface, especially in the presence of alkali or metals.
Thermo Gravimetric Analysis of solid residues was performed under N2at a heating rate of 5◦C min−1from 30◦C to 800◦C using
a TGA-DSC B111 SETARAM instrument. Solid samples (15 mg) were heated on a platinum crucible.
3. Results and discussion
3.1. Glucose decomposition during the heating phase
Literature data pointed out that glucose concentration decreased rapidly during supercritical water gasification in
continuous reactors[14,19]. Among the intermediates, 5-hydroxy
methyl furfural (5-HMF) is one of the most reported[17,26,32]. An experiment (500 mL autoclave) has been dedicated to follow glucose and 5-HMF concentrations during the heating of a glucose solution (0.5 wt%, without catalyst). The heating power was chosen at 50% of its maximum (heating rate lower than 20◦C min−1), and
the liquid contained in the reactor was sampled every 10◦C.
The temperature and pressure profiles obtained as a function of time are reported inFig. 1. As a consequence of the physical and chemical processes developed in the system, although the delivered power was constant, the increase of the temperature of the reaction medium shows two distinct regions: 12◦C min−1
between 20 and 180◦C, decreasing to 3◦C min−1 after the zone
of abrupt change of slope observed between 180 and 250◦C.
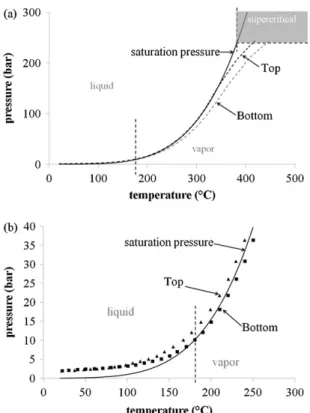
Fig. 2. Representation of the simulated curve of saturation pressure (solid line) dur-ing the heatdur-ing of a glucose solution in the 500 mL batch reactor. The experimental (T, P) couples measured in the reactor are also plotted. (a) Range of 20–450◦C, dotted
line representing the temperature measured by the top and bottom thermocouples. (b) Range of 20–250◦C, symbols representing the temperature measured by the top
and bottom thermocouples.
Simultaneously the pressure measured in the reactor increased almost continually from 2 to 36 bar.
InFig. 2we plotted the simulation results of the saturation pres-sure of an isochoric process of the solution containing 0.5 wt% of glucose (Peng–Robinson model, ASPEN, binary system) with the assumption of no conversion of glucose (constant concentration).
Fig. 2(a) presents the curve of saturation pressure versus tempera-ture until 374◦C, andFig. 2(b) is a magnification of the region from
20 to 250◦C. The two dotted lines inFig. 2(a) plot the experimental
(T, P) couples recorded in the reactor by the bottom and the top thermocouples and the measured pressure, respectively.Fig. 2(a) and (b) shows that the bottom region of the reactor contains liquid up to 180◦C, while the top temperature of the reactor places the
system in vapor only around 350◦C, just before the critical
tem-perature. According to the simulation results, the mass of liquid decreases by vaporization between 180 and 250◦C (Fig. 2(b)). This
process, occurring with energy uptake, is complete at 250◦C and
can explain the change of temperature dynamics observed exper-imentally between 180 and 250◦C. From 180◦C, the vapor/liquid
media is placed on the saturation curve. According to the simulation results, glucose concentration in the vapor phase can be neglected, 10−3wt% compared to the initial solution composition of 0.5 wt%.
These data confirm that sampling and analysis of the liquid phase can represent the glucose amount in the reactor.
However, glucose volume concentration in the liquid, a param-eter of a kinetic law, may vary with the variation of solution density along the isochoric heating process. The volume and density of the solution were simulated by using NIST thermodynamic software for the experimental (P, T) couples, and the water ionic product, Kw,
was calculated by hand using the correlation proposed by Uematsu and Frank[33]. Both parameters are reported inFig. 3.
Fig. 3. Variation of density (calculated through experimental T and P) and pKw of pure water versus time during the heating.
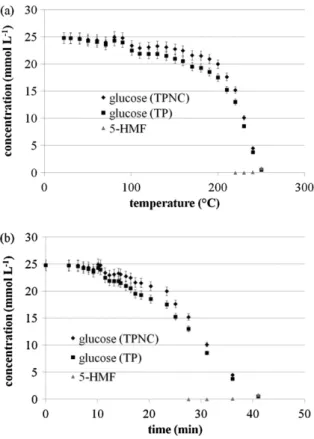
The simulation results of density and liquid volume allow cal-culating the volume concentration of glucose in the liquid phase of the reactor along the heating process using the experimental concentrations.Fig. 4compares glucose experimental volume con-centrations analyzed in normal P, T conditions (dots TPNC) with the calculated ones for the system conditions (TP) as a function of temperature (Fig. 4(a)) and time (Fig. 4(b)).
The decrease of water density[8]and dielectric constant[9]
has important consequences on the solubilization properties of water[5,10]. The ionic product Kwincreases about 103times (about
10−11M2) at 200◦C and 15 bars, favoring ionic reactions
com-pared to radical reactions. As remarked inFig. 4, until 180◦C only
15% of the initial glucose amount was decomposed. Then glucose concentration decreased drastically, being completely degraded at
Fig. 4. Variation of glucose and 5-HMF concentration versus temperature (a) and time (b) during the heating of a glucose solution in the 500 mL batch autoclave. Solution contains 0.5 wt% of glucose and no catalyst. Glucose concentration was measured at normal conditions (TPNC) and then recalculated at conditions of the reactive media (TP).
Fig. 5. Color variation of liquid sampled during the heating of a glucose solution. Solution contains 0.5 wt% of glucose and no catalyst.
250◦C. Experimentally it was shown that glucose completely
dis-appeared from the reaction medium when the supercritical state was reached. However higher heating rates, which can be achieved in continuous processes, produce less glucose degradation prior to reaching the supercritical domain.
5-HMF was only detected from temperatures over 220◦C and
reached 0.1 mg L−1(0.83 mM) at 250◦C. The solution color was light
yellow in the presence of 5-HMF. With temperature increase, the color of the solution changed from orange to deep brown, which can be attributed to 5-HMF polymerization or formation of pheno-lic compounds (Fig. 5). Fang et al.[34]followed in a diamond cell the concentrations of glucose and colored compounds at various heating rates (from 0.2 to 17◦C s−1). The authors reported glucose’s
total conversion at 300◦C and 16.5 MPa, whatever the heating rate.
5-HMF concentration increased at 220◦C, but it reacted rapidly
pro-ducing polymeric by-products and coloring the solution in brown (5-HMF is the precursor of caramel).
In conclusion, it is difficult to propose a simple global mech-anism for glucose conversion in supercritical water. As observed, depending on the heating rate, glucose could be more or less completely converted before reaching the supercritical domain of water, and the formed components can react by different pathways. The glucose decomposition mechanism is complex, particularly in the case of the batch process with a heating rate lower than 10◦C min−1.
3.2. Influence of reaction temperature
Experiments were carried out simultaneously in a series of 5 mini-autoclaves, processed with the same protocol and con-ditions. The solutions contained 5 wt% glucose and a catalyst (K2CO3, 0.5 wt%), reaction time was kept constant at 60 min and
the pressure at 25 MPa. The variable parameter was the conversion temperature, situated in a range from 400 to 600◦C.
3.2.1. Gas composition
Fig. 6 presents the conversion efficiency of the carbon and hydrogen contained in glucose into gases containing carbon (Eq.
(1)) and into molecular hydrogen (Eq. (2)), respectively. These parameters take into account the total volume of gas produced and its composition. The main gases produced are H2, CO2, CH4 and
C2H6.
Conversion efficiency of the different gases is in accordance with literature[14,35], increasing quasi linearly with the temperature. Higher yields for hydrogen can be observed at the highest temper-atures, and generally high temperature favors glucose gasification. This behavior was observed experimentally and thermodynami-cally modeled[36], and it can be explained by water properties. Supercritical water improves radical reactions with temperature increase, therefore promoting gas production[37]. As observed, the carbon contained in glucose is preferentially converted into carbon dioxide than into light hydrocarbons such as methane. Moreover, the CO was not detected in the different gas phases. The alkaline
Fig. 6. Influence of temperature on the efficiency of carbon (Xi) and hydrogen
(XH2) conversion into gas for glucose solutions (5 wt% of glucose, 25 MPa, 1 h,
[K2CO3] = 0.5 wt%).
catalyst (K2CO3) favors the water gas shift reaction by consuming
CO. The batch process (longer residence time in supercritical con-ditions) improves this behavior because CO was generally detected in the gas phase of continuous processes[14,17]. While carbon conversion into C2H6increases with temperature, C2H4is only
pro-duced at low temperatures (400–500◦C) and then disappears in
the gas phase above 550◦C. Ethylene is a result of radical
dehydro-genation of hydrocarbons. The ethylene content of the gas phase, quantified even at long reaction time (60 min), suggests that C2H4
is not only produced in the early reaction period. The decrease of ethylene production can be correlated with its higher reactivity at higher temperature. Dybkjaer[38]showed that the ethylene poly-merization can be obtained at 600◦C following this mechanism:
C2H4→ olefins → polymers → coke.
The molar conversion into H2is increasing from 0.3 to 1.5 mol
H2per mol glucose, which is largely less than the maximum
the-oretical value (12 mol H2 per mol glucose). This low conversion
is partially explained by the generation of light hydrocarbons con-taining hydrogen atoms. Molecular hydrogen production efficiency is largely higher with continuous gasification of glucose solutions in supercritical water conditions[36]. As shown in the first part of this work, glucose molecules are supposed to be totally converted when the reaction temperature is reached. During heating, differ-ent reactions on glucose can occur by generating smaller molecules but also bigger, by more or less developed polymerization. It can be supposed that these last molecules are more stable, limiting therefore hydrogen generation in the process. Moreover, reduced reaction times, up to 60 min, influence the gasification yields by stabilizing hydrogen production and increasing the amount of CO2
produced[31]. The reaction time in batch reactors did not neces-sarily increase the hydrogen production. Combining the amount of each gas and their lower calorific values (LCV), the global LCV of the gaseous products varies from 17 to 260 kcal per mol of glucose for reaction temperatures from 400 to 600◦C.
3.2.2. Analysis of carbon in liquid state
Total organic carbon (TOC) and total inorganic carbon (IC) were quantified in the liquid phase, and the evolution is represented in
Fig. 7. The initial TOC and IC values of the glucose solution contain-ing the catalyst are respectively 22.2 g L−1and 564.3 mg L−1. The IC
values reported inFig. 7do not contain the contribution of the ini-tial amount of catalyst (K2CO3). TOC of the solution decreases when
temperature increases, corresponding to an enhancement in gas production, as presented inFig. 6. The consumption of the organic carbon seems to be non-linear in the temperature domain studied. A sharper decrease appears until 500◦C, but this phenomenon is not
correlated with an increase in gas production (Fig. 6). The increase of temperature acts on the kinetics of the reactions involved in
Fig. 7. Influence of temperature on the TOC and IC values of the liquid phase for glucose solutions (5 wt% of glucose, 25 MPa, 1 h, [K2CO3] = 0.5 wt%).
the process, but the effect depends on their activation energy (e.g., Arrhenius law). All the reactions should be considered to explain the profile of the curve.
Total organic carbon (TOC) is an interesting global parameter that supports the reaction evolution in the liquid phase. In fact, a high TOC decrease results from gasification or carbonization, while a light decrease is attributed to liquefaction. As reported in the lit-erature, high temperature (>500◦C) promotes gasification while
liquefaction is improved at lower temperatures[5,17]. In our exper-iments, the organic carbon conversion is already efficient: at 400◦C
its removal is 78% while it is quasi totally removed from the liquid phase at 600◦C after 1 h treatment. The main part of organic
com-pounds (glucose and intermediates) has been degraded under these conditions and transferred to gas or solid phases.
IC values slightly increase with temperature which implies an increase in carbonates concentration. By increasing the tempera-ture, the partial pressure of CO2increases, and the alkaline pH of
the residual solution favor carbonate uptake.
To close the carbon balance of the process it is necessary to char-acterize the solid phase also formed in the reactor. While the mass of solid could not be appropriately weighed because it was sticking to the reactor walls, only the solid surface and thermal character-ization were realized. As an example at 600◦C, the mass of solid
residue represents 8% of the glucose initial mass, and taking into account the solid composition, 17% of the carbon was recovered in the solid phase. The global carbon balance in this case reached only 72%.
3.3. Analysis of solid residues: effect of process parameters
Hydrothermal carbonization of biomass (saccharides, cellulose, lignocellulose, starch, etc.) became an interesting research subject trying to reproduce the natural bio-geological process in laboratory and pilot conditions[39–43]. The objective is to synthesize a rich carbonaceous solid for energy storage (high C content) and/or com-posed from particles with designed microstructure and properties. Sevilla and Fuertes[40]performed hydrothermal carbonization of glucose in batch processes under different conditions: tempera-ture range from 170◦C to 240◦C, reaction time from 0.5 to 15 h,
concentrations from 0.1 to 1 mol L−1under auto-generated
pres-sure. They obtained a solid, also called hydrochar, composed of spherical carbonaceous particles with a high degree of unifor-mity in their diameter distribution (0.4–6 !m), correlated with the synthesis conditions. They proposed a multistep formation mechanism for the microspheres: dehydratation/fragmentation of glucose molecules leading to soluble products (furfurals, HMF, car-boxylic acids, etc.). Titirici et al.[42]proposed a parallel mechanism based on the formation of furans rings in the first earlier phase of carbonization. In the conditions of the process these compounds
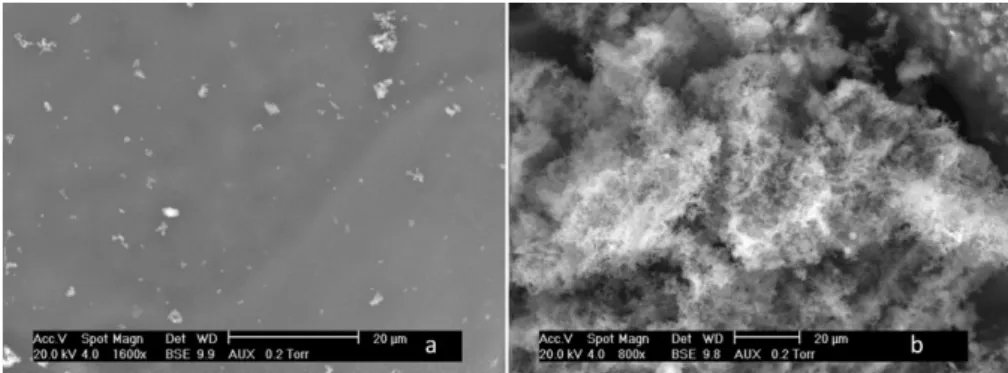
Fig. 8. ESEM images of solid residue from the SCWG of glucose solutions. Operating conditions: 5 wt% glucose, 450◦C, 25 MPa, 1 h, batch reactor of 500 mL.
react together (condensation, polymerization) forming bigger solu-ble molecules, stabilized by aromatization. When the concentration of these molecules exceeds the critical supersaturation point, burst nucleation occurs[44]followed by diffusional growth. The gener-ated nuclei are subject to a surface growth by a diffusional process forming the microspheres. A polymerization mechanism to form carbon particles was also suggested[43].
Our reported experiments have been conducted for lower reaction times under high temperatures and pressures, in the supercritical domain of water, favoring gasification. The cool-ing rate of the 500 mL stirred autoclave was lower (10◦C min−1)
compared to the 5 mL autoclaves (25◦C min−1) while the
homoge-nization of the medium was better by stirring.
Therefore some of the characteristics of the obtained solids are less homogeneous. Solid residues obtained in various experiments were observed by environmental scanning electron microscopy (ESEM), those shown inFigs. 8 and 9were obtained by batch gasifi-cation at 450◦C and 25 MPa during 60 min reaction times, without
catalyst. Fig. 8 illustrates the general morphology of the solid residues obtained by the supercritical water gasification of glucose solution (5 wt%), which is independent of the operating conditions. These magnifications reveal rough and smooth parts (phases) contained in the sampled solid. The same morphology of solid is obtained with or without catalyst and is consequently not due to the alkaline content of the medium, but can be linked, probably, to different local conditions during the process, i.e., contact with the reactor surface, heterogeneities in composition, cooling procedure, etc. The composition of the two zones (a and b,Fig. 8) determined by EDS are similar: 92–93 wt% carbon and 7–8 wt% oxygen, tes-tifying of high carbon content obtained mainly by quantitative
Fig. 10. Mass loss (a) and derivative mass loss (b) of solid residues versus tempera-ture in TGA instrument. Solids from SCWG of 5 wt% glucose solution, with or without catalyst at various reaction times (450◦C, 25 MPa, 5 mL autoclaves).
dehydration. The solid has a composition close to coke, and the structure, investigated by X-ray diffraction is amorphous.
An enlargement of both zones is presented inFig. 9. The surface seems to be apparently smooth (Fig. 9(a)) with this magnifica-tion, while the roughness increases for the second zone (Fig. 9(b)), corresponding probably to a phase inversion during cooling. The roughness is due to agglomerates of small pockets whose diame-ter is typically 0.5 !m. However, some isolated particles reached 2 !m diameters (not shown). All the obtained solids present the same characteristics of morphology of surface and sphericity of the carbon particles. The different tested conversion conditions have limited influence on the structure of the carbonaceous solid.
The thermo-gravimetric analysis (TGA, heating rate: 5◦C min−1)
of the solids reveals different behaviors correlated with the pres-ence of catalyst in the solution and reaction time but not to the type of autoclave.Fig. 10compares TGA results for the carbona-ceous solids obtained at 60 min reaction time with and without the presence of catalyst and a solid obtained at 30 min reaction time
in the absence of catalyst. Temperature and pressure are the same for all the compared experiments. K2CO3and KOH, supposed to be
formed during the water gas shift pathway according to Sina˘g et al.
[17], are stable up to 800◦C: they do not interfere with the organic
mass loss.
Qualitatively, three main zones can be observed in TGA results,
Fig. 10(a). Until 100◦C, mass losses occur with different rates for the
three compared solids. In this temperature range, mass loss may be linked to water evaporation and degassing of (highly) volatile com-pounds. The process dynamics may be favored by a more porous structure. The mass loss is the lowest for the solid obtained dur-ing a reaction time of 1 h in the absence of catalyst. However the solid obtained with catalyst during a reaction time of 1 h and the one obtained without catalyst in 30 min have a similar mass loss.
A second zone can be observed at around 600◦C. Solids obtained
by catalytic conversion during 1 h and by non-catalytic conver-sion during 30 min have very similar behavior, characterized by an almost constant mass loss rate. On the contrary, the solid obtained by catalytic conversion during 1 h shows a better stability until 500◦C followed by a net acceleration of mass loss in the interval
500–600◦C.
Below 150◦C, mass loss seems to be composed by two distinct
processes, revealed by derivative analysis (Fig. 10(b)). This phe-nomenon can be explained by the catalyst presence as reported by Meljac et al.[45]. The authors observed the decomposition of KHCO3between 120 and 158◦C (depending on the heating rate).
K2CO3is added to the solution, contributing to the acid/base
equi-librium of the system and the KHCO3can be formed.
Until 500◦C the solid obtained by 1 h non-catalytic conversion
has better thermal stability. The alkaline catalyst was added to pro-mote the water gas shift reaction and, more generally, gasification. Gasification is favored by formation of smaller molecules which are thermally less stable. The contribution of catalyst in the con-version process may explain the behavioral difference between the two solids in this temperature range. At 600◦C the mass loss of all
solids is close, about 14% for catalytic conversion and about 15% for the non-catalytic conversion.
The last zone (600–800◦C) reveals the contribution of the
reaction time to the thermal stability of the solids. The carbona-ceous solid obtained after 30 min reaction time is less stable, its mass loss reaches 25%, in contrast to the other two pro-cesses, with a mass loss of approximately 20%. We can correlate this behavior to the progress of the aromatization mechanism presented above: a longer reaction time may be necessary to achieve a more compact aromatic structure of the solid (closer to graphite).
4. Conclusion
The goal of our work was to study the glucose degradation dur-ing heatdur-ing and the effect of process parameters on the supercritical water gasification of glucose solutions through the characterization of the three phases formed. This paper presents only the influ-ence of the temperature, which was determined as one of the main influencing parameters. Batch processing results in a higher heating time than in continuous processes, and as a consequence, we observed the degradation of glucose at low temperature and in a relatively short time. 250◦C was reached in 40 min in our
500 mL autoclave, and glucose was quantitatively degraded in the liquid phase producing e.g., 5-hydroxy methyl furfural. The col-orless solution changes to a deep brown color, characteristic of caramel polymerization. In autoclaves, glucose reacts totally before reaching the critical point of water using slow heating rates (below 10◦C min−1).
SCWG of glucose solutions, and particularly hydrogen produc-tion, was favored at high temperature with efficiency of 1.5 mol H2
per mol glucose at 600◦C (5 wt% glucose, 0.5 wt% catalyst, 25 MPa,
60 min). This yield is lower than the maximal theoretical value and can be explained by the competitive conversion of organic matter to solid and liquid phase. The TOC is increasingly removed from the solution with the temperature. The production of valuable platform molecules such as 5-HMF requires subcritical temperatures while energetic valorization as hydrogen is obtained in the supercriti-cal domain. The amorphous solid residues are mainly composed of rough and smooth surfaces. The roughness was due to carbon particles whose spherical morphology seemed to be affected by the heating and cooling rates. On the contrary, the catalyst and the reaction time affect the organic content of the solid, highlighted by thermochemical analysis. In fact, the organics in the solid phase are less sensitive to heat if generated by catalytic processes at lower reaction times.
Acknowledgments
The authors want to thank Christine Rolland for ESEM pictures and Celine Boachon for TGA analyses.
References
[1] DIRECTIVE 2009/28/EC of the European Parliament and of the Council of 23 April 2009.
[2] A. Demirbas, Biorefineries: current activities and future developments, Energy Conversion and Management 50 (2009) 2782–2801.
[3] G. Brunner, Near critical and supercritical water. Part I. Hydrolytic and hydrothermal processes, J. Supercritical Fluids 47 (2009) 373–381.
[4] A. Kruse, Hydrothermal biomass gasification, J. Supercritical Fluids 47 (2009) 391–399.
[5] A. Kruse, E. Dinjus, Hot compressed water as reaction medium and reactant. Properties and synthesis reactions, J. Supercritical Fluids 39 (2007) 362–380. [6] A.A. Clifford, Reactions in supercritical water, Chimica Oggi 11 (1993) 36–37. [7] R.W. Shaw, T.B. Brill, A.A. Clifford, C.A. Eckert, E.U. Franck, Supercritical water
– a medium for chemistry, Chemical and Engineering News 69 (1991) 26–39. [8] P.E. Savage, S.G. Gopalan, T.I. Mizan, C.J. Martino, E.E. Brock, Reactions at
supercritical conditions: applications and fundamentals, AIChE 41 (1995) 1723–1778.
[9] W.L. Marshall, E.U. Franck, Ion product of water substance, 0–1000◦C,
1–10,000 bar new international formulation and its background, J. Physical and Chemical Reference Data 10 (1981) 295–304.
[10] J.W. Tester, A. Marrone, M.M. DiPippo, K. Sako, M.T. Reagan, T. Arias, W.A. Peters, Chemical reactions and phase equilibria of model halocarbons and salts in sub-and supercritical water (200–300 bar, 100–600◦C), J. Supercritical Fluids 13
(1998) 225–240.
[11] S.E. Hunter, P.E. Savage, Recent advances in acid- and base-catalyzed organic synthesis in high-temperature liquid water, Chemical Engineering Science 22/23 (2004) 4903–4909.
[12] A. Kruse, E. Dinjus, Hot compressed water as reaction medium and reactant. 2. Degradation reactions, J. Supercritical Fluids 41 (2007) 361–379.
[13] Y. Matsumura, T. Minowa, B. Potic, S.R.A. Kersten, W. Prins, W.P.M. van Swaaij, B. van de Beld, D.C. Elliott, G.G. Neuenschwander, A. Kruse, M.J. Antal, Biomass gasification in near- and super-critical water: status and prospects, Biomass and Bioenergy 29 (2005) 269–292 (review).
[14] I.G. Lee, M.S. Kim, S.K. Ihm, Gasification of glucose in supercritical water, Indus-trial and Engineering Chemistry Research 41 (2002) 1182–1188.
[15] M. Watanabe, H. Inomata, K. Arai, Catalytic hydrogen generation from biomass (glucose and cellulose) with ZrO2in supercritical water, Biomass and Bioenergy
22 (2002) 405–410.
[16] T.M. Aida, Y. Sato, M. Watanabe, K. Tajima, T. Nonaka, H. Hattori, K. Arai, Dehy-dration of d-glucose in high temperature water at pressures up to 80 MPa, J. Supercritical Fluids 40 (2007) 381–388.
[17] A. Sina˘g, A. Kruse, V. Schwarzkopf, Key compounds of the hydropyrolysis of glu-cose in supercritical water in the presence of K2CO3, Industrial and Engineering
Chemistry Research 42 (2003) 3516–3521.
[18] A.K. Goodwin, G.L. Rorrer, Conversion of glucose to hydrogen-rich gas by super-critical water in a microchannel reactor, Industrial and Engineering Chemistry Research 47 (2008) 4106–4114.
[19] E. Weiss-Hortala, A. Kruse, C. Ceccarelli, R. Barna, Influence of phenol on glucose degradation during supercritical water gasification, J. Supercritical Fluids 53 (2010) 42–47.
[20] A. Kruse, A. Krupka, V. Schwarzkopf, C. Gamard, T. Henningsen, Influence of proteins on the hydrothermal gasification and liquefaction of biomass. 1. Com-parison of different feedstocks, Industrial and Engineering Chemistry Research 44 (2005) 3013–3020.
[21] B. Girisuta, L.P.B. Janssen, H.J. Heeres, A kinetic study on the conversion of glu-cose to levulinic acid, Chemical Engineering Research and Design 84 (2006) 339–349.
[22] M. Sasaki, G. Sekiguchi, T. Adschiri, K. Arai, Rapid and selective conversion of cellulose to valuable chemical intermediates with supercritical water, in: Proceeding 6th International Symposium on Supercritical Fluids, 2003. [23] B.M. Kabyemela, T. Adschiri, R.M. Malaluan, K. Arai, Glucose and fructose
decomposition in subcritical and supercritical water: detailed reaction path-way, mechanisms and kinetics, Industrial and Engineering Chemistry Research 38 (1999) 2888–2895.
[24] Z. Srokol, A.-G. Bouche, A. van Estrik, R.C.J. Strik, T. Maschmeyer, J.A. Peters, Hydrothermal upgrading of biomass to biofuel; studies on some monosaccha-ride model compounds, Carbohydrate Research 339 (2004) 1717–1726. [25] A. Onda, T. Ochi, K. Kajiyoshi, K. Yanagisawa, A new chemical process for
catalytic conversion of d-glucose into lactic acid and gluconic acid, Applied Catalysis A: General 343 (2008) 49–54.
[26] D. Klingler, H. Vogel, Influence of process parameters on the hydrothermal decomposition and oxidation of glucose in sub- and supercritical water, J. Supercritical Fluids 55 (2010) 259–270.
[27] D. Sutton, B. Kelleher, J.R.H. Ross, Review of literature on catalysts for biomass gasification, Fuel Processing Technology 73 (2001) 155–173.
[28] J. Yanik, S. Ebale, A. Kruse, M. Saglam, M. Yüksel, Biomass gasification in super-critical water: II. Effect of catalyst, International J. Hydrogen Energy 33 (2008) 4520–4526.
[29] D.C. Elliott, Review Catalytic hydrothermal gasification of biomass, Biofuels Bioproducts and Biorefining 2 (2008) 254–265.
[30] Q.M. Yu-Wu, E. Weiss-Hortala, R. Barna, H. Boucard, S. Bulza, Glycerol and bioglycerol conversion in supercritical water for hydrogen production, Envi-ronmental Technology 33 (2012) 2245–2255.
[31] Q. Yu-Wu, Study of Biomass Conversion in Supercritical Water Processes to Pro-duce Hydrogen: Application to Glucose, Glycerol and Bio-glycerol, PhD thesis, Toulouse University, 2012, p. 286.
[32] A. Kruse, A. Gawlik, Biomass conversion in water at 330–410◦C and 30–50 MPa.
Identification of key compounds for indicating different chemical reac-tion pathways, Industrial and Engineering Chemistry Research 42 (2003) 267–279.
[33] M. Uematsu, E.U. Frank, Static dielectric constant of water and steam, J. Physical and Chemical Reference Data 9 (1980) 1291–1306.
[34] Z. Fang, R.L. Smith Jr., J.A. Kozinski, T. Minowa, K. Arai, Reaction of d-glucose in water at high temperature (410◦C) and pressures (180 MPa) for the production
of dyes and nano-particles, J. Supercritical Fluids 56 (2011) 41–47.
[35] A. Sina˘g, A. Kruse, J. Rathert, Influence in the heating rate and the type of catalyst on the formation of key intermediates and on the generation of gases during hydropyrolysis of glucose in supercritical water in a batch reactor, Industrial and Engineering Chemistry Research 43 (2004) 502–508.
[36] Y. Lu, L. Guo, X. Zhang, Q. Yan, Thermodynamic modeling and analysis of biomass gasification for hydrogen production in supercritical water, Chemical Engineering J. 131 (2007) 233–244.
[37] W. Bühler, E. Dinjus, H.J. Ederer, A. Kruse, C. Mas, Ionic reactions and pyrolysis of glycerol as competing reaction pathway in near- and supercritical water, J. Supercritical Fluids 22 (2002) 37–53.
[38] I. Dybkjaer, Tubular reforming and autothermal reforming of natural gas – an overview of available processes, Fuel Processing Technology 42 (1995) 85–107. [39] M. Sevilla, A. Fuertes, Chemical and structural properties of carbonaceous products obtained by hydrothermal carbonization of saccharides, Chemistry A European J. 15 (2009) 4195–4203.
[40] M. Sevilla, A. Fuertes, The production of carbon materials by hydrothermal carbonization of cellulose, Carbon 47 (2009) 2281–2289.
[41] E. Dinjus, A. Kruse, N. Tröger, Hydrothermal carbonization – 1. Influence of lignin in lignocelluloses, Chemical Engineering Technology 34 (2011) 2037–2043.
[42] M. Titirici, R. White, M. Falco, M. Sevilla, Black perspectives for a green future: hydrothermal carbons for environment protection and energy storage, Energy and Environmental Science 5 (2012) 6796–6822.
[43] T. Karayildirim, A. Sina˘g, A. Kruse, Char and coke formation as unwanted side reaction of the hydrothermal biomass gasification, Chemical Engineering Tech-nology 31 (2008) 1561–1568.
[44] V.K. La Mer, Nucleation in phase transition, Industrial and Engineering Chem-istry 44 (1952) 1270–1276.
[45] L. Meljac, L. Perier-Camby, G. Thomas, Calorimetric study of reactions occur-ring between impregnated activated fibres and hydrogen sulphide, Carbon 43 (2005) 1407–1415.
![Fig. 7. Influence of temperature on the TOC and IC values of the liquid phase for glucose solutions (5 wt% of glucose, 25 MPa, 1 h, [K 2 CO 3 ] = 0.5 wt%).](https://thumb-eu.123doks.com/thumbv2/123doknet/11616427.303828/6.892.83.387.118.325/influence-temperature-values-liquid-phase-glucose-solutions-glucose.webp)