HAL Id: dumas-02420830
https://dumas.ccsd.cnrs.fr/dumas-02420830
Submitted on 20 Dec 2019HAL is a multi-disciplinary open access archive for the deposit and dissemination of sci-entific research documents, whether they are pub-lished or not. The documents may come from teaching and research institutions in France or abroad, or from public or private research centers.
L’archive ouverte pluridisciplinaire HAL, est destinée au dépôt et à la diffusion de documents scientifiques de niveau recherche, publiés ou non, émanant des établissements d’enseignement et de recherche français ou étrangers, des laboratoires publics ou privés.
Analyse des scores de variabilité glycémique dans une
population de patients diabétiques de type 1 avant et
après transplantation d’ilots pancréatiques et apport
dans le diagnostic de succès de greffe
Manon Jalbert
To cite this version:
Manon Jalbert. Analyse des scores de variabilité glycémique dans une population de patients diabé-tiques de type 1 avant et après transplantation d’ilots pancréadiabé-tiques et apport dans le diagnostic de succès de greffe. Médecine humaine et pathologie. 2019. �dumas-02420830�
AVERTISSEMENT
Ce document est le fruit d'un long travail approuvé par le
jury de soutenance et mis à disposition de l'ensemble de la
communauté universitaire élargie.
Il n’a pas été réévalué depuis la date de soutenance.
Il est soumis à la propriété intellectuelle de l'auteur. Ceci
implique une obligation de citation et de référencement
lors de l’utilisation de ce document.
D’autre part, toute contrefaçon, plagiat, reproduction illicite
encourt une poursuite pénale.
Contact au SID de Grenoble :
UNIVERSITÉ GRENOBLE ALPES
UFR DE MÉDECINE DE GRENOBLE
Année : 2019
ANALYSE DES SCORES DE VARIABILITE GLYCEMIQUE DANS UNE POPULATION DE PATIENTS
DIABETIQUES DE TYPE 1 AVANT ET APRES TRANSPLANTATION D’ILOTS PANCREATIQUES ET
APPORT DANS LE DIAGNOSTIC DE SUCCES DE GREFFE
THÈSE
PRÉSENTÉE POUR L’OBTENTION DU TITRE DE DOCTEUR EN MÉDECINE
DIPLÔME D’ÉTAT
Manon JALBERT
THÈSE SOUTENUE PUBLIQUEMENT À LA FACULTÉ DE MÉDECINE DE GRENOBLE
Le 28 Juin 2019
DEVANT LE JURY COMPOSÉ DE :
Président du jury :
Monsieur le Professeur Olivier CHABRE
Membres :
Madame le Docteur Sandrine LABLANCHE, directrice de thèse
Madame le Professeur Anne Laure BOREL
Monsieur le Professeur Pierre Yves BENHAMOU
L’UFR de Médecine de Grenoble n’entend donner aucune approbation ni improbation aux opinions émises dans les thèses ; ces opinions sont considérées comme propres à leurs auteurs.
Table des matières
Introduction générale ... 7
1. Contexte ... 7
a) Variabilité glycémique du sujet diabétique insulino-traité et diabète instable ... 7
b) Analyse de la variabilité glycémique ... 8
2. Variabilité glycémique chez les patients diabétiques de type 1 instables avant et après greffe d’îlots ... 9 3. Objectif du travail ...10 Article ... 11 Abbreviations ...12 RESUME ...13 ABSTRACT ...14 INTRODUCTION...15 METHODS ...16 TRIMECO trial ... 16 CGM data analysis ... 16 Statistical analysis ... 17 RESULTS ...18 DISCUSSION...20 CONCLUSIONS ...22
TABLES AND FIGURES ...23
Annexes ... 30
Annexe 1. Données à 12 mois post transplantation ...30
Annexe 2. Revue de la littérature : moyenne glycémique et scores de variabilité glycémique en populations de volontaires sains, patients diabétiques de type 1 tout venant et après transplantation d’îlots. ...35
Introduction générale
1. Contexte
a) Variabilité glycémique du sujet diabétique insulinotraité et diabète instable
Le diabète de type 1 est une pathologie se déclarant en général chez l’enfant ou l’adulte jeune, caractérisée par une hyperglycémie chronique secondaire à une destruction auto-immune des cellules β pancréatiques responsables de la sécrétion d’insuline. Le traitement de cette pathologie chronique est l’insulinothérapie sous-cutanée à vie, associée à l’éducation du patient à la gestion de l’insuline en fonction des glucides consommés et de l’activité physique. L’objectif du traitement est de restaurer un équilibre glycémique optimal en prévenant les accidents hypoglycémiques et hyperglycémiques.
Chez le patient diabétique insulino-traité, il a été démontré que l’obtention d’un équilibre glycémique optimal permet de réduire l’apparition des complications micro et macro vasculaires (1,2). La qualité du contrôle glycémique est habituellement appréciée par la mesure de l’hémoglobine glyquée (HbA1c), reflet de la moyenne glycémique sur les 3 mois précédant le dosage. Cependant, bien que marqueur de référence, cette mesure ne fournit qu’une information sur le contrôle glycémique global sans prise en compte des fluctuations glycémiques quotidiennes et donc de la qualité de la stabilité glycémique. La variabilité glycémique se définit comme le degré de fluctuation entre les niveaux les plus élevés (pics) et les niveaux les plus bas (nadirs) de glycémie (3). Comme illustré sur la figure ci-dessous, deux patients ayant la même moyenne glycémique et la même HbA1c peuvent avoir une variabilité glycémique très différente. La variabilité glycémique est liée à la perte de l’homéostasie glycémique, en rapport avec la carence endogène de sécrétion insulinique. Il existe des facteurs intrinsèques d’instabilité glycémique : la durée du diabète, associée à un épuisement progressif de l’insulinosécrétion, la présence d’anticorps anti-insuline (cause auto-immune d’hypoglycémies), certaines endocrinopathies (syndrome de Cushing, acromégalie, hyperthyroïdie) et insuffisances endocriniennes (insuffisance surrénalienne), les pathologies digestives telles que la maladie cœliaque, la gastroparésie. Les facteurs extrinsèques d’instabilité glycémiques sont représentés par des choix thérapeutiques inadaptés, erreurs d’ajustement
de doses d’insuline, une technique d’injection de l’insuline inadéquate, des resucrages excessifs ou des troubles du comportement alimentaire (4).
Lorsque la variabilité glycémique est extrême, elle expose le patient à des épisodes métaboliques fréquents et imprévisibles tels que la cétose et / ou des hypoglycémies sévères. Ceci définit le diabète instable (5), qui est associé à une morbidité et une mortalité importantes ainsi qu’à une qualité de vie médiocre (6,7).
Figure. Pour une même moyenne glycémique, ces 3 patients présentent une variabilité glycémique très différente : elle est faible pour le patient 1, élevée pour le patient 2 et 3 du fait d’une plus grande amplitude de variation glycémique (patient 2) et d’une plus grande amplitude et plus grande fréquence d’oscillations glycémiques (patient 3).
b) Analyse de la variabilité glycémique
intra-Plusieurs dizaines d’indices permettant d’évaluer la variabilité glycémique ont été développés (8–10). Il n’existe pas à l’heure actuelle de consensus sur quel indice ou quel ensemble d’indices utiliser en routine, et chaque indice possède ses propres avantages et inconvénients.
Parmi les indices de variabilité glycémique les plus cités/utilisés, on retrouve la déviation standard (ou écart type) (11), le coefficient de variation (8), le MAGE (Mean Amplitude Glycemic Excursion) (10,12). On peut également citer le CONGA (Continuous overlapping net glycemic action), le MODD (Mean Of Daily Differences), l’ADRR (Average Daily Difference Range), l’indice « M », le MIME (Mean indices of Meal Excursions), le LBGI (Low Blood Glucose Index), le HBGI (High Blood Glucose Index), le IQR (interquartile range), l’IGC (Index of Glycemic Control), différents calculs d’écart-types en fonction des segments temporels choisis, etc. Le débat concernant l’indice à utiliser en pratique clinique continue à être alimenté par l’apparition de nouveaux indices de variabilité glycémique comme le GVP (Glycemic Variability Percentage), publié en 2018 (13).
La notion de variabilité glycémique a donc une importance croissante à l’heure actuelle dans l’évaluation de l’équilibre glycémique du patient diabétique de type 1.
Le domaine d’application de l’analyse de la variabilité glycémique est large et il semble désormais nécessaire d’inclure les scores de variabilité glycémique, en pratique clinique pour évaluer et suivre la variabilité glycémique d’un patient et en recherche pour évaluer l’impact de nouvelles modalités thérapeutiques sur la variabilité glycémique.
2. Variabilité glycémique chez les patients diabétiques de type 1 instables avant et après greffe d’îlots
Le diabète instable nécessite une prise en charge spécifique et la greffe d'îlots apparaît comme une option thérapeutique pour les patients en échec d'un traitement médical intensif (14).
L’amélioration de la variabilité glycémique n’est pas systématiquement décrite lors d’une greffe d’îlots chez des patients diabétiques instables. A l’heure actuelle, le succès d’une transplantation d’îlots
pancréatique est défini par l’utilisation de scores (β-score, Igls criteria) (15,16) prenant en compte des critères biologiques tels que l’hémoglobine glyquée, le taux de C-peptide, et des critères cliniques tels que la nécessité de traitement par insuline et la survenue d’épisodes hypoglycémiques sévères. Si la présence d’une importante variabilité glycémique est un des critères justifiant la réalisation d’une transplantation d’îlots chez le patient diabétique de type 1, celle-ci ne fait pas partie des critères permettant de juger du succès ou non de la transplantation.
3. Objectif du travail
Nous avons voulu analyser dans cette étude l’évolution de la variabilité glycémique chez des patients diabétiques de type 1 après transplantation d’îlots pancréatiques au cours de l’étude TRIMECO (National Clinical Trial n°01148680).
L’étude TRIMECO visait, en essai contrôlé randomisé multicentrique, à comparer l’efficacité métabolique de la transplantation d’îlots pancréatiques allogéniques à l’insulinothérapie intensive pour le traitement du diabète de type 1. L’objectif principal était d’évaluer l’efficacité de la greffe d’îlots du point de vue métabolique à 6 mois comparativement à une stratégie insulinique intensive, pour deux catégories de patients étudiées en parallèle : patients présentant un diabète instable et patients diabétiques insuffisamment contrôlés et porteurs d’un greffon rénal (17).
Nous avons donc analysé des scores de variabilité glycémique à partir des données de mesure continue du glucose chez des patients inclus dans l’étude TRIMECO. L’objectif était de décrire les scores de variabilité glycémique avant et après greffe et d’évaluer si des seuils pouvaient être définis pour chacun
Article
Glycemic variability indices can be used to diagnose
islet transplantation success in type 1 diabetic patients
Manon JALBERT1, Fei ZHENG2,4, Anne WOJTUSCISZYN3, Florence FORBES2,4, Stéphane BONNET2,4, Kristina
SKAARE5, Pierre-Yves BENHAMOU1, Sandrine LABLANCHE1, on behalf of TRIMECO Study Group*.
1. Department of Endocrinology, Diabetes and Nutrition, Grenoble Alpes University Hospital 2. Grenoble Alpes University, Inria, CNRS, Grenoble INP, LJK, Grenoble, France
3. Department of Endocrinology, Diabetes and Nutrition, Montpellier University Hospital 4. CEA LETI, DTBS, Univ. Grenoble Alpes, Minatec Campus, Grenoble, France
5. Department of Public Health, Grenoble Alpes University
* Members listed in the appendix: Department of Endocrinology, Diabetes, and Nutrition (Lablanche MD, Prof P-Y Benhamou MD), French National Center for Scientific Research (Prof J-L Bosson MD, K Skaare PhD), Department of Nephrology (R Tetaz MD), Department of Clinical Trial Surveillance, Direction of Clinical Research and Innovation (S Logerot PharmD), and Cellular Therapy Unit, National Blood Service Rhône-Alpes (H Egelhofer PhD), Grenoble University Hospital, and Department of Public Health (Prof J-L Bosson, K Skaare), Grenoble Alpes University, Grenoble, France; Inserm U1055, Laboratory of Fundamental and Applied Bioenergetics Grenoble, Grenoble, France (S Lablanche, Prof P-Y Benhamou); Laboratoire des Techniques de l’Ingénierie Médicale et de la Complexité–Informatique, Mathématiques et Applications de Grenoble, Grenoble, France (Prof J-L Bosson, K Skaare); Department of Endocrinology, Diabetes, and Nutrition, C Huriez Hospital, Lille University Hospital, Lille, France; Inserm 1190, European Genomic Institute for Diabetes, Lille, France (Prof M-C Vantyghem MD, Prof J Kerr-Conte PhD, K Benomar MD, Prof F Pattou MD); Hôpitaux Universitaires de Strasbourg, Service d’Endocrinologie Diabète et Maladies Métaboliques, and Equipe d’Accueil 7293, Fédération de Médecine Translationnelle de Strasbourg, Université de Strasbourg, Strasbourg, France (Prof L Kessler MD); Department of Endocrinology, Diabetes, and Nutrition, Montpellier University Hospital, and Laboratory of Cell Therapy of Diabetes, Institute of Functional Genomics, Mixed Research Unit, French National Center for Scientific Research 5203, Inserm U1191, University of Montpellier, Montpellier, France (Prof A Wojtusciszyn MD, Prof E Renard MD); Centre
Hospitalier Universitaire Jean Minjoz, Service d’Endocrinologie-Métabolisme et Diabétologie-Nutrition, Besançon, France (S Borot MD); Service d’Endocrinologie Diabète Nutrition (Prof C Thivolet MD) Pôle de Santé Publique Service Evaluation Economique en Santé (Prof C Colin MD, Gwen Grguric PhD, C Camillo-Brault PharmD), Service de Transplantation, Néphrologie et Immunologie Clinique (Prof E Morelon MD, F Buron MD), and Service d’Urologie et de Chirurgie de la Transplantation (Prof L Badet MD), Hospices Civils de Lyon, Groupement Hospitalier Centre, Université de Lyon, Lyon, France; Service de Néphrologie, Centre Hospitalier Universitaire de Nancy, Nancy, France (S Girerd MD); Department of Surgery, Islet Isolation, and Transplantation, Geneva University Hospitals, Geneva, Switzerland (D Bosco PhD, Prof T Berney MD); F-69003, EA 7425 Health Services and Performance Research, Public Health Service and Health Economic Evaluation, Claude Bernard University Lyon 1, Lyon, France (Prof C Colin, G Grguric, C Camillo-Brault); Department of Diabetes, Sud-Francilien Hospital, Corbeil-Essonnes, France (Prof A Penfornis MD); and Université Paris-Sud, Orsay, France (Prof A Penfornis).
Abbreviations
CGM Continuous glucose monitoring
CV Coefficient of variation
GV Glycemic variability
GVP Glycemic variability Percentage
HbA1c Glycated hemoglobin
IT Islet transplantation
MAGE Mean amplitude glycemic excursion
ROC curve Receiver operating characteristic curve
SD Standard deviation
Se Sensibility
Spe Specificity
RESUME
Objectifs : La présence d’une variabilité glycémique (VG) élevée est la principale indication de la
transplantation d’îlots (TI) chez les patients diabétiques de type 1 (DT1) instables. Les critères actuellement utilisés pour évaluer la fonction du greffon ne prennent pas en compte l’amélioration de la VG. Notre étude visait à décrire l’évolution des indices de VG chez les patients DT1 ayant bénéficié d’une TI au cours de l’essai TRIMECO, et à évaluer si des seuils pouvaient être définis pour diagnostiquer le succès de greffe.
Méthodes : Nous avons recueilli les données de 29 patients de l'essai TRIMECO (NCT01148680), essai
clinique comparant l'efficacité métabolique de la TI à une insulinothérapie optimisée. Sur la base des données de mesure continue du glucose, nous avons analysé la moyenne glycémique et quatre indices de variabilité glycémique (écart type, coefficient de variation, MAGE et GVP) avant (M0) et six mois (M6) après TI. Afin de définir les seuils permettant de prédire le succès de greffe, nous avons établi une courbe ROC pour chacun des indices de VG 6 mois après la transplantation.
Résultats : Chaque indice de variabilité glycémique a diminué significativement entre M0 et M6 :
l’écart-type est passé de 53,9 mg/dL [44,6 – 61,5] à 20,1 mg/dL [13,5 – 24,3] ; le coefficient de variation de 35,2% [30,6 – 37,7] à 17,3% [12,0 – 20,5] ; le MAGE de 134,9 mg/dL [111,2 – 155,8] à 51,9 mg/dL [32,4 – 62,4] ; le GVP de 35,3% [24,9 – 47,2] à 12,2% [6,2 – 18,8] (p ≤ 0,0001). Les seuils permettant le diagnostic de succès de greffe six mois après la greffe étaient un écart-type à 21,51 mg/dL (sensibilité Se 86,67%, spécificité Spe 92,86%), un coefficient de variation à 16,03% (Se 86,67%, Spe 71,43%), un MAGE à 54,81 mg/dL (Se 73,33%, Spe 92,86%) et un GVP à 15,78% (Se 73,33%, Spe 100%).
Conclusions : Cette étude met en évidence l’impact significatif de la TI sur la réduction de la variabilité
glycémique des patients atteints de DT1 instable. Les seuils proposés permettent une évaluation facile du succès de la transplantation d’îlots en utilisant uniquement les données de mesure continue du glucose, et peuvent constituer un outil clinique pratique pour le suivi des patients greffés.
ABSTRACT
Aims: High glycemic variability (GV) is the major indication for islet transplantation (IT) in patients with
type 1 diabetes (T1D). The actual criteria used to assess graft function don’t consider GV improvement. Our study aimed to describe GV indices evolution in T1D patients who benefited from IT during the TRIMECO trial and to evaluate if thresholds might be defined to diagnose IT success.
Methods: We collected data from 29 patients of the TRIMECO trial, a clinical trial (NCT01148680)
comparing the metabolic efficacy of IT with intensive insulin therapy. Based on CGM data, we analysed mean glucose level and four GV indices (standard deviation, coefficient of variation, MAGE and GVP) before (M0) and 6 months (M6) after IT. The definition of thresholds to diagnose IT success was based on the establishment of ROC curves for each GV indice 6 months after transplantation.
Results: Each GV indice decreased significantly between M0 and M6: SD 53.9 mg/dL [44.6 – 61.5] vs 20.1
mg/dL [13.5 – 24.3]; CV 35.2% [30.6 – 37.7] vs 17.3% [12.0 – 20.5]; MAGE 134.9 mg/dl [111.2 – 155.8] vs 51.9 mg/dL [32.4 – 62.4]; GVP 35.3% [24.9 – 47.2] vs 12.2% [6.2 – 18.8] (p ≤ 0.0001). Thresholds diagnosing IT success at 6 months post-transplant were a SD at 21.51 mg/dL (sensibility 86.67%, specificity 92.86%), a CV at 16.03% (sensibility 86.67%, specificity 71,43%), a MAGE at 54.81 mg/dL (sensibility 73.33%, specificity 92.86%) and a GVP at 15.78% (sensibility 73.33%, specificity 100%).
Conclusions: This study confirms a positive impact of IT on GV. The proposed thresholds allow an easy
evaluation of IT success using only CGM data and may be a clinical tool for the follow-up of transplanted patients.
INTRODUCTION
Glycemic variability (GV) is defined as the degree of fluctuation between the highest levels (peaks) and the lowest levels (nadirs) of blood glucose (18,19). GV is mainly due to the loss of endogenous insulin secretion. There are intrinsic factors (diabetes duration resulting in a progressive and complete depletion of insulin secretion) and extrinsic factors of glycemic instability (inappropriate therapeutic choices, errors in the management of insulin doses, excessive glucose intake in case of hypoglycemia, inadequate technique of insulin injection) (4). To date, numerous indices or composite indices have been proposed and validated to explore glycemic variability, each with its own advantages and disadvantages (4,8,10,19,20). GV can be analysed within the same day (intra-day variability) or comparing successive days (inter-day variability). GV analysis is today aided by the diffusion of continuous glucose monitoring (CGM) techniques that provides a wealth of information regarding patient glucose profile. Despite the lack of consensus on the type of score to be used routinely, the use of GV analysis in clinical practice can be now easily performed to assess, monitor and follow the GV of a patient with type 1 diabetes.
Achievement of optimal glycemic control in patients with type 1 diabetes remains a challenge in most of patients (21). Some of them develop severe glycemic variability leading to brittle diabetes (5), exposing them to frequent and unpredictable metabolic episodes such as ketosis and/or severe hypoglycemia. Brittle diabetes is associated with significant morbidity and mortality and poor quality of life (6,7). Brittle diabetes requires a specific medical management and islet transplantation appears as a therapeutic option for patients in whom intensive medical therapy has failed (14). Islet transplantation is nowadays recognized to be an efficient therapy to restore a good glycemic control, reduce glycemic variability and prevent severe hypoglycemia in type 1 diabetic patients with severe glycemic variability (17,22). Glycemic variability improvement is not currently considered to diagnose IT success. Indeed, the evaluation of islet graft function and IT success is based on the β-score and, more recently introduced, on the Igls score: both are composed of clinical and biological data that do not consider the improvement of glycemic variability after islet transplantation (15,16).
The objective of our study was to describe the evolution of glycemic variability indices in type 1 diabetic patients who benefited from islet transplantation during the TRIMECO trial and to evaluate if thresholds might be defined for each glycemic variability indice to diagnose the success of islet transplantation.
METHODS
TRIMECO trial
TRIMECO trial (NCT01148680) design has been previously described (17). Briefly, it is a randomized controlled trial, aiming at evaluating the metabolic efficacy of islet transplantation at 6 months compared to an intensive insulin therapy, in type 1 diabetic patients with severe hypoglycemic episodes or hypoglycemia unawareness or patients with a kidney graft and poor glycemic control (17). 50 patients were selected between May 2010 and May 2013 in 15 French centres, and 47 patients were assessed for the primary endpoint. 46 patients received islet transplantation because one patient in the insulin group died while on the islet transplantation waiting list (Figure 1).
CGM data analysis
For each patient included in the TRIMECO study, we analysed available CGM data before and 6 months after the first islets infusion. Among the 46 patients analysed for the primary endpoint in the TRIMECO study, we selected patients for whom one CGM before and one CGM 6 months after IT were available. CGM data were therefore collected for 29 patients: 3 patients had no CGM data available at any point, 11 patients had no CGM data available before IT (no CGM at M0) and 3 patients had no CGM data
• The standard deviation (SD) is expressed in mg/dL. It takes into account all glycemic oscillations (minor and major ones). A SD greater than 50% of mean glucose has been proposed as an indicator for excessive GV (11).
• The coefficient of variation (CV) is calculated by dividing the SD of glucose by the mean glucose and is expressed as a percentage (SD/mean x 100) (8). Unlike most other indices of GV, it is an easy measure and it is described as one of the most reliable indices to evaluate the amplitude of the GV. A threshold of 36% has been proposed to discern stable from unstable diabetes (23).
• The MAGE (Mean Amplitude Glycemic Excursion) aims to consider only major glycemic excursions, excluding minor ones (only glycemic variations that exceed one SD of the average blood glucose are included in the calculation). MAGE appears as an informative expression of the intra-day GV in insulin-treated diabetic patients and as a robust parameter to characterize brittle diabetes (10,12). MAGE greater than 65 mg/dL is used as a threshold to define high GV (24).
• The GVP (Glycemic Variability Percentage) is a recent metric proposed by Peyser et al. (13) providing a measurement of GV over a given interval of time by analysing the length of the CGM temporal trace normalized to the duration under evaluation. GVP has the advantage to measure both the amplitude and frequency of glycemic oscillations. GVP classifies glycemic variability in four categories: minimal (GVP ≤ 20 %), low (GVP > 20 and ≤ 30 %), moderate (GVP > 30 and ≤ 50 %), and high GV (GVP > 50 %).
Noteworthy, to avoid a smoothing of the average profile (19), we calculated the CV for each consecutive day and then averaged the results obtained. For purposes of clarity and consistency, each indice of GV was calculated using the same method, by calculating the indice for each consecutive day and then averaging the results obtained.
Statistical analysis
Categorical variables are reported as count and percentage. Continuous variables are presented as the median value and interquartile range [25th and 75th percentile]. Comparisons of cross-sectional data
considered statistically significant. To define thresholds to predict the success of the islet transplantation, we established a receiver operating characteristic (ROC) curve for each GV indice 6 months after transplantation. The established ROC curves were considered “usable” if the area under the curve (AUC) was above 70% and if the confidence interval did not include the value 50%. To establish the diagnostic performance of our indices, we chose the score as a success criterion. The β-score is a composite β-score developed to assess the graft’s function. It assigns two points each for normal fasting glucose (≤ 100 mg/dL), HbA1c ≤ 6.1% (43 mmol/mol), stimulated or basal C-peptide (≥ 0.3 nmol/L), and absence of insulin or oral hypoglycemic drug use. No point is given if fasting glucose is ≥ 1.26 g/L, HbA1c is ≥ 6.9% (52 mmol/mol), stimulated C-peptide secretion is undetectable (<0.1 nmol/L), or daily insulin use is ≥ 0.25 U/kg. One point is given for intermediate values. Thus, the β-score can range from 0 (no graft function) to 8 (optimal graft function) and a β-score ≥ 6 defines a graft success (15). For our analyses, β-score was stratified into 3 categories: transplant’s failure [0-2], intermediate [3-5] or transplant success [6-8]. The best thresholds for the diagnosis of islet transplantation success were chosen thanks to the Youden index (Specificity + Sensitivity – 100): thresholds with the highest Youden index were selected.
Data formatting and preparation were executed in MATLAB 2016b (Mathwork) and Excel 2016 (Microsoft Office 365). Statistical analyses were performed using Stata® version 15 (Stata Corporation 4905 Lakeway Drive College Station, TX 77845 USA).
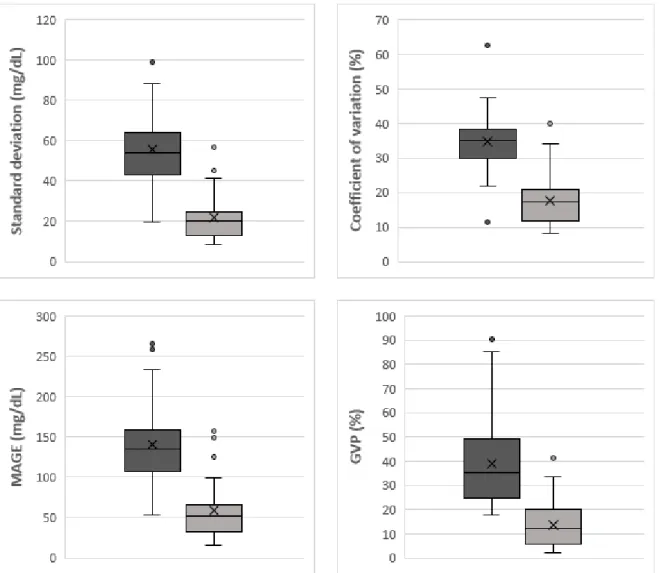
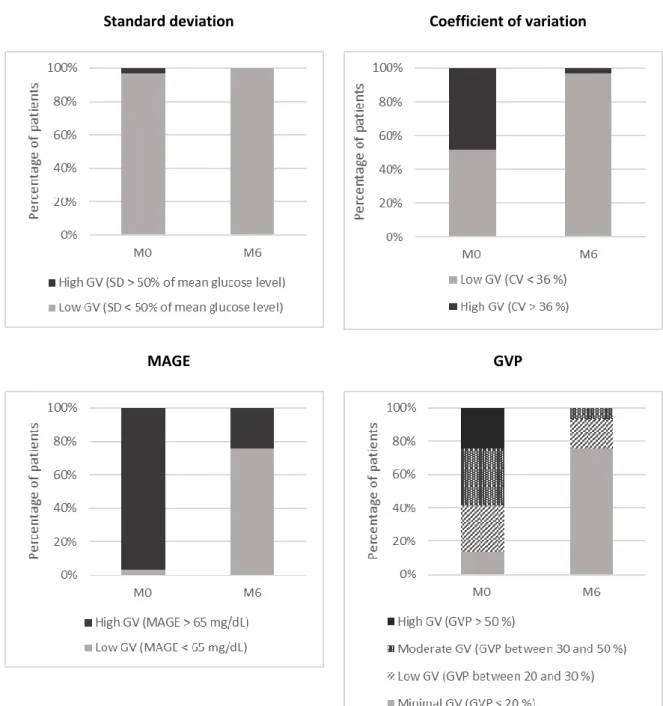
Mean glucose level decreased from 156.4 mg/dL [128.5 – 175.9] at M0 to 118.3 mg/dL [108.4 – 133.2] at M6 post-IT. Standard deviation dropped from 53.9 mg/dL [44.6 – 61.5] at M0 to 20.1 mg/dL [13.5 – 24.3] at M6. Considering a standard deviation greater than 50% of mean glucose (threshold defining high glycemic variability for standard deviation), 3.4% of patients (n=1, 95% CI 0.1-17.8%) had a high glycemic variability at M0 versus 0% (n=0, 95% CI 0-11.9%) at M6 post-IT (Figure 3). Coefficient of variation (CV) decreased from 35.2% [30.6 – 37.7] at M0 to 17.3% [12.0 – 20.5] at M6 post-IT. Considering a CV ≥ 36% (threshold defining high glycemic variability for CV), 48.3% of patients (n=14, 95% CI 29.4-67.5%) had a high GV at M0 versus 3.4% (n=1, 95% CI 0.1-17.8%) at M6 post-IT. MAGE decreased from 134.9 mg/dL [111.2 – 155.8] at M0 to 51.9 mg/dL [32.4 – 62.4] at M6 post-IT. Considering a MAGE > 65 mg/dL (threshold defining high glycemic variability for MAGE), 96.6 % of patients (n=28, 95% CI 82.2-99.9%) had a high glycemic variability at M0 versus 24.1% (n=7, 95% CI 10.3-43.5%) at M6 post-IT. Finally, GVP also dropped from 35.3% [24.9 – 47.2] at M0 to 12.2% [6.2 – 18.8] at M6 post-IT. Considering a GVP > 50 % (threshold defining high glycemic variability for GVP), 24.1 % of patients (n=7, 95% CI 10.3-43.5%) had a high glycemic variability at M0 versus 0% (n=0, 95% CI 0-11.9%) at M6 post-IT. For each indice, glycemic variability improvement was significant between M0 and M6 post-IT (p ≤ 0.0001).
We then determined for each glycemic variability indice a threshold allowing the diagnosis of IT success. We established a ROC curve for each indice at 6 months post-transplant using the β-score as the referential success criterion. 15/29 patients (51.7%, 95% CI 32.5-70.6%) were thus considered successfully treated (β-score ≥ 6) 6 months after the first islet injection. ROC curves were considered usable at M6 for each GV indice (i.e. AUC > 70% and the confidence interval not including the value 50%, see Table 3). The best thresholds were selected using the Youden index. Threshold’s value for each indice and their diagnostic performance are summarized in Table 4. Each selected threshold means that if a patient has a GV value below the threshold he can be considered successfully treated by islet transplantation with the sensitivity and specificity described. Thus, at 6 months post-transplant, we here consider as successfully treated a patient who have a SD below 21.51 mg/dL (with a sensibility (Se) of
86.67% and a specificity (Spe) of 92.86%), a CV below 16.03% (Se 86.67%, Spe 71.43%), a MAGE below 54.81 mg/dL (Se 73.33%, Spe 92.86%), a GVP below 15.78% (Se 73.33%, Spe 100%).
DISCUSSION
This study reports the analysis of glycemic variability indices in 29 patients with type 1 diabetes receiving islet transplantation during the TRIMECO study. We noticed a marked improvement of all glycemic variability indices studied between pre-transplant period and 6 months after first islets infusion. We propose in our study thresholds of GV indices, calculated from CGM data, to distinguish IT success from IT failure at 6 months.
In our study, we identified that a mean glucose level at 123.1 mg/dL, a standard deviation at 21.51 mg/dL, a coefficient of variation at 16.03%, a MAGE at 54.81 mg/dL, a GVP at 15.78% can be use as threshold to diagnose islet transplantation success. In comparison with the indices calculated in type 1 diabetic patients after islet transplantation in several studies (25–29), the thresholds we propose seem consistent. In particular, in Brooks et al. (28), glycemic variability indices were calculated in patients after islet transplantation, after separating patients into 4 groups according to the estimated graft function (low, medium, good, excellent). In the 23 patients with excellent graft function, the mean glucose level was 134.89 mg/dL, the standard deviation was 35.18 mg/dL, the coefficient of variation was 26.08%. Few data are available for MAGE in transplanted diabetic patients, making difficult the comparison of our data with the literature.
Regarding studies providing reference ranges for non-diabetic volunteers, Zhou et al. (30) analysed GCM data obtained from healthy non-diabetic adults, aiming to establish normal reference ranges for
mg/dL and from 76 to 175.7 mg/dL respectively (12,30–39). Gude et al. (38) studied glycemic variability indices in 583 Spanish adult volunteers. 70/583 (12%) had been diagnosed with diabetes before inclusion. Using CGM data, glycemic variability indices were calculated for diabetic and non-diabetic individuals. Thresholds to distinguish diabetic from non-diabetic subjects have been established. The defined threshold for SD was 23 mg/dL and 40 mg/dL for the MAGE. In conclusion, the thresholds we established in our study are relatively close from the reference ranges proposed above for non-diabetic patients reinforcing the idea that a glycemic variability score below the established proposed thresholds is supportive for a successful transplantation.
Standard deviation and coefficient of variation have been proposed as the recommended measures of glycemic variability in the international consensus on the use of CGM data (40). However, it appears in our study that standard deviation is less discriminant than the coefficient of variation, MAGE or GVP to characterize brittle diabetes. Indeed, if we consider the standard deviation, only 3.4% of patients presented a high glycemic variability before transplantation (Table 2 and Figure 3), whereas the patients of the TRIMECO study were selected by the presence of a major clinical glycemic lability with occurrence of severe hypoglycemic episodes resulting in a poor quality of life. If we consider the other GV indices, this percentage was 48.3% for the CV, 96.6% for the MAGE, 24.1% for the GVP.
The β-score is an effective composite score to characterize the graft function but it requires blood samples and biological assays. In the era of glucose sensors, connected blood glucose meters and continuous glucose monitoring, one should take advantage of the wealth of data available to characterize the results of new therapeutic modalities available for type 1 diabetes. The proposed thresholds allow an easy evaluation of IT success using only CGM data and may be a clinical tool for the follow-up of transplanted patients.
Our study shows several weaknesses. Firstly, the number of analysed days of CGM was small (average of 7.2 days pre-transplant, 6.7 days at 6 months and 6.2 days at 12 months post-transplant). This may have
reduced the reliability of our measurements. In addition, in view of the multitude of available glycemic variability indices, our choice of the indices to be analysed may bring to discussion. We decided not to multiply the number of glycemic parameters analysed, because these indices are highly inter-correlated and provide for some redundant information. In addition, some of these parameters are less suitable for an overall glycemic analysis such as LBGI that is more oriented towards evaluation of hypoglycaemia or MIME towards evaluation of per-meal variations. As described earlier, the analysis of standard deviation and coefficient of variation is recommended by recent consensus (40,41), the MAGE is known for many years as a robust index to characterize glycemic instability (12), and the GVP appeared to us as a recent interesting index because of its ability to take into account both the amplitude and the frequency of glycemic oscillations (13). However, the debate over which indicators have to be used to characterize glycemic variability continues to be fuelled by the development of new indices. Moreover, we evaluated in our study thresholds for each indice 6 months after islet transplantation which is a short-term evaluation and our findings have to be confirmed with a longer time of evaluation.
CONCLUSIONS
This study highlights the significant impact of pancreatic islet transplantation on the reduction of glycemic variability of patients with type 1 diabetes. IT allows a significant reduction of the proportion of patients with high glycemic variability. We here propose thresholds for standard deviation, coefficient of variation, MAGE and GVP, to distinguish "IT success" from "IT failure". These thresholds may be used as a rapid clinical tool in the follow-up of transplanted patients and allow a better exploitation of the wealth of information brought by the continuous glucose monitoring.
TABLES AND FIGURES
Table 1. Patients clinical and demographic baseline characteristics and transplant characteristics. Median [IQR] or n (%) Sexe F M 16 (55.2) 13 (44.8) Age (years) 51.0 [42.0 – 55.0] Weight (kg) 68.0 [60.9 – 74.0]
Body mass index (kg/m²) 23.8 [22.7 – 25.6]
Diabetes duration (years) 29.0 [24.0 – 37.0]
Treatment Insulin pump
Multiple daily injections
17 (58.6) 12 (41.4) HbA1c (%) HbA1c (mmol/mol) 8.2 [7.6 – 8.9] 66 [60 – 74]
Daily insulin dose (UI/kg/jour) 0.53 [0.42 – 0.66]
Number of patients who experienced at least one severe
hypoglycemic episode during the preceding year 19 (65.5)
Number of severe hypoglycemic episodes per patient during the
preceding year 2 [0 – 3]
Type of transplantation Islet transplantation alone
Islet transplantation after kidney graft
23 (79.3) 6 (20.7) Number of islets injections received in total
1 2 3 2 (6.9) 10 (34.5) 17 (58.6)
Table 2. Evolution of mean glucose level and glycemic variability indices and proportion of patients with high GV before and six months after islets transplantation.
Before transplantation 6 months after transplantation
Mean glucose level Value 156.4 mg/dL
[128.5 – 175.9] 118.3 mg/dL [108.4 – 133.2] Standard deviation Value 53.9 mg/dL [44.6 – 61.5] 20.1 mg/dL [13.5 – 24.3] Patients with high GV * 3.4 % [0.1-17.8] (1 patient) 0 % [0-11.9] (0 patient)
Coefficient of variation Value 35.2 % [30.6 – 37.7] 17.3 % [12.0 – 20.5] Patients with high GV * 48.3 % [29.4-67.5]
(14 patients) 3.4 % [0.1-17.8] (1 patient) MAGE Value 134.9 mg/dL [111.2 – 155.8] 51.9 mg/dL [32.4 – 62.4] Patients with high GV * 96.6 % [82.2-99.9] (28 patients) 24.1 % [10.3-43.5] (7 patients)
GVP
Value 35.3 %
[24.9 – 47.2]
12.2 % [6.2 – 18.8] Patients with high GV * 24.1 % [10.3-43.5]
(7 patients)
0% [0-11.9] (0 patient)
Values of GV indices are expressed with median and interquartile range. Proportion of patients with high GV are expressed in percentage, 95% confidence interval and number of patients concerned. * The threshold defining high glycemic variability are: a standard deviation greater than 50% of mean glucose, a coefficient of variation ≥ 36%, a MAGE > 65 mg/dL, a GVP > 50%.
Figure 2. Glycemic variability indices before (dark grey) and 6 months after (light grey) islet transplantation.
Figure 3. Percentage of patients with low or high glycemic variability, according to the threshold defining high glycemic variability before (M0) and 6 months after (M6) islet transplantation.
Standard deviation Coefficient of variation
Table 3. ROC curves established for each glycemic variability indice at 6 months post-transplant, with β-score as the referential success criterion.
Standard deviation Coefficient of variation
MAGE GVP AUC = 88.6 % 95% CI = 75.5 – 100 % AUC = 81.9 % 95% CI = 66.3 – 97.5 % AUC = 86.7 % 95% CI = 73.0 – 100 % AUC = 88.6 % 95% CI = 75.8 – 100 %
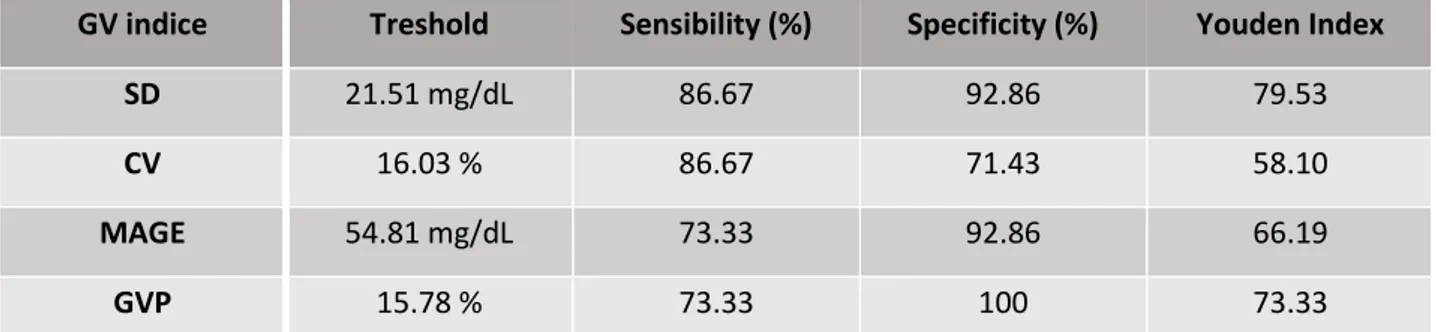
Table 4. Selected thresholds for diagnosis of islet transplantation success at 6 months post-transplant and their diagnostic performance.
GV indice Treshold Sensibility (%) Specificity (%) Youden Index
SD 21.51 mg/dL 86.67 92.86 79.53
CV 16.03 % 86.67 71.43 58.10
MAGE 54.81 mg/dL 73.33 92.86 66.19
GVP 15.78 % 73.33 100 73.33
GV: glycemic variability; SD: standard deviation; CV: coefficient of variation; MAGE: mean amplitude glycemic excursion; GVP: glycemic variability percentage.
Annexes
Annexe 1. Données à 12 mois post transplantation
Nous avons également réalisé au cours de ce travail l’analyse des données de mesure continue du glucose à 12 mois post-greffe. Le nombre moyen de jours d’enregistrement des données était de 6.2 jours [± 9.7]. L’évolution des indices de variabilité glycémique à 12 mois post-greffe est représentée (en plus de l’évolution à 6 mois pour faciliter la comparaison) dans l’Annexe 1.1, 1.2 et 1.3. Entre 6 et 12 mois post-transplantation, le MAGE s'est amélioré significativement (p = 0,043). Pour les autres indices, on observe en revanche une augmentation minime mais statistiquement significative des scores de variabilité glycémique (p = 0,023 pour l’écart-type, p = 0,039 pour le coefficient de variation, p = 0,013 pour le GVP).
Les courbes ROC établies à 12 mois post-transplantation sont représentées dans l’Annexe 1.4. Toutes les courbes ROC à M12 étaient également utilisables (aire sous la courbe supérieure à 70% et intervalle de confiance n'incluant pas la valeur 50%).
Les seuils sélectionnés pour distinguer « succès » et « échec » de la transplantation d’îlots à 12 mois post-greffe ainsi que leurs performances diagnostiques sont rapportés dans l’Annexe 1.5.
Annexe 1.1. Evolution of mean glucose level and glycemic variability indices and proportion of patients with high GV before, six months and twelve after islets transplantation.
Before transplantation 6 months after transplantation 12 months after transplantation Mean glucose level Value 156.4 mg/dL [128.5 – 175.9] 118.3 mg/dL [108.4 – 133.2] 121.1 mg/dL [108.3 – 132.4] Standard deviation Value 53.9 mg/dL [44.6 – 61.5] 20.1 mg/dL [13.5 – 24.3] 21.1 mg/dL [17.2 – 32.5] Patients with high
GV * 3.4 % [0.1-17.8] (1 patient) 0 % [0-11.9] (0 patient) 0 % [0-11.9] (0 patient) Coefficient of variation Value 35.2 % [30.6 – 37.7] 17.3 % [12.0 – 20.5] 19.0 % [13.7 – 25.9] Patients with high
GV * 48.3 % [29.4-67.5] (14 patients) 3.4 % [0.1-17.8] (1 patient) 10.3 % [2.2-27.4] (3 patients) MAGE Value 134.9 mg/dL [111.2 – 155.8] 51.9 mg/dL [32.4 – 62.4] 49.7 mg/dL [39.9 – 88.4] Patients with high
GV * 96.6 % [82.2-99.9] (28 patients) 24.1 % [10.3-43.5] (7 patients) 48.3 % [29.4-67.5] (14 patients) GVP Value 35.3 % [24.9 – 47.2] 12.2 % [6.2 – 18.8] 14.9 % [10.2 – 21.5] Patients with high
GV * 24.1 % [10.3-43.5] (7 patients) 0% [0-11.9] (0 patient) 6.9 % [0.8-22.8] (2 patients)
Values of GV indices are expressed with median and interquartile range. Proportion of patients with high GV are expressed in percentage, 95% confidence interval and number of patients concerned.
* The threshold defining high glycemic variability are: a standard deviation greater than 50% of mean glucose, a coefficient of variation ≥ 36%, a MAGE > 65 mg/dL, a GVP > 50%.
Annexe 1.2. Glycemic variability indices before (dark grey), 6 months after (light grey) and 12 months after (white) islet transplantation.
A . B. C . D .
Annexe 1.3. Percentage of patients with low or high glycemic variability, according to the threshold defining high glycemic variability before (M0), 6 months after (M6) and 12 months after (M12) islet transplantation.
A. Standard deviation B. Coefficient of variation
Annexe 1.4. ROC curves established for each glycemic variability indice at 12 months post-transplant, with β-score as the referential success criterion.
Standard deviation Coefficient of variation
MAGE GVP
Annexe 1.5. Selected thresholds for description of islet transplantation’s success at 12 months post-transplant and their diagnostic performance.
GV indice Treshold Sensibility (%) Specificity (%) Youden Index
SD 31.87 mg/dL 72.73 94.44 67.17 CV 23.56 % 72.73 83.33 56.06 MAGE 120.0 mg/dL 54.55 100 54.55 AUC = 83.3 % 95% CI = 65.0 – 100 % AUC = 76.3 % 95% CI = 56.0 – 96.6 % AUC = 78.3 % 95% CI = 57.8 – 98.7 % AUC = 78.8 % 95% CI = 60.2 – 9.3 %
Annexe 2. Revue de la littérature : moyenne glycémique et scores de variabilité glycémique en populations de volontaires sains, patients diabétiques de type 1 tout venant et après transplantation d’îlots.
Afin de comparer les données de variabilité glycémique obtenues dans notre étude et d’argumenter leur valeur, nous avons complété notre travail par une revue recensant les valeurs de moyenne glycémique et d’écart-type, coefficient de variation, MAGE et GVP dans la littérature. Ces valeurs ont été recherchées en populations de volontaires sains, de patients diabétiques de type 1, et diabétiques de type 1 après transplantation d’îlots. Les valeurs recensées sont regroupées dans le tableau ci-dessous.
Annexe 2. Literature review: mean glucose level and glycemic variability indices (standard deviation, coefficient of variation, MAGE) in populations of healthy volunteers, type 1 diabetic patients, type 1 diabetic patients after islet transplantation.
n Mean glucose level (mg/dL) Standard deviation (mg/dL) Coefficient of variation (%) MAGE (mg/dL)
STUDIES ON TYPE 1 DIABETIC PATIENTS
Reddy et al. 2015 57 158 * 54,86 ** 34 ** 114,93 * Siegelaar et al. 2009 1160 (DCCT population) 210,61 * 74,20 * 35,23 136,69 * Benhamou et al. 2014 30 - - - 135 * Rodbard et al. 2011 64 153,4 a 174,1 b 194,8 c 59,6 a 69,4 b 78,4 c 38,85 39,86 40,25 143,7 a 173,3 b 194,7 c Service et al. 1970 3 d 6 e 112 * 185,5 * - - - - 76 * 162,5 * Crenier et al. 2016 49 164,10 74,5 * 45,4 * 175,7 *
STUDIES ON HEALTHY VOLUNTEERS
Service et al. 1970 3 80,33 * - - 42 * Hanefeld et al. 2010 16 100,72 * 13,85 * 13,75 25,9 * Gude et al. 2017 513 - 14 ** - 26 ** Crenier et al. 2016 35 94,87 11,1 * 11,7 * 27,6 * Zhou et al. 2011 434 104 ** 13,49 ** - 31,11 ** Juvenile diabetes research foundation continuous glucose monitoring study 74 98 * 13,7 ** 14 ** 27,7 **
group 2010
Hill et al. 2011 70 97,12 * 25,18 * 25,93 25,18 *
STUDIES ON TYPE 1 DIABETIC PATIENTS AFTER ISLET TRANSPLANTATION (IT) Vantyghem et al. 2012 33 107,91 *f 111,51 *g 16,19 *f 32,37 *g 15,00 29,03
Kessler et al. 2002 7 (IT after renal
transplant) 104,85 * Ryan et al. 2001 12 54 Brooks et al. 2015 Depending on the estimated function of the graft h: Low : 19 Medium : 15 Good : 17 Excellent : 23 ** 192,45 172,66 154,68 134,89 ** 79,14 46,76 39,57 35,18 41,12 27,08 25,58 26,08 Geiger et al. 2005 6 111,5 * 41 *
* Average ** Median, based on the statistics available in the article
The data in mmol/L were converted to mg/dL by the formula: (mmol/L)/0.0556 = mg/dL
In italics: calculated from the mean glucose level, standard deviation and coefficient of variation values cited in the article.
a In a population of type 1 diabetic patients with good glycemic control b In a population of type 1 diabetic patients with moderate glycemic control c In a population of type 1 diabetic patients with poor blood glucose control d Patients with stable diabetes
e Patients with unstable diabetes f 6 months after islet transplantation g 36 months after islet transplantation
h Estimated function of the graft by measurement of the stimulated C peptide after tolerance test by taking a
Références
1. Holman RR, Paul SK, Bethel MA, Matthews DR, Neil HAW. 10-year follow-up of intensive glucose control in type 2 diabetes. N Engl J Med. 2008 Oct 9;359(15):1577–89.
2. Writing Group for the DCCT/EDIC Research Group, Orchard TJ, Nathan DM, Zinman B, Cleary P, Brillon D, et al. Association between 7 years of intensive treatment of type 1 diabetes and long-term mortality. JAMA. 2015 Jan 6;313(1):45–53.
3. Hirsch IB. Glycemic Variability and Diabetes Complications: Does It Matter? Of Course It Does! Diabetes Care. 2015 Aug;38(8):1610–4.
4. Guerci B. Asymptomatic glycemic instability: how to measure it and which clinical applications? Diabetes Metab. 2003 Apr;29(2 Pt 1):179–88.
5. Gill GV. The spectrum of brittle diabetes. J R Soc Med. 1992 May;85(5):259–61.
6. Benhamou PY, Milliat-Guittard L, Wojtusciszyn A, Kessler L, Toso C, Baertschiger R, et al. Quality of life after islet transplantation: data from the GRAGIL 1 and 2 trials. Diabet Med J Br Diabet Assoc. 2009 Jun;26(6):617–21.
7. Kent LA, Gill GV, Williams G. Mortality and outcome of patients with brittle diabetes and recurrent ketoacidosis. Lancet Lond Engl. 1994 Sep 17;344(8925):778–81.
8. Saisho Y. Glycemic Variability and Oxidative Stress: A Link between Diabetes and Cardiovascular Disease? Int J Mol Sci. 2014 Oct 13;15(10):18381–406.
9. Rodbard D. New and improved methods to characterize glycemic variability using continuous glucose monitoring. Diabetes Technol Ther. 2009 Sep;11(9):551–65.
10. Fabris C, Facchinetti A, Sparacino G, Zanon M, Guerra S, Maran A, et al. Glucose variability indices in type 1 diabetes: parsimonious set of indices revealed by sparse principal component analysis. Diabetes Technol Ther. 2014 Oct;16(10):644–52.
11. Scheiner G. CGM Retrospective Data Analysis. Diabetes Technol Ther. 2016 Feb 1;18(Suppl 2):S2-14-S2-22.
12. Service FJ, Molnar GD, Rosevear JW, Ackerman E, Gatewood LC, Taylor WF. Mean Amplitude of Glycemic Excursions, a Measure of Diabetic Instability. Diabetes. 1970 Sep 1;19(9):644–55.
13. Peyser TA, Balo AK, Buckingham BA, Hirsch IB, Garcia A. Glycemic Variability Percentage: A Novel Method for Assessing Glycemic Variability from Continuous Glucose Monitor Data. Diabetes Technol Ther. 2018 Jan;20(1):6–16.
14. Wojtusciszyn A, Branchereau J, Esposito L, Badet L, Buron F, Chetboun M, et al. Indications for islet or pancreatic transplantation: Statement of the TREPID working group on behalf of the Société francophone du diabète (SFD), Société francaise d’endocrinologie (SFE), Société francophone de transplantation (SFT) and Société française de néphrologie - dialyse - transplantation (SFNDT). Diabetes Metab. 2018 Sep 14;
15. Ryan EA, Paty BW, Senior PA, Lakey JRT, Bigam D, Shapiro AMJ. Beta-score: an assessment of beta-cell function after islet transplantation. Diabetes Care. 2005 Feb;28(2):343–7.
16. Rickels MR, Stock PG, de Koning EJP, Piemonti L, Pratschke J, Alejandro R, et al. Defining Outcomes for β-cell Replacement Therapy in the Treatment of Diabetes: A Consensus Report on the Igls Criteria From the IPITA/EPITA Opinion Leaders Workshop. Transplantation. 2018;102(9):1479–86. 17. Lablanche S, Vantyghem M-C, Kessler L, Wojtusciszyn A, Borot S, Thivolet C, et al. Islet
transplantation versus insulin therapy in patients with type 1 diabetes with severe hypoglycaemia or poorly controlled glycaemia after kidney transplantation (TRIMECO): a multicentre, randomised controlled trial. Lancet Diabetes Endocrinol. 2018 May 15;
18. Hirsch IB. Glycemic variability: it’s not just about A1C anymore! Diabetes Technol Ther. 2005 Oct;7(5):780–3.
19. Ceriello A, Monnier L, Owens D. Glycaemic variability in diabetes: clinical and therapeutic implications. Lancet Diabetes Endocrinol. 2018 Aug 13;
20. Rodbard D. Interpretation of continuous glucose monitoring data: glycemic variability and quality of glycemic control. Diabetes Technol Ther. 2009 Jun;11 Suppl 1:S55-67.
21. Miller KM, Foster NC, Beck RW, Bergenstal RM, DuBose SN, DiMeglio LA, et al. Current state of type 1 diabetes treatment in the U.S.: updated data from the T1D Exchange clinic registry. Diabetes Care. 2015 Jun;38(6):971–8.
22. CITR 9th Annual Report | CITR [Internet]. [cited 2018 May 2]. Available from: https://citregistry.org/content/citr-9th-annual-report
23. Monnier L, Colette C, Wojtusciszyn A, Dejager S, Renard E, Molinari N, et al. Toward Defining the Threshold Between Low and High Glucose Variability in Diabetes. Diabetes Care. 2017;40(7):832– 8.
24. Su G, Mi S, Tao H, Li Z, Yang H-X, Zheng H, et al. Impact of admission glycemic variability, glucose, and glycosylated hemoglobin on major adverse cardiac events after acute myocardial infarction. Diabetes Care. 2013 Apr;36(4):1026–32.
25. Vantyghem M-C, Raverdy V, Balavoine A-S, Defrance F, Caiazzo R, Arnalsteen L, et al. Continuous glucose monitoring after islet transplantation in type 1 diabetes: an excellent graft function (β-score greater than 7) Is required to abrogate hyperglycemia, whereas a minimal function is necessary to suppress severe hypoglycemia (β-score greater than 3). J Clin Endocrinol Metab. 2012 Nov;97(11):E2078-2083.
26. Kessler L, Passemard R, Oberholzer J, Benhamou PY, Bucher P, Toso C, et al. Reduction of blood glucose variability in type 1 diabetic patients treated by pancreatic islet transplantation: interest of continuous glucose monitoring. Diabetes Care. 2002 Dec;25(12):2256–62.
30. Zhou J, Li H, Ran X, Yang W, Li Q, Peng Y, et al. Establishment of normal reference ranges for glycemic variability in Chinese subjects using continuous glucose monitoring. Med Sci Monit Int Med J Exp Clin Res. 2011 Jan;17(1):CR9-13.
31. Hill NR, Oliver NS, Choudhary P, Levy JC, Hindmarsh P, Matthews DR. Normal reference range for mean tissue glucose and glycemic variability derived from continuous glucose monitoring for subjects without diabetes in different ethnic groups. Diabetes Technol Ther. 2011 Sep;13(9):921– 8.
32. Reddy M, Godsland IF, Barnard KD, Herrero P, Georgiou P, Thomson H, et al. Glycemic Variability and Its Impact on Quality of Life in Adults With Type 1 Diabetes. J Diabetes Sci Technol. 2015 Aug 18;10(1):60–6.
33. Siegelaar SE, Kilpatrick ES, Rigby AS, Atkin SL, Hoekstra JBL, Devries JH. Glucose variability does not contribute to the development of peripheral and autonomic neuropathy in type 1 diabetes: data from the DCCT. Diabetologia. 2009 Oct;52(10):2229–32.
34. Benhamou PY, Somers F, Lablanche S, Debaty I, Borel AL, Nasse L, et al. Impact of flexible insulin therapy on blood glucose variability, oxidative stress and inflammation in type 1 diabetic patients: the VARIAFIT study. Diabetes Metab. 2014 Sep;40(4):278–83.
35. Rodbard D. Clinical interpretation of indices of quality of glycemic control and glycemic variability. Postgrad Med. 2011 Jul;123(4):107–18.
36. Crenier L, Lytrivi M, Van Dalem A, Keymeulen B, Corvilain B. Glucose Complexity Estimates Insulin Resistance in Either Nondiabetic Individuals or in Type 1 Diabetes. J Clin Endocrinol Metab. 2016 Apr;101(4):1490–7.
37. Hanefeld M, Koehler C, Hoffmann C, Wilhelm K, Kamke W, Gerstein H. Effect of targeting normal fasting glucose levels with basal insulin glargine on glycaemic variability and risk of hypoglycaemia: a randomized, controlled study in patients with early Type 2 diabetes. Diabet Med J Br Diabet Assoc. 2010 Feb;27(2):175–80.
38. Gude F, Díaz-Vidal P, Rúa-Pérez C, Alonso-Sampedro M, Fernández-Merino C, Rey-García J, et al. Glycemic Variability and Its Association With Demographics and Lifestyles in a General Adult Population. J Diabetes Sci Technol. 2017 Jul;11(4):780–90.
39. Juvenile Diabetes Research Foundation Continuous Glucose Monitoring Study Group, Fox LA, Beck RW, Xing D. Variation of interstitial glucose measurements assessed by continuous glucose monitors in healthy, nondiabetic individuals. Diabetes Care. 2010 Jun;33(6):1297–9.
40. Danne T, Nimri R, Battelino T, Bergenstal RM, Close KL, DeVries JH, et al. International Consensus on Use of Continuous Glucose Monitoring. Diabetes Care. 2017 Dec;40(12):1631–40.
41. Bergenstal RM, Ahmann AJ, Bailey T, Beck RW, Bissen J, Buckingham B, et al. Recommendations for standardizing glucose reporting and analysis to optimize clinical decision making in diabetes: the ambulatory glucose profile. J Diabetes Sci Technol. 2013 Mar 1;7(2):562–78.
Conclusion générale
Cette étude met en évidence l’impact significatif de la transplantation d’îlots pancréatiques sur la réduction de la variabilité glycémique des patients atteints de diabète de type 1. Cette méthode de traitement permet également une réduction significative du pourcentage de patients présentant une variabilité glycémique élevée. Nous proposons ici des seuils pour l'écart type, le coefficient de variation, MAGE et GVP, afin de distinguer « succès » et « échec » de la transplantation d’îlots. Ces seuils peuvent être utilisés comme un outil clinique rapide dans le suivi des patients diabétiques de type 1 greffés et permettent une meilleure exploitation de la richesse des informations apportées par la surveillance continue du glucose.
Remerciements
Aux membres du jury
Au Professeur Olivier CHABRE. Merci d’avoir accepté de présider ce jury. Merci d’avoir été pendant mon externat le professeur dont les cours de FIHU ont déclenché cette petite étincelle qui m’a mené vers cette belle spécialité. Merci du plaisir que vous prenez à enseigner et répéter, sans jamais vous lasser ou presque (« Mais enfin Manon… »). J’espère que vous ne m’en voulez pas d’avoir mis cette splendide perruque et vos chaussures pour la vidéo de la revue des patrons.
Au Docteur Sandrine LABLANCHE. Merci Sandrine de m’avoir encadrée et aidée dans ce master et ce travail de thèse. Mais surtout merci de nous transmettre tous les jours ton goût pour la diabétologie et les nouvelles technologies, ta rigueur et ton sens de l’organisation. Je n’ai jamais compris où tu trouves le temps de tout faire. Merci de me faire rire avec les histoires de tes patients récalcitrants, de tes larmes incomprises devant Avengers, de tes voitures … et encore désolée pour le phare arrière gauche ! Au Professeur Anne-Laure BOREL. Merci Anne-Laure pour toutes les connaissances que tu t’acharnes à nous transmettre, pour les cours de Pubmed, pour les visites animées par les détails croustillants de l’histoire du LDL cholestérol… Continues à épater tous les externes (et ma propre personne aux biceps faibles) par tes tractions en début de visite, ça fait à chaque fois son petit effet.
Au Professeur Pierre-Yves BENHAMOU. Merci pour votre soutien et votre aide pendant ces cinq années, et pour m’avoir transmis votre passion pour la diabétologie au cours de mes premières années
d’internat. J’admire votre calme, votre bienveillance et votre patience sans faille (il y a un dicton qui dit qu’on ne sera jamais vraiment interne d’endocrino tant qu’on n’a pas pleuré dans votre bureau, et je n’ai pas dérogé…)
A toutes les personnes ayant participé à ma formation
A mes autres « chefs » à Grenoble : les Dr Marie MULLER, Dr Nelly WION, Dr Isabelle DEBATY, Dr Marine CHOBERT-BAKOULINE, Dr Anne SPITERI, Dr Clémentine DUPUIS, Dr Sandrine COUMES, et maintenant le Dr Cécile BETRY et le Dr Eve MELLOUL (oui, chef !). Merci pour tout ce que vous avez pu m’apporter, chacune avec votre petite touche personnelle, et qui a pu agrémenter mon intérêt pour l’endocrino-diabétologie.
A toutes les équipes de mes autres « terrains » de stage : l’équipe de médecine B de Voiron qui a supporté mes débuts en tant qu’interne, l’équipe d’endocrinologie d’Annecy qui a vu mes débuts dans la spécialité, l’équipe de pédiatrie qui m’a fait découvrir une toute autre façon de travailler avec et pour les patients, l’équipe de Néphrologie de Chambéry qui m’a rendu mon envie de travailler à l’hôpital à un moment où j’en avais bien besoin…
A toutes les secrétaires, infirmières, aides-soignants, ASH des Ecrins surtout mais d’ailleurs aussi. La vie à l’hôpital ne serait pas la même sans vous. Merci pour votre joie de vivre souvent et pour vos coups de
gueule parfois. Merci pour tout ce que vous avez fait pour moi, ce que vous nous apportez à nous les internes, et pour tout ce que vous faites pour rendre la souffrance des patients plus supportable. Mention spéciale pour Laura, petite maman-infirmière, Laura L parce que je ne t’ai jamais vue
autrement qu’avec un grand sourire, Yasmina parce tu as toujours la solution à nos problèmes, Isa pour ton soutien quand je râle parce que je n’ai pas de salle et pour répondre trop gentiment à tous mes mails, Elisabeth parce que c’était génial de t’avoir avec nous ces quelques mois…
A ma famille adorée
A mon papa et ma maman, merci d’avoir rendu tout ça possible, d’avoir trimballé vos enfants adorés à travers le monde, de nous avoir transmis le goût du voyage, de la montagne, du travail bien fait, et de tout le reste. Merci d’avoir fait de nous 3 les personnes que nous sommes, avec nos qualités et nos (petits ?) défauts.
A mes frangins chéris, Marine ma-petite-sœur-mon-grand-amour et Robin mon-grand-frère-que-je-suis toujours-de-très-près. Merci de m’avoir supporté toutes ces années et de continuer à le faire, parce c’est toujours un grand bonheur de passer du temps avec vous.
A Auré et Willie, merci d’avoir rejoint la famille !
A Clémence, ma première nièce, tu es si petite mais je t’aime déjà si fort.
A Mamé et Papé, merci de nous avoir toujours tous regroupés à Grenoble, au Grand-Serre, au Pénéqué, d’avoir supporté les spectacles, les repas cochons, les jeux, les cris… Tous ces petits moments qu’aucun de nous n’oubliera. Mamé, merci d’avoir gravé dans ma tête que « s’il y a un problème c’est qu’il y a une solution » et Papé, malgré tous les plagiaires tu restes mon Dr Jalbert à moi.
A Chantal, ma mamy Basilic, tu as beau geler à moins de dix degrés tu es tellement forte… J’aime tous ces petits moments passés à tes côtés. Merci pour la confiance que tu m’accordes et pour le sourire sur ton visage à chaque fois que tu m’ouvres ta porte.
A Yves, mon Papy Kikouyou, en me faisant retirer tes points de suture et interpréter tes radios alors que je n’avais plongé mon nez que dans les premières pages de biologie cellulaire tu as montré très (trop ?) tôt ta confiance en mon avenir médical… J’aurais aimé que tu sois là pour l’aboutissement de toutes ces années, mais je crois savoir que quoi qu’il en soit tu aurais été fier.
A mes copains
Le noyau dur… la BAM !
Guigoo le cerveau de la bande (ou presque), après toutes ces années je ne sais toujours pas si je devrais vraiment mais je te voue une entière confiance dans l’organisation de nos virées collectives… Merci de garder une motivation à toute épreuve et de répondre toujours présent.
Mon Kiki (comme ça tu restes anonyme), y’aurait tellement à dire que c’en est simple : restes comme tu es c’est génial ! Entre tes cris de joie, des crises de panique, ton calme à presque toute épreuve, ton énergie débordante, tous plus ou moins justifiés, on ne s’ennuie jamais…
Guigui, tu incarnes pour moi à la fois la bohème et le grand Professeur de neuroloGUI ! J’ai plein de respect pour ton calme, ta tolérance et tes grands projets. Tu nous manqueras au pays des Caribous. Toto et Claire (Hé mais c’est les Aymard !) Vous formez un si joli couple chacun avec votre grain de folie, Toto avec ton humour et ton côté un peu maniaque et Claire avec ton sourire constant et ton côté hippie chic…
… Et les nouveaux arrivants : Flo, merci d’avoir survécu aux premiers temps (on en revient aux crises de panique plus ou moins justifiées héhé), tu as bien mérité ta place. Tiph j’aime ton humour (si si pour de vrai !) et ton rire communicatif.
Sans oublier…
Celles qui étaient là dès le début de ces longues années d’étude, avec qui j’en ai fêté une partie à travers le Pérou la Bolivie et le Chili, et avec qui j’ai toujours un énorme plaisir à passer du temps : Colichon, Mathou, Clem. Merci Clem et Cyril de nous offrir le premier bébé de la bande.
Mon Yaya, mon chercheur fou, merci pour les pâtes au citron, et pour ton air concentré capable de muter en une seconde en un rire d’enfant. Merci pour ces moments, on se marre tellement avec toi. Lisa, mon Foufou, comme tu l’as si bien dit mon coup de cœur amical. Tu es trop loin à Annecy, reviens. Martinus, tu es parti bien loin dans tes contrées Nancéennes mais c’était pour la bonne cause ! Tu as trouvé encore une fois le bon équilibre :)
Vinou et Lili, c’est toujours un plaisir de retrouver vos sourires dans les Landes ou pendant les week-ends ski. Merci pour l’accueil en Gwada et surtout… vive la Planté-Cup !
Aux autres copains qui font des Landes et des autres retrouvailles des moments géniaux : Lexou, Momo, Hadri…
My 10A Family
Nono femme-que-j’aime, ma belle Anthéa, Arnoooooo, Anne our little mum, Ivan, Andréa-Terrone, Etienne, the lovely russian boys Sasha & Vlad, André, Filipe. Thank you for those incredible months in Turku. I am so glad that we managed to meet again in Italy, in France, in Malta, I hope that we will continue to share those beautiful moments together. Love you guys.
Les résistantes Villardiennes
Sarah, ma meilleure coupine, on a été totalement scotchées ensemble pendant plusieurs années et c’est de ma faute si se voit moins. Je ne te remercierai jamais assez d’avoir bravé toutes ces années et d’être toujours là. Je t’aime ma poule.
Marine, merci pour ton rire et ton grain de folie, pour tous les goûters au lycée et pour les dîners maintenant, c’est toujours un plaisir de vous retrouver Yohan et toi.
La smala Abadie
Philippe et Françoise, Yannick, Quentin, Magalie, on a passé tellement de bons moments dans les coins paumés de France et les quatre coins du monde. Vous êtes en grande partie responsables de mon amour du voyage…
La team d’endocrino-diabéto
Sandra, Maurine, Claire, Marie, mes mamans de diabéto, maintenant mamans tout court.
Eve, gardes ton caractère trempé, il fait ta force et est la source de nos fous rires. Juju mon p’tit poulet continues à m’impressionner par ta vitalité et ta capacité à TOUT faire. Jojo ma belle jojo si fragile et si forte à la fois. Sarouh le mange-tout. Paupau et sa paupau-sitive attitude. Camille et ses bébés trop chous. Eléa mon p’tit chat. Jess classe en toute circonstance. Et Nico et Adel, irréductibles gaulois qui résistent encore et toujours à l’envahisseur, continuez à lutter pour l’égalité des sexes les garçons, vous y êtes presque !
Aux co-internes de mes stages successifs
Pauline et Arnaud ma première équipe, merci pour ce semestre de démarrage à Voiron.
Noémie (et Pierre !) merci pour ce semestre tout en douceur et en rires à Annecy, pour les Top Chef sous les toits.
Lisa, Eve, Jessica F, Myrtille, cette découverte du CHU sans vous n’aurait pas eu le même goût ! Toutes les filles de pédiatrie, vous m’avez fait rire à chaque fois que je passais la tête dans votre bureau…
Laura et Pauline G merci pour ce semestre d’endocrino qui est resté cool malgré les milliards de courriers contre lesquels on n’a pas arrêté de râler.
Et enfin…
A toi, mon Be, merci pour tout. J’aime tellement être accompagnée tous les jours de ta bonne humeur et de ton envie de découvrir tout ce qui te passe sous le nez. De nos débuts (toi pirate et moi ouvrier des Village People) à ce jour je ne me suis jamais ennuyée. Et si c’est au prix d’avions manqués, de valises oubliées… et même si c’en est devenu un verbe et que je continue de me faire « Beubeutiser » 😉, je voudrais que ça ne soit qu’un début et que ça continue le plus longtemps possible… Je t’aime, parole de Dim Sum et de petit nuage blanc.