UNITS IN RESPONSE TO VOLTAGE
DISTURBANCES
Gilles CHASPIERRE, UNIVERSITÉ DE LIÈGE Key Words: Dynamic simulations, Grid requirements, PV model.
Sum
m
ar
y
The objective of this work was to build a simplified mathematical model of
distributed photovoltaic (PV) units representing small-scale systems accounting for residential installations. These installations are generally connected to the Low Voltage (LV) network but can be aggregated to a Medium Voltage (MV) bus through equivalent impedance accounting for the distribution feeder and the transformer. The model represents reliably the dynamic behavior of small-scale PV units in response to grid voltage disturbances according to new connection
requirements. It focuses on grid interactions through the electronic interface and does not propose a detailed mathematical representation of each physical component of the system. Therefore, the mathematical model is based on recent/near future grid requirements and ancillary services that should be provided by PV units to support the grid during a fault. The proceedings of this work can be divided in three parts. First, one third of the time has consisted in the review of the literature and grid codes to make out a list of PV model
specifications. The most important specifications are the Low Voltage Ride-Through (LVRT) capability, the voltage support through reactive current injection and the active-reactive strategy during a fault. During the second third of the time, the dynamic model of PV units has been built based on existing elaborated models that have been improved in order to implement the PV model
specifications. Finally, the remaining time has been devoted to dynamic
simulations using a 75-bus MV test network where PV units have been attached to each node next to static and dynamic loads. The external transmission system has been represented by its Thevenin equivalent defined by its short circuit power. First, simulations have been made in order to validate the model. Then different scenarios interesting from a System Operator point of view have been
investigated in order to see how the units react in particular fault/low voltage situations. The figure 1 shows the fast increase in PV units installed capacity around the world that clearly illustrates the needs in the introduction of new PV units grid requirements and in new models implementing these requirements.
Ré
su
m
é
L’objectif de ce travail était de construire un modèle mathématique simplifié d’unités photovoltaïques distribuées représentant des systèmes à petite échelle telles que les installations résidentielles. Celles-ci sont généralement connectées au réseau basse tension mais peuvent être agrégées en un nœud en moyenne tension à travers une impédance équivalente qui tient compte à la fois de l’impédance du feeder et de l’impédance du transformateur basse tension. Le modèle développé ici représente de manière fiable le comportement dynamique des petites unités photovoltaïques en réponse à une perturbation en tension dans le réseau et en accord avec les récents « connection requirements ». Le modèle se concentre sur les interactions avec le réseau plutôt que de modéliser
mathématiquement tous les composants physiques du système. C’est pourquoi le modèle mathématique est plutôt basé sur des « grid codes » assez récents et futuristes ainsi que sur les services auxiliaires que les panneaux photovoltaïques sont sensés pouvoir fournir au réseau afin de le soutenir pendant un défaut. La procédure qui a été effectuée pour ce travail peut être divisée en trois parties. La première consistait à revoir la littérature dans le domaine ainsi que parcourir les différents « grid codes » de manière à dresser une liste des spécificités du modèle. Les plus importantes d’entre elles sont l’implémentation de la « Low Voltage Ride-Through » (LVRT), de l’injection de courant réactif de manière à soutenir la tension aux bornes de l’installation photovoltaïque et la stratégie actif-réactif pendant un défaut. Dans un deuxième temps, le modèle mathématique proprement dit a été construit en se basant sur des modèles existants et en les modifiant/améliorant de manière à pouvoir implémenter les différentes
spécificités souhaitées. Finalement, la dernière étape du travail a été consacrée aux simulations dynamiques utilisant un réseau test en moyenne tension de 75 nœuds où les unités photovoltaïques ont été attachées à côté de modèles de charge statiques et dynamiques. Le réseau de transmission externe est représenté par son équivalent de Thévenin défini par sa puissance de court-circuit. Dans un premier temps, des simulations ont été faites pour valider le modèle. Ensuite, différents scénarios intéressants pour les opérateurs du réseau ont été réalisées afin de voir comment réagissent les panneaux dans certaines situations
particulières. La figure 1 montre de manière explicite à quel point la capacité photovoltaïques installées augmentent rapidement et interpelle sur la nécessité d’introduire des « grid codes » élaborés ainsi que des nouveaux modèles mathématiques simples les implémentant.
Sa
m
env
at
ting
Bedoeling van dit werk was een vereenvoudigd wiskundig model te bouwen van verspreide fotovoltaïsche (PV) eenheden die kleinschalige systemen voorstellen voor residentiële installaties. Deze installaties zijn meestal aangesloten op het laagspanningsnet (LS-net) maar kunnen geaggregeerd worden tot een
middenspanningsknooppunt (MS-knooppunt) door middel van een equivalente impedantie die de distributiefeeder en de transformator voorstelt. Het model stelt op betrouwbare wijze het dynamisch gedrag voor van kleinschalige PV-eenheden als reactie op netspanningsstoringen conform de nieuwe aansluitingsvereisten. Het richt zich op netinteracties via de elektronische interface en biedt geen gedetailleerde wiskundige weergave van elke fysieke component van het
systeem. Daarom is het wiskundige model gebaseerd op recente (of in de nabije toekomst te verwachten) netvereisten en ondersteunende diensten die door PV-eenheden moeten worden geleverd om het netwerk tijdens een storing te ondersteunen. Dit werk kan in drie delen worden verdeeld. Ten eerste werd een derde van de tijd besteed aan het bestuderen van de literatuur en netcodes om de PV-modelspecificaties op te lijsten. De belangrijkste specificaties zijn de Low Voltage Ride-Through (LVRT)-capaciteit, de spanningsondersteuning door middel van reactieve stroominjectie en de active-reactive strategie tijdens een fout. Tijdens het tweede derde van de tijd werd het dynamische model van
PV-eenheden gebouwd op basis van bestaande uitgewerkte modellen die verbeterd werden om de PV-modelspecificaties te implementeren. Ten slotte werd de resterende tijd besteed aan dynamische simulaties met behulp van een
75-knooppunten MS-testnetwerk, waarbij naast statische en dynamische belastingen PV-eenheden aan elk knooppunt zijn toegevoegd. Het externe transmissienet werd voorgesteld door zijn Thevenin-equivalent, bepaald door zijn
kortsluitingsvermogen. Eerst zijn er simulaties gemaakt om het model te
valideren. Vervolgens zijn verschillende scenario's die interessant zijn vanuit het oogpunt van een systeemoperator onderzocht om te zien hoe de eenheden reageren in speciale fouttoestanden of bij spanningsdalingen. Figuur 1 toont de snelle toename van de geïnstalleerde capaciteit van PV-eenheden over de hele wereld. Ze toont duidelijk aan dat er behoefte is aan het invoeren van nieuwe vereisten voor PV-eenheden en nieuwe modellen die deze vereisten
implementeren.
Fig. 1 – Evolution of the installed PV capacity [1]
I
NTRODUCTION
The growing environmental concern of politics and institutions has led to progressively replace conventional power plants working with fossil fuels by renewable energy sources. For example, in Europe, it is said that renewable energy sources should represent at least 20 % of the European energy mix by 2020. In some countries like Germany and Denmark, important amounts of electricity are already produced by renewable energy sources. The recent entry into force of the COP 21 agreement thanks to the ratification of the treaty by Canada will probably emphasize and spread this phenomenon around the world. Therefore it is expected in the future an acceleration of the progressive retirement of conventional power plants connected to the transmission systems replaced by renewable energy sources generally connected to lower voltage levels. This leads to the apparition of active distribution networks that can even
consume or produce electricity depending on the load and wheatear conditions. These active distribution networks will strongly impact the dynamic behavior of the electric power system, which has not been designed for that. It is therefore essential to develop generic and simplified dynamic model of renewable energy sources like it is presented in this paper in order to carry out stability studies through dynamic simulations in short computation times. The remaining of the paper is organized as follows. The section 2 presents the main PV grid requirements. The validation of the PV mathematical model is shown in section 3. A sample of results presenting scenarios interesting for System Operators is provided in section 4 and finally, a small conclusion and some
1
PV
MODEL GRID REQUIREMENTS
The work has mainly focused on voltage issues and then it investigates only related grid requirements. The most important requirements of PV units are listed below:
• the Low Voltage Ride-Through (LVRT): Units are assumed to remain connected to the grid during a fault as long as the voltage is above a reference curve;
• Voltage support through reactive current injection: Units may be requested to inject reactive current into the grid in order to support the terminal voltage; • Active-reactive strategy: For efficient voltage support, units are assumed to give
priority to reactive current during a fault. This may require to reduce the active current in order to avoid exceeding the inverter current limit.
An illustration of an LVRT curve and a reactive injection requirement are shown in Fig. 2 and 3, respectively.
The design of the LVRT curve has been selected based on discussions with elia. It has been decided that the tolerated residual voltage magnitude should not be too high in order to avoid disconnection in case of a fault occurring in the High Voltage grid. Indeed, that type of fault will be experienced by an important number of units and a simultaneous disconnection could lead to serious impacts on the Power System. On the contrary, the residual voltage magnitude of the LVRT should not be too low either. Actually, when the measured voltage magnitude by the units is very low, it generally means that the fault is located not far from these units, i.e. in the distribution grid. The latter are then participating to the short circuit current. Moreover, the opening of the distribution network protection, generally located at the top of the feeder will not
prevent the units to feed the fault. It is then preferable to see these units that trip in that particular situation. Finally, the slope of the LVRT curve during voltage recovery is
selected for islanding detection. This part will be more investigated latter in the paper. It is seen in Fig. 3 that the units start injecting reactive current into the grid once the measured terminal voltage has fallen below 0.9 pu, it is said that we are in low voltage situation. At 0.9 pu, the units inject already a reactive current representing 20 % of the nominal current of the inverter. If the voltage keeps decreasing, the reactive current injection increases as well according to a constant slope until the voltage reaches 0.5 pu. Below, since such low voltage situation generally lasts for a very short time, it has been assumed that the inverter is able to provide a reactive current magnitude
above the nominal current. 𝐼"#$ is the maximum current of the inverter in fault situation.
Fig. 2: An example of LVRT curve Fig. 3: Reactive current injection
Each unit is equipped with a Phase Locked Loop controller that ensures synchronization of the current injected by the PV unit with the grid voltage. The speed response of the PLL can be adjusted.
2
PV
MODEL VALIDATION
2.1 Current injection in response to different voltage sags
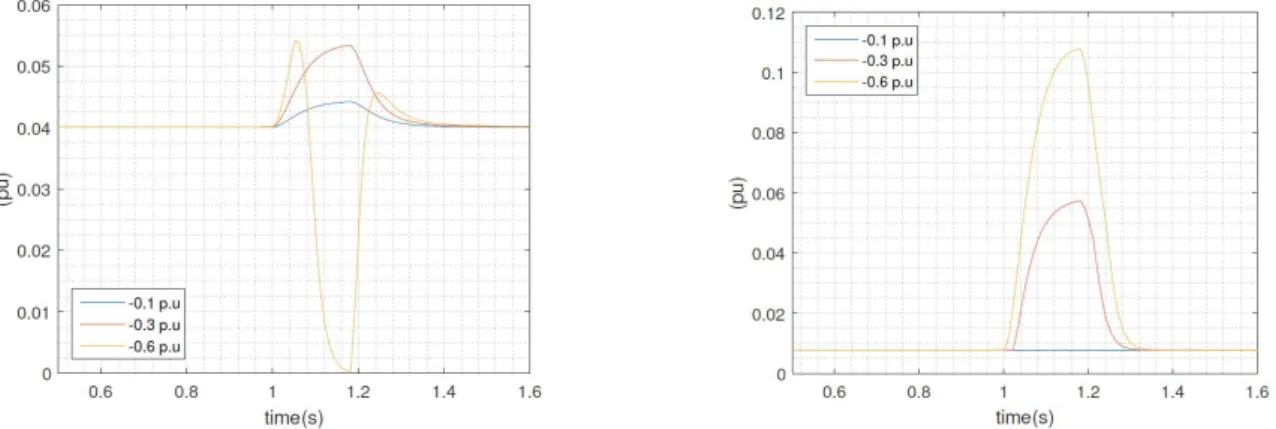
The figure 4 depicts the active and reactive current injection of one PV unit in response to different voltage sags applied on the transmission grid. As expected, the reactive current injection increases as the voltage sag increases as long as the residual terminal voltage is below 0.9 pu. The active current, for small voltage deviations, increases as the voltage decreases and the active power output of the PV unit is kept constant. However, when the reactive current injection is important as for the bigger voltage drop (-0.6 pu), the active current output starts to be scarifying and is then reduced in order to not exceed the inverter maximum current value.
Fig. 4: Active(left) and reactive(right) current injection in response to voltage sags on the transmission system
2.2 LVRT analysis
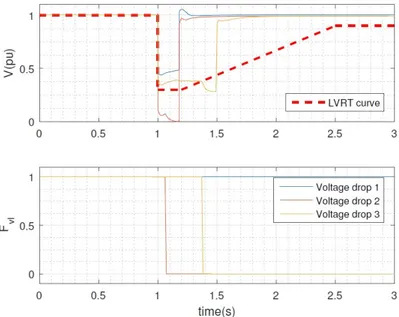
The figure 5 compares some voltage profiles of a PV unit terminal during faults to the
LVRT curve. They are associated with their respective discrete variable 𝐹&' which
indicates if the PV unit is connected (𝐹&' = 1) or disconnected (𝐹&' = 0) from the grid. It is
shown that the LVRT control unit makes its job very well. The first voltage drop in blue
remains above the LVRT curve and then 𝐹&' stays at one, i.e. the PV unit remains
connected to the network. The second voltage drop is more important, the voltage
reaches zero pu, and makes the units almost immediately trip. 𝐹&' falls to zero with a
small delay due to voltage measurement operation. The third voltage drop is less important but its duration has been exaggerated to observe the effect on the LVRT control. At 1.35 s, the voltage falls below the LVRT curve and the PV unit disconnects after a delay of 50 ms because of the measurement delay. It is also noticed that the voltage is further reduced when the PV unit has tripped since the latter was participating in voltage support providing reactive power.
Fig. 5: LVRT analysis for three different fault situations
3
S
AMPLE OF RESULTS
In this section, some scenarios interesting for System Operators are tested and briefly analysed.
3.1 Fault in the Very High Voltage network
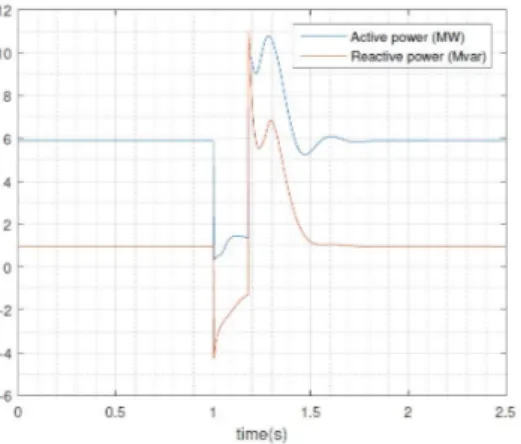
A short-circuit starting at 1 s and lasting 180 ms is simulated in the Very High Voltage (VHV) network leading to a residual voltage of 0.25 pu at the entry point of the distribution grid. The power flows from the transmission system to the distribution system are depicted in Fig. 6. It is observed that the level of both active and reactive powers are the same before and after the fault. It can be then concluded that no PV unit has tripped, which is what is desired for the reason explained in section 2.
Fig. 6: Active and reactive power through the distribution transformer for a VHV fault
3.2 Fault on one distribution feeder of the test system
A short-circuit starting at 1 s and lasting 1 s has been simulated on one feeder of the
distribution grid. The figure 7 shows the transition in the discrete variable 𝐹&' which
indicates if the PV units are connected (𝐹&' = 1) or disconnected (𝐹&' = 0) from the
faulted feeder. It is seen that all variables fall to zero before the fault is cleared meaning that all units connected to the faulted feeder have tripped. This behaviour is also the one expected by System Operators.
Fig. 7: Variation in the discrete variable representing the disconnection of units from the grid
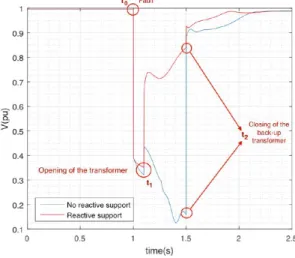
will be observed, which is obviously not the case when the units are not supporting the voltage. In that situation, the PV units voltage support may be considered as a
disadvantage. Indeed, reclosing the circuit onto an active island may induce problems with the utility’s equipment, or cause automatic reclosing systems to fail to notice the problem. This issue may require some improvements in the reactive injection service.
Fig. 8: Voltage at the entry point of the distribution grid in islanding situation with and without reactive support of PV units
4
P
RESENTATION OF AN EQUIVALENT
MV
NETWORK MODEL
This section proposes an equivalent MV network model to simplify transmission side simulations. The model is represented in Fig. 9 and has been build based on the following assumptions:
• each individual component has been aggregated in one single equivalent component accounting for all the individual components in the distribution grid (static loads, motors and PV units);
• the capacity of the PV units is uniform among the different bus and then the network voltage is almost uniform from one bus to another;
• a voltage drop at the transmission side will lead to the same residual voltage at the terminal of each unit;
• the external transmission system is still represented by its Thevenin equivalent; • the transformer is unchanged and is the Point of Interconnection (POI) with the
transmission system.
A consequence of the uniform voltage assumption will be a simultaneous
disconnection of all the units in case of a severe fault close to the entry point of the distribution network. The equivalent model presents some limitations since it is not able to represent partial disconnection of the PV units during a fault.
Fig 9: Equivalent MV network model
This model has shown good performances in reproducing the voltage response at the POI with the transmission grid as long as the uniform voltage assumption is respected.
5
C
ONCLUSION AND RECOMMENDATIONS
This paper has presented a reliable dynamic model of small-scale residential PV units connected to LV network and aggregated to the MV network. This model has been build based on nowadays most elaborated model of small-scale PV units and on current grid codes presenting technical requirements and ancillary services that PV units should provide. Based on these elements, the PV model specifications have been defined in section 2. Based on that list of specifications, a PV mathematical model has been built. This model has proven to reliably reproduce the dynamic response of PV units in the event of a fault. Moreover, some simulations of interest for System Operators
(TSO/DSO) has been performed and the results seem to be in agreement with their expectations except for the islanding situation. Some PV units grid requirement may need to be reviewed for this last point. This paper has ended by proposing an equivalent MV grid model able to reliably reproduce the voltage response of the detailed system at the POI with the transmission grid. However, some strong
assumptions on the voltage network have been made. As future recommendations, the PV model should be improved in order to also take into account responses to frequency deviations. Moreover, the model should ideally be entirely generic and the model parameters should be easily changed in order to be able to accommodate different grid codes. This generic model should be able to represent an equivalent model of a large population of PV units of different sizes and implementing different grid requirements. Moreover, it should be used in the implementation of equivalent active distribution
R
EFERENCES
[1] ISE Fraunhofer Institute for Solar Energy Systems. “Photovoltaïc Report”, Freidburg, 17 November 2015. Available: https://www.ise.fraunhofer.de/de/downloads/pdf-files/aktuelles/photovoltaics-report-inenglischer-sprache.pdf
T
HE AUTHOR
Gilles CHASPIERRE
Qualifications
Master in electrical engineering, orientation electric power and energy systems (Full
English). University of Liège [2014-2016] – Magna cum laude
Bachelor Diploma in electrical and mechanical engineering. University of Liège [2011-2014] – Cum laude
Secondary school – Collège Saint François-Xavier 1 Verviers [2005-2011]
Employment History and Experiences
Research Engineer (PhD Student) - University of Liège [October 2016 – Today]
Dynamic modelling of active distribution networks
Master Thesis - Summa cum laude [February – June 2016]
Dynamic Modelling of PV units in response to voltage disturbances
Online Machine Learning Class (MOOC-Coursera) – Stanford University [March-June 2016]
Student Teaching assistant [September 2014- May 2016]
Power System trainee – Tractebel (ENGIE Group) [Augustus-October 2015]
Network Constrains Analysis of the German grid in the scope of the European Power System Observatory (EPSO) project.
Distinction and awards
Award of the AILg for one of the best Master Thesis (2016)
![Fig. 1 – Evolution of the installed PV capacity [1]](https://thumb-eu.123doks.com/thumbv2/123doknet/6806590.189269/4.892.282.626.109.332/fig-evolution-installed-pv-capacity.webp)