Non-Destructive Evaluation of Impact Damage in Carbon
Fibre Reinforced Polymer Using Infrared Thermography and
Shearography
by
Ali KHADEMI FAR
THESIS PRESENTED TO ÉCOLE DE TECHNOLOGIE SUPÉRIEURE IN PARTIAL FULFILLMENT FOR A MASTER’S DEGREE
WITH THESIS IN MECHANICAL ENGINEERING M.A.Sc
MONTREAL, June 23, 2020
ÉCOLE DE TECHNOLOGIE SUPÉRIEURE UNIVERSITÉ DU QUÉBEC
© Copyright reserved
It is forbidden to reproduce, save or share the content of this document either in whole or in parts. The reader who wishes to print or save this document on any media must first get the permission of the author.
BOARD OF EXAMINERS THIS THESIS HAS BEEN EVALUATED BY THE FOLLOWING BOARD OF EXAMINERS
Mr. Martin Viens, Thesis Supervisor
Department of mechanical engineering at École de Technologie Supérieure
Mr. Hakim Bendada, Thesis Co-supervisor
Department of Electrical and Computer Engineering at Laval University
Mr. François Blanchard, President of the Board of Examiners
Department of Electrical and Computer Engineering at École de Technologie Supérieure
Jean-François Chatelain, Member of the jury
Department of mechanical engineering at École de Technologie Supérieure
Mr. Xavier Maldague, External Evaluator
Department of Electrical and Computer Engineering at Laval University
THIS THESIS WAS PRESENTED AND DEFENDED
IN THE PRESENCE OF A BOARD OF EXAMINERS AND PUBLIC May 26, 2020
ACKNOWLEDGMENT
I would like to express my sincerest gratitude to my advisor, Dr. Martin Viens, and I am very thankful to him for guiding me during this research. This work would not have been possible without his advice and supports. He gave me lots of freedom to explore the problems that interested me while providing me with the direction that I needed. This thesis is a dedication to him for the willingly supports.
I am grateful for the supervising of Dr. Hakim Bendada. The success of this project would not have been possible without his continued contribution and supports.
Also, I would like to acknowledge oNDuTy! Canada team. The great committee for NDT research and development in Canada, for giving me this opportunity and supporting me emotionally and financially during my M.Sc. degree study. I wish to acknowledge Dr. Celemte Ibarrac, the coordinator, Dr. Xavier Maldague, the director of the program, and the other faculty members and students.
Also, I would like to acknowledge our research partner Centre Technologique en Aérospatiale (CTA) and its staff, Louis Daniel, Julian Walter and Olivier Ares, for giving me this opportunity and supporting me technically during the work.
The support of the Mechanical department’s faculty and staff at ETS is appreciated. It is an honour for me to get my Master's degree from this great university.
This thesis is proudly dedicated to: my beautiful wife, Mozhdeh,
for her endless love, support and encouragement ,
my mother, Mahvash B. Ahmadi and my father Ardeshir K. Far
Évaluation non destructive des dommages par impact dans un polymère renforcé de fibres de carbone par thermographie infrarouge et shearographie
Ali KHADEMI FAR
Résumé
L'impact à faible vitesse dans les polymères renforcés de fibres de carbone (PRFC) est reconnu comme une cause majeure de défaillance dans les structures aérospatiales. Pour évaluer les défauts dans les PRFC, des contrôles non destructifs (CND) sont utilisés. L'objectif de cette thèse est de comparer les caractéristiques et le potentiel des différentes méthodes de CND pour révéler et dimensionner les dommages par impact dans des panneaux de PRFC. Pour évaluer de tels dommages, des contrôles par ultrasons, thermographie et shearographie ont été effectués. Ces méthodes ont été appliquées pour évaluer les dommages résultant de différents niveaux d'impact sur des composites stratifiés. La taille des dommages est mesurée à l'aide de contrôle par ultrasons. Sur la base des mesures ultrasonores, l’aptitude de la thermographie et de la shearographie à caractériser quantitativement les défauts est étudiée. Les essais expérimentaux montrent que la thermographie infrarouge et la shearographie sont capables d’évaluer quantitativement l’endommagement. Par exemple, dans ces expériences, la shearographie présente une corrélation empirique entre la densité des franges et le niveau d'énergie des impacts. Outre les essais expérimentaux, des simulations par éléments finis ont été effectuées. Ainsi, grâce à des essais virtuels, un modèle numérique permet d’évaluer les performances des méthodes de détection étudiées.
Mots-clés: technique de thermographie infrarouge, contrôle par ultrasons, shearographie, PRFC, dommage par impact, contrôle non destructif, simulation par éléments finis
Non-destructive evaluation of impact damage in carbon fibre reinforced polymer using infrared thermography and shearography
Ali KHADEMI FAR
ABSTRACT
Low-velocity impact in carbon fibre reinforced polymer (CFRP) is known as a major reason for failure in aerospace structures. To evaluate defects in CFRPs, nondestructive testing (NDT) is used. The objective of the thesis is to compare the features and abilities of different NDT methods to reveal and size impact damages in CFRP panels. To assess the damages, ultrasonic testing, thermography, and shearography are conducted. These methods are applied to evaluate damages for different impact levels on composite laminates. The size of the damages is measured using ultrasonic testing. Based on the ultrasound measurements, the defect quantifying abilities of thermography and shearography are investigated. The tests show that infrared thermography and shearography are able to quantify the damages. In the experiments, shearography presents a qualitative correlation between fringe density and level of impact energy. Besides the experimental testing, finite element simulation is used. The simulation can evaluate the methods’ detecting performances through the virtual test.
Keywords: infrared thermography technique, ultrasonic testing, shearography, CFRP, impact damage, non-destructive testing, finite element simulation
TABLE OF CONTENTS
Page
INTRODUCTION………..………..3
CHAPTER 1 . TEST SPECIMEN………..………37
1.1 Overview ...37
1.2 Introduction ...37
1.3 Impact damage ...38
1.4 Barely visible impact damage (BVID) ...39
1.5 Test specimen...40 1.6 Ultrasonic testing ...41 1.6.1 UT background ... 41 1.6.2 Sound reflection ... 42 1.6.3 Beam characteristics ... 43 1.6.4 Phased-array probe ... 45 1.6.5 Gate ... 45 1.6.6 Displays... 45
1.6.7 Ultrasonic test procedure ... 46
1.6.8 Ultrasonic setup ... 46
1.6.9 Ultrasonic testing results ... 49
CHAPTER 2 INFRARED THERMOGRAPHY TESTING………57
2.1 Overview ...57
2.2 Introduction ...57
2.2.1 Infrared Radiation (IR) ... 57
2.2.2 Blackbody radiation ... 59
2.2.3 IR sensors ... 60
2.2.4 Infrared Thermography approaches ... 61
2.3 Pulse thermography ...63
2.3.1 Thermogram sequence ... 64
2.3.2 Flaw detection ... 65
2.4 Pulse Phased Thermography (PPT) ...66
2.5 Transmission mode ...67
2.5.1 Methodology ... 67
2.6 Experimental procedure ...69
2.6.1 Reflection mode procedure and test parameters ... 70
2.6.2 Transmission mode procedure and test parameters ... 71
2.7 Infrared thermography results ...72
2.7.1 Reflection mode ... 72
2.7.2 Pulse phase thermography ... 75
2.7.3 Transmission mode ... 80
3.1 Overview ...85
3.2 Introduction ...85
3.3 Background ...86
3.3.1 Principle of a digital shearography ... 87
3.3.2 Fringe interpretation... 88
3.3.3 Interpretation of the fringe pattern ... 89
3.3.4 Out-of-plane sensitive shearography ... 91
3.3.5 Fringe phase determination ... 93
3.4 Shearography procedure and test parameters ...94
3.5 Shearography results ...95
CHAPTER 4 NDT SIMULATION……….………..………103
4.1 Overview ...101
4.2 Introduction ...101
4.3 Geometry generation and material properties: ...103
4.4 Meshing...105
4.5 Boundary condition ...106
4.6 Thermography simulation and results ...107
4.7 Shearography simulation ...109
4.8 Shearography simulation result ...110
CONCLUSION…………...………115
LIST OF TABLES
Page
Table 0-1 Point-by-point and Full-field NDT approaches ...29
Table 1-1 Typical impact threats for aircraft wing structures ...39
Table 1-2 Coupons list ...41
Table 1-3 Equipment specification ...46
Table 1-4 Phased array probe parameters ...47
Table 1-5 General parameters ...47
Table 1-6 Phased array parameters ...47
Table 1-7 Flaw sizing by time-of-flight ultrasonic testing ...49
Table 2-1 Indication sizing by PPT ...80
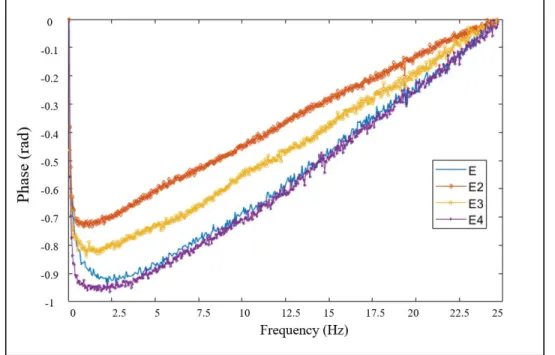
Table 2-2 Thermal diffusivities for E, E2, E3, E4 ...84
Table 3-1 Indication sizing in shearography ...100
LIST OF FIGURES
Page
Figure 0-1 Typical impact damage mode for CFRP laminate ...27
Figure 1-1 Material usage in Airbus A350 XWB ...37
Figure 1-2 Impact damage scenario ...38
Figure 1-3 Damage category ...39
Figure 1-4 Layup configuration and dimension of the laminates ...40
Figure 1-5 Visual depiction of near-field and far-field of a transducer ...43
Figure 1-6 Ultrasonic beam spread ...44
Figure 1-7 Schematic view of electronic scanning of a phased array probe ...45
Figure 1-8 Ultrasonic immersion tank setup ...48
Figure 1-9 TOF technique’s gate setup ...48
Figure 1-10 E2, C-scan of the defect from the (a) tool and (b) bag side ...50
Figure 1-11 E2, B scan of the defect from (a) the tool and (b) bag side ...51
Figure 1-12 E3, C-scan of the defect from the (a) tool and (b) bag side ...52
Figure 1-13 E3, B scan of the defect from (a) the tool and (b) bag side ...53
Figure 1-14 E4, C-scan of the defect from the (a) tool and (b) bag side ...54
Figure 1-15 E4, B scan of the defect from (a) the tool and (b) bag side ...55
Figure 2-1 Electromagnetic bands ...58
Figure 2-2 Planck's law curves for ideal blackbody radiation ...60
Figure 2-3 Variety of IRT scenario ...61
Figure 2-4 Temperature 3D matrix on the time domain ...63
Figure 2-5 Complete thermogram sequence ...64
Figure 2-7 Transformations of thermogram to phasegram ...67
Figure 2-8 Dimensionless temperature history on the rear surface ...69
Figure 2-9 IRT reflection mode ...70
Figure 2-10 IRT reflection setup ...70
Figure 2-11 IRT transmission mode ...71
Figure 2-12 IRT transmission setup ...72
Figure 2-13 pixel intensity profiles correspond to raw thermogram ...73
Figure 2-14 E2 raw thermogram at t = 0.66s ...74
Figure 2-15 E3 raw thermogram at t = 0.66s ...74
Figure 2-16 E4 raw thermogram at t = 0.66s ...75
Figure 2-17 Phase graph of defective and non-defective (reference) area ...76
Figure 2-18 E2 Phasegram, at the frequency of 0.2 Hz ...77
Figure 2-19 E3 Phasegram, at the frequency of 0.2 Hz ...77
Figure 2-20 E4 Phasegram, at the frequency of 0.2 Hz ...78
Figure 2-21 E2, indication sizing by full-width of half-amplitude ...78
Figure 2-22 E3, indication sizing by full-width of half-amplitude ...79
Figure 2-23 E4, indication sizing by full-width of half-amplitude ...79
Figure 2-24 E2, diffusivity map ...81
Figure 2-25 E3, diffusivity map ...81
Figure 2-26 E4, diffusivity map ...82
Figure 2-27 Applying a partial method to determine thermal diffusivity ...82 Figure 2-28 Applying a partial method to determine thermal diffusivity ... Erreur !
Signet non défini.
Figure 2-29 Applying a partial method to determine thermal diffusivity ... Erreur ! Signet non défini.
Figure 2-30 Applying a partial method to determine thermal diffusivity ...84
Figure 3-1 Schematic diagram of shearography ...86
Figure 3-2 Schematic diagram of digital shearography ...87
Figure 3-3 Correlation of interferometric speckle patterns ...87
Figure 3-4 Diagram for derivation of optical path length change ...89
Figure 3-5 Michelson shearing interferometer as a shearing device ...92
Figure 3-6 Shearography test schematic ...94
Figure 3-7 Shearography setup ...94
Figure 3-8 E2, unwrapped phase shearography result ...95
Figure 3-9 E3, unwrapped phase shearography result ...96
Figure 3-10 E4, unwrapped phase shearography result ...96
Figure 3-11 E2, wrapped phase shearography result ...97
Figure 3-12 E3, wrapped phase shearography result ...97
Figure 3-13 E4, wrapped phase shearography result ...98
Figure 3-14 E2, indication sizing by full-width of half-amplitude ...98
Figure 3-15 E3, indication sizing by full-width of half-amplitude ...99
Figure 3-16 E4, indication sizing by full-width of half-amplitude ...99
Figure 4-1 ANSYS modules used for the shearography simulation ...103
Figure 4-2 Model dimensions and configuration...104
Figure 4-3 ANSYS Composite PrePost environment ...104
Figure 4-4 Mesh configuration ...105
Figure 4-5 Deformation of the simulated model after applying thermal load ...106
Figure 4-6 Cooling curve of the surface ...107
Figure 4-8 Applied mechanical boundary condition ...110
Figure 4-9 Fringe patterns depicting the deflection-derivatives ...111
Figure 4-10 Fringe patterns depicting the deflection-derivatives ...111
Figure 4-11 Fringe patterns depicting the deflection-derivatives ...111
Figure 4-12 Fringe patterns depicting the deflection-derivatives ...111
Figure 4-13 Fringe patterns depicting the deflection-derivatives ...111
LIST OF ABBREVIATIONS
LVID Low-velocity impact damage
HVID high-velocity impact damage
BVID Barely visible impact damage
WWII World War II
IRT Infrared thermography testing
VT Visual testing
UT Ultrasonic testing
RT Radiography testing
LPT Liquid penetrant testing
MPT Magnetic particle testing
ECT Eddy-current testing
MIA Mechanical impedance analysis
SMT Strain monitoring testing
AET Acoustic emission testing
TOF Time-of-Flight
FOD Foreign object damages
FFT Fast Fourier Transform
DFT Discrete Fourier Transform
PT Pulse thermography
ERT Early Recorded Thermogram
LIST OF SYMBOLS
1
Z CFRP acoustic impedance, [kg m s2 ] 2
Z Water acoustic impedance, [kg m s2 ] NF Near field margin, [m ]
2
α Half angle of beam spread
f Frequency, [Hz]
D Transducer crystal diameter, [m ] c Sound velocity in the medium, [m s ]
T Temprature, [°C, K]
mm millimetre
J Joules
,b
Nλ Spectral radiance from a blackbody
λ
Wavelength [m ]Nλ Spectral radiance for real object
α Diffusivity, [m s 2 ] ε Emissivity h Planck’s constant, [ . ]J s K Boltzmann’s constant μ Micro t Time, [s] n
F Discrete Fourier Transform
φ Phase delay, [rad]
Im Imaginary part of Discrete Fourier Transform Re Real part of Discrete Fourier Transform
U Dimensionless temperature
( )
w t Truncation window, [s]
v Displacement vector
w Displacement vector
k Cartesian component
Δ Phase change, [rad]
INTRODUCTION 0.1 Overview
Typical damage scenario in aerospace carbon fibre reinforced polymer (CFRP) components is the low-velocity impact. In most of the cases, due to no visible exterior signs, they are not detectable visually. Among the different non-destructive testing (NDT) approaches available, ultrasonic testing, infrared thermography and shearography testing have been found of practical use to detect and evaluate such internal damages. The former of these methods being in contact while the latter two being non-contact, each of them has its own abilities and weaknesses in flaw detection. On the other hand, applying a reliable NDT method to reveal a specific discontinuity needs a proper assessment of the test performance. In such a case, besides the experimental testing, mathematical simulation is used to evaluate the NDT methods since it can evaluate detecting performance through virtual tests.
0.2 Literature review
Due to the increasing use of composites instead of metallic parts in new commercial aircraft, the need for new inspection techniques has arisen in the aerospace industry. In this section, a review of these NDT methods, which are used to test CFRP components, is presented. The section is followed by a discussion of their abilities and limitations. Finally, an effort is made to review the rules related to numerical simulation in NDT.
0.3 Carbon fibre reinforced polymers
CFRP is a combination of two different materials, reinforcement and matrix. The reinforcement is long, thin and flexible fibres of carbon that provide no strength in any direction other than a tensile toughness. The matrix, made by a polymer, provides the shape, holds the fibres in place, and transfers loads between them.
Use of CFRPs is growing in the field of engineering design. Since it has a high strength to weight ratios, high stiffness, and it is corrosion-resistant, CFRP takes over the market for high-performance structures [1].
The performance of aircraft mainly depends on the weight to strength ratio of their parts. Consequently, new designs tend to replace metallic parts with other materials to improve this ratio. Composites are thus considered to be a practical choice. For instance, modern planes such as the Boeing 787 Dreamliner and Airbus A350 rely on CFRP parts [2].
As with other materials, composite structures need to be inspected. Due to the non-homogenous properties of CFRP, evaluating their integrity is challenging [3]. Failure in CFRPs involves a sequential accumulation of different types of damages, which gradually leads to the loss of the design load capacity [4]. Examples of flaws in CFRP are disbonds, porosity, inclusion, environmental ingress, matrix cracks, fibre breakage and delamination. In some cases, the imperfection or damage constitutes a combination of the mention flaws. For instance, an impact damages can be a combination of matrix cracks, fibre breakage and multiple delaminations [5].
0.4 Impact damage
Impact damage is categorized into low-velocity impact damage (LVID) and high-velocity impact damage (HVID). The low-velocity impact is caused by quasi-static force, the higher limit of impactor velocity ranging from one to a few tens of ms−1 depending on the material's
and impactor's properties. In HVID, boundary condition effects are negligible because the impact event is over before the stress waves have reached the edge of the structure. HVID is characterized by impactor penetration and induced fibre breakage, while LVID results in delamination and matrix cracking. Matrix cracks typically occur near the impact location. The cracks do not affect the laminate strength significantly, although they are usually the first failure mode to occur in delamination, Fig. 1-1 [6], [7].
Figure 0-1 Typical impact damage mode for CFRP laminate [7]
The delamination pattern is dependent on the structure of the fabric. Typically, multiple butterfly-shaped delaminations are observed in the impacted area. They are extended through the axis parallel to the fibre direction. The delaminations are expanded in size, with an increase of the impact load. They rotate from the depressed surface to the bottom layer [7], [8]. LVID on aircraft is due to either operational or maintenance events. In service, hailstone strikes, birds and runway debris are the primary causes of LVID. In maintenance operation, LVID is due to accidental tool drops. Such blunt impactors could cause little permanent indentations and barely visible impact damage (BVID), which may end-up contributing to large delaminations [9]. Boeing damage definition classifies BVID as small damage, which may not be found during heavy maintenance general visual inspections, using typical lighting conditions, from a distance of five feet. Damage dent depth is typically 0.01 to 0.02 inches [10]. This type of damage can have a significant effect on the strength and durability of the structure.Therefore it is a primary concern for the design and the maintenance of composite structures. A wide range of characterization techniques, both destructive and non-destructive, can be employed to improve our understanding of the damage mechanisms occurring in CFRP panels. However, destructive tests have a significant limitation, which is the partial or total loss of the test part [11].
0.5 Non-destructive inspection
The terms of nondestructive evaluation (NDE) or nondestructive testing are defined for a vast range of analysis techniques performed on structures or materials to determine the existence or absence of discontinuities without damaging the object [5]. Although NDT is not able to guarantee that failures will not occur, it has a significant role in reducing the potential of failure in structures. Other factors, such as weakness in design and improper application of the object, may contribute to failure even if NDT is appropriately applied. In other words, NDT is an extension of the human senses with the use of electronic and mechanical instrumentation. According to historical evidence, the use of NDT dates back to Roman times. They detected cracks in marble slabs by using flour and oil. The other early recorded application of NDT was in 1868 when S.H. Saxby applied a compass to find cracks in gun barrels. Many kinds of primary NDT methods were developed during World War II (WWII). In that time, NDT began to be recognized as an independent technology, through the establishment in 1941 of The American Industrial Radium and X-Ray Society which is known today as ASNT. Before WWII, design engineers were relying on unusually high safety factors. As a result of the war, the relationship of discontinuities to the lifetime of structures became a concern. Besides, there were a significant number of catastrophic failures linked to product inadequacies [12]. The evolution of non-destructive testing can be directly connected to increased concern for safety, the reduction of safety factors, the development of new materials, and the overall quest for more product reliability [13]. Nowadays, nondestructive testing is used effectively for the analysis of raw materials before processing, to control a manufacturing process, to evaluate final products, and to monitor structures in service.
Aerospace industry and NDT
Inspection criteria for aerospace structure tend to be one of the most critical among industries. The restriction on the weight, to create effective and economic structures, limits the safety margin in the design parameters. High safety margin of about four or higher is considered for critical components in other industries while, for aerospace applications, this factor typically
ranges from 1.15 to 1.5. Therefore, nondestructive testing in aerospace industries concerns even smaller discontinuities size that will not grow to critical size during the operational cycle [12]. As mentioned before, aerospace structures are a compromise between low weight and high safety. Therefore, the use of CFRP is appropriate in terms of weight reduction and fuel economy. On the other hand, the manufacturing process and the monitoring of these structures in service constitute a novel challenge for NDT. The selected inspection methods should, therefore, be very sensitive while being reliable.
0.6 NDT on CFRP structures
The six primary NDT techniques developed for the steel industry are visual testing (VT), ultrasonics (UT), X-ray radiography (RT), liquid penetrant testing (LPT), magnetic particle testing (MPT) and eddy-current testing (ECT). VT, UT and, to a lesser degree, RT and ECT could be applied to the inspection of CFRP structures. In addition, numerous alternative techniques such as mechanical impedance testing (MIA), strain monitoring testing (SMT), Acoustic emission testing (AET), infrared thermography (IRT) and shearography (ST) are used in the composite NDT field [14]-[16].
NDT methods are generally classified into two groups, point-by-point and full-field methods (Table 0-1). Both of them have their specific applications in testing and evaluating the CFRP laminates. In most of the case, point-by-point NDT techniques require a contact medium, between the sensor and the test part, to obtain a reliable analysis. In terms of full-field methods, due to the elimination of physical contact, between the sensor and tested structure, they tend to speed up the data collection process.
Table 0-1 Point-by-point and Full-field NDT approaches Point-by-point methods Full-filed methods
Ultrasonic testing Radiography testing Mechanical impedance analysis Thermography
Electromagnetic testing Laser interferometry
0.7 Point-by-point NDT methods
As a point-by-point NDT method, MIA measures the mechanical impedance of a point on the surface of a structure by applying a harmonic force to it at a single frequency (1 to 10 kHz). In fact, the stiffness of the part under test affects the mechanical loading of the probe that sits on it; going from good to flawed areas changes the phase and the amplitude of the mechanical vibration induced by the probe. Because they significantly reduce local stiffness of a part, debonds in adhesive joints as well as delamination and voids in laminated structures affect the dynamic properties of a part and are thus good candidates for MIA inspection. The sensitivity of the method changes with frequency, so selecting appropriate driving frequency is critical to obtain the greatest difference between good and bad parts [14].
In AET, sound wave pulses are triggered by an external loading which is often provided by regular operating conditions of the monitored structure. These acoustic pulses are caused by a sudden release of the energy stored in discontinuities that are growing under the applied stress [16]. In a typical test, a piezoelectric transducer is mounted on the surface of the test part. It converts the elastic wave into electrical signals that are amplified and digitized for further numerical processing. In most of the cases, data extracted from AET signals are more difficult to interpret than signals extracted from other NDT methods [12], [17].
ECT is based on electromagnetic induction. A coil is driven by an alternating current so as to produce magnetic flux. Eddy currents are induced in an electrically conductive part exposed to this flux. Variation of eddy current intensity results in changes in the electrical impedance of the test probe. This method is broadly used for detecting cracks and corrosion in metals. Although electrical conductivity is lower in CFRP as compared to metallic parts, ECT has the potential to inspect them. However, it is challenging to apply conventional ECT methods to CFRP because of low conductivity and the anisotropic properties of the CFRPs [18].
UT is the most frequently used NDT method to detect internal flaws in CFRP laminates. An ultrasonic system consists of a transmitter and a receiver circuit, a transducer tool, and a display device. Based on the information carried by the signal, location, size and orientation of the flaws are characterized [19]. Pulse-echo is a conventional ultrasonic testing mode also named
as a reflection method. It is based on an ultrasonic energy beam reflected from the medium interfaces. When ultrasonic waves encounter a defect, the reflected energy can be distinguished from a back wall echo of the sound area. For damage detection on a CFRP laminate, the pulse-echo technique has limitations on distinguishing the layer-by-layer information signals. As a result, Time-of-Flight (TOF) scan has been developed to allow delamination or cracking to be identified and localized with better accuracy. UT has an excellent ability in sizing and revealing the location of flaws such as matrix crack and delamination in CFRP, although UT is time-consuming and requires a contact medium [20]-[21].
0.8 Full-field NDT methods
In today’s competitive aerospace industries, high-speed inspection technology is needed. Full-field NDT methods are providing a faster inspecting speed for new aircraft both during the manufacturing process and in the field. For instance, a point-by-point inspection method, such as UT C-scan, have a slow-pace inspection of about 10 sq. ft ./hour. On the other hand, for a full-field method such as shearography and thermography, an inspection rate of 25 to 1200 sq. ft per hour is achievable. Therefore, a fast, full-field and real-time technique is essential to ensure quality and reliability at the lowest possible cost and time [22].
Among available full-field NDE methods, VT is, at the same time, the simplest and the fastest one. However, VT has an inherent disadvantage in the characterization of interior damages. In some cases, the internal failure mechanism absorbs impact energy without showing any external sign of the flaw. Although the visual inspection is a routinely performed task as part of an aerospace maintenance schedule, its definition varies notably from one source to another. In general, we can say that it is an evaluation method based on human sensory systems aided only by mechanical tools such as magnifiers and borescopes [6], [23].
RT is a widely-used NDT damage analysis method. An X-ray source transmits a beam of photons through the specimen and a sensitive film or sensor is used to image the intensity of the transmitted X-rays. The darker regions on the film received more X-ray photons than the brighter areas. The absorption of X-rays varies with the thickness and the density of the test material. Any defect that changes at least one of these two parameters will thus create a contrast
in the radiographic image. Radiography shows excellent performance in detecting voids and inclusions. However, this technique is susceptible to the angle of the incident beam with respect to the defect orientation. Therefore, delamination is not detectable as the incident X-ray beam is perpendicular to the plane defect [24].
Thermography and shearography are both full-field and real-time methods to evaluate the nature and the severity of defects such as delamination in laminar composites [15], [25]–[29]. Since delamination is the primary feature of impact damages, high performance and reliability are expected from these methods to assess this type of damage.
0.8 Infrared thermography
IRT (infrared thermography) is reported as an applicable method to evaluate the nature and the extent of defect in CFRPs [30]–[32]. It is conducted in aerospace industries mostly to detect delamination and moisture ingress in composites wherein the variation in thermal diffusivity between CFRP and the flaws produces excellent NDT indications. IRT techniques are based on thermal contrast, which is recorded from the surface of the test material. On top of a defect, parts' surface temperature will be different in comparison to the sound area. In this method, a thermal excitation source heats the specimen while the surface temperature of the test part is monitored by an infrared camera. The heating process can vary in terms of application area (surface, line or point) or the type of modulation (step, pulse or periodic forms). The thermal response is captured for a determined period, deeper defects requiring a longer observation period. In fact, temperature variation is a function of the discontinuity depth and the thermal proprieties of the defect and the test part [33].
IRT techniques can be classified by the arrangement of the specimen, infrared camera, and thermal stimulation source. Practically, in most of the cases, the advantages of thermographic non-destructive testing are demonstrated in a one-side procedure, which is called the reflection mode. In this case, both camera and heating sources are located on the same side of the specimen. On the other hand, a two-sided, or transmission test, requires that the heat flow crosses the thickness of the part and, therefore, can not be applied to thick or thermally-insulating materials [34].
IRT indications can be degraded by many factors such as noise, external heating, and cooling sources and uneven characteristics of the object’s surface. Therefore, raw infrared images are many times not appropriate. In these situations, the solution is to apply post-processing methods such as normalized temperature contrast [35], Fourier transforms [36], cold image subtraction (CIS) and median filtering [37].
0.9 Shearography
Optical interferometric non-destructive testing methods such as holography, electronic speckle pattern interferometry (ESPI) and shearography are based on laser speckle images. They are used to indicate, size, and evaluate surface and internal anomalies in a structure when appropriate stress is applied. Even though the laser beam does not penetrate the test material, these methods can evaluate interior defects. They are applied to aerospace structures to detect discontinuities such as delaminations, inclusions, porosities and cracks. Among the different interferometric methods mentioned above, shearography is the one that best suits industrial requirements because of its immunity to vibrations and its less stringent requirement on laser performance.
Shearography is a full field and real-time method to evaluate the nature and the severity of a defect in laminar composites. Shearography makes it possible to visualize the spatial derivative of surface displacement i.e. its local strain. The basic principle of speckle interferometry involves the comparison of speckle patterns before and after the loading of the test part. In this work, thermal stress is used to load the test part and to produce shearograms [38]. Processing of these speckle patterns leads to a fringe pattern which could be converted to a phase map using a phase unwrapping algorithm. Based on the laser wavelength, this phase map could be further converted to the spatial derivative of surface displacements [39]. Discontinuities in laminated composites are depicted as anomalies of the strain on the surface of the inspected part. As a matter of fact, under loading conditions, structural defects in CFRP cause strain concentration.
0.10 NDT simulation
With the help of computer-aided engineering, a test procedure can be simulated with mathematical algorithms. Simulation in the NDT field has become increasingly diverse over the years. NDT simulation is used in a wide range of different applications such as performance demonstration of existing methods, Probability of Detection (POD) studies, the study of the inspectability of components and design, and optimization of methods [40]. Virtual testings lead to a better understanding of the test’s physics. Also, predicting and explanation of test results for different situations by validation data are the key points when using NDT simulation [41]. Many NDT commercial simulation softwares are available for different NDT techniques but not for all of them, such as thermography and shearography. Physical complexity and novelty of the tests and their techniques could be the reasons for this. However, several works have been done to develop test models in these areas [39]–[45]. Among the various numerical methods used to solve mathematical models, finite elements are often preferred to analytical solutions for complex models. Following the validation of such a finite element model (FEM) through proper experiments, engineers use this virtual approach to increase the understanding of the test phenomena and to optimize the testing parameters for a specific part.
0.11 Objective
In this study, a combination of NDT methods is performed experimentally to evaluate the low-velocity impact damage in CFRP coupons. Infrared thermography and shearography testing are conducted to evaluate the detectability and the sizing capability of the methods for different levels of impact damage in the CFRP panels. The indications are discussed, and sizing capabilities are compared with ultrasonic testing results.
Moreover, the detection principles of these methods are investigated through FEM whose solutions replicate experimental tests.
0.12 Thesis plan
Using a drop-weight impact system according to ASTM D7136/D7136M-15 standard, impacted CFRP panels at energy levels of 10J, 15J and 25J, are used as the test parts for the current work. Firstly, the ultrasonic time of flight C-scan is conducted to quantify the configuration of the impact damage on the CFRP components. This inspection is performed in immersion using a Zetec Topaz device, a 64-element 5 MHz probe, and two encoders. This technique reveals the size and the depth of the delamination in the impacted area and is considered as the reference data to compare the other inspection technics with. Infrared thermography techniques, including pulse and step heating, are applied to study the thermal signals of the defective and the sound areas. In this study, the 640 × 512 detectors of a cooled Telops infrared camera is used to record thermograms, while two 3 and 6.4 kJ flash lamp are used to stimulate the coupons. IR-View and Matlab softwares are then employed to process experimental data. Heating stimulation is also applied to the component so as to be able to get a thermo-mechanical response that could be analyzed by shearography. To do so, a DANTEC Q-800 portable system with eight 120mW lasers at a wavelength of 660 nm is used. The signals are analyzed by the ISTRA 4D X86 software. Afterward, the NDE results are compared to each other to investigate their capabilities and limitations. Finite element models are finally designed to simulate infrared thermography and shearography inspection process. The anisotropic thermal and mechanical properties of CFRP components are modelled in ANSYS Workbench. ANSYS ACP module is used to simulate the configuration of the CFRP layup and the component’s geometry. Defects are considered as delamination in different layers. Finally, It leads to a study of the inspectability, different test parameters and data processing through the virtual testing.
0.13 Sequence of thesis
• Section 1: Literature review on non-destructive testing, NDT on CFRP including contact and non-contact methods, developments in infrared thermography, shearography and FEM simulation of these NDT methods, thesis objectives and plan.
• Section 2: Discussion about impact damage, test coupon specifications, and a report on the inspection of the coupons by ultrasonic testing.
• Section 3: Thermography testing, the basic concept and theory, pulse thermography, experimental setup and data acquisition, infrared thermography post-processing methods and experimental results.
• Section 4: Shearography testing, principles and basic concept, experimental setup, data acquisition and experimental results.
• Section 5: Thermography and shearography simulation; boundary conditions, geometry, meshing and simulation results.
CHAPTER 1 TEST SPECIMEN
1.1 Overview
This chapter starts with an introduction that explains the application of CFRPcomponents in new airliners. It is followed by elaborating on impact damage, specifically BVID. As mentioned before, the ultrasonic test is conducted to evaluate impact damage in the CFRP panels. Therefore, in this chapter, the specification of the inspected specimens is described. Then, the ultrasonic testing background and the implemented test procedure are presented. Finally, the test results are obtained which reveal the size and configuration of the damaged area.
1.2 Introduction
CFRP components are rapidly replacing aluminum parts in modern commercial aircraft (Fig. 1-1). These composite components are durable, stiff, and more corrosion resistant as compared to the metallic parts. By using these composite parts, aircraft and their engines can be designed lighter and, as a result, fuel consumption can be reduced.
CFRP 53% Al/Al-Li 19% Steel 6% Titanium 14% Other 8%
Figure 1-1 Material usage in Airbus A350 XWB [87]
However, implementing these composite materials to the structural design of an aircraft is a complex problem. One of the complexities is that CFRP laminate failure modes are much harder to predict as compared to the metallic parts. Besides, anisotropic properties and complicated morphologies of the components is a challenge for NDT inspections [20].
1.3 Impact damage
In new aircrafts, as long as metallic parts of the fuselage, wings, and control surfaces are replaced with composite laminate [46], more CFRP components are exposed to in service and maintenance impact damages. Fig. 1-2 is demonstrating typical impact damage scenarios corresponding to different aircraft parts such as hail strick, bird strick, tool drop, ground equipment impact and foreign object damages (FOD).
This type of impact creates an indentation on metallic parts. However, in impacted CFRP laminates, although impact can create severe interlaminar damage, surface layers tend to revert to their original shape without any visible indication of damages. This behaviour makes the visual inspection of laminates harder. Table 1-1 is showing typical impact damage scenarios and their severity in an aircraft’s wing [6].
Table 1-1 Typical impact threats for aircraft wing structures
Area of Aircraft Impact Risk Energy J
Up pe r wi ng s ki n
Near fuselage (inboard)
Falling Tools 4 Aircraft lifting equipment 20
Refuelling by gravity 20 Lower wi ng s ki
n Outboard Falling Tools 4
Outboard & inboard Hail Impacts 30-35 Outboard Loading of pylons 16
Inboard Runway debris 12-22
1.4 Barely visible impact damage (BVID)
Damage detectability can be categorized into four groups: Undetectable, Detectable, Readily detectable and Immediately obvious. Figure 1-3 depicts a typical relationship between damage size and the residual strength of the component. It also shows the damage detectability categories together with the design load.
Figure 1-3 Damage category [23]
BVID falls in between undetectable and detectable regions. BVID is a crucial concept in the design of composite aircraft structures. The BVID size as an acceptable flaw in the inspection
procedures is determined using the design ultimate load (DUL) or the maximum expected in-service load. The design criteria are that BVID should demonstrate no-growth up to DUL. Fundamentally, impact damage reduces the compressive load performance of a laminate, although, for damages below the undetectable threshold, the structures are designed to be able to sustain the ultimate design load. Based on a safe life design, the damaged structure can be in-service until the part is replaced due to defined usage or time limits [47].
1.5 Test specimen
DPHM 501 [48] is a university-industry collaborative research project under the CRIAQ consortium. In this project, an extensive list of aerospace structures was identified by industrial partners, including military and civil aircraft manufacturers. Besides, based on maintenance, in-service manuals, and damage tolerance analysis reports, a list of in-service damages was provided. According to collected data, academic partners proposed relevant structures with artificial defects for experimental and numerical parametric studies. In this thesis, the test components are selected from the DPHM 501 parts. The coupons include three 30 cm × 30 cm CFRP panels which are composed of 16 plies, unidirectional prepreg tapes (Cycom 5276) with a quasi-isotropic layup 45/0/ 45/90 , Fig. 1-4. The thickness of each lamina is 0.15 mm.
Therefore, the total thickness of the samples is 2.4 mm. All the coupons are laid up, vacuum bagged and cured in an autoclave.
The coupons are impacted at the center using a drop-weight impact system adhering to ASTM D7136/D7136M-15 standard [49] with energy levels of 10J, 20J and 25J. As mentioned in the standard, the weight of the impactor is 5.5 ± 0.25 kg and has a 16 mm diameter hemispherical striker tip. The hardness of the impactor ranges from 60 to 62 HRC. A summary of the four samples is given in Table 1-2.
Table 1-2 Coupons list
1.6 Ultrasonic testing
In this work, ultrasonic testing is performed to locate and size impact damages on the laminates. C-scan and B-scan [20] reveal the size and depth of the defects. Before discussing the test procedure, a brief background of ultrasonic testing is presented in the subsequent section.
1.6.1 UT background
Ultrasonic testing is based on 0.1-15 MHz sound waves travelling in a test specimen. In most of the cases, very short ultrasonic pulses are transmitted into the test part, and the reflection of the sound beam from acoustic impedance discontinuities is analyzed to detect and map defects. In the following section, a few concepts of the test will be discussed.
Coupons Impact Energy
SC1.1-E2 --
SC1.1-E2 10J
SC1.1-E3 20J
1.6.2 Sound reflection
In ultrasonic testing, an interface is defined as a boundary between two different media. At the interface, part of a sound beam is transmitted to the second medium, while the remaining part is reflected back into the first one. The value of the reflected and the transmitted proportion depends upon the mismatch of the acoustic impedance at the interface (Eq. 1-1). In the case of aCFRP to water interface, 27.5% of the energy is reflected, and 72.5% is transmitted into the water. However, the situation changes for CFRP to air interface, where almost all the energy reflects, and none goes into the air.
1
Z = CFRP acoustic impedance = 4.75 kg m s2 2
Z = Water acoustic impedance= 1.48 kg m s2
2 1 2 1 2 100% Z Z Reflelected energy Z Z − = × + 2 4.75 1.48 100% 27.5% 4.75 1.48 − = × = + (1-1)
If the interface consists of CFRP to air, the reflected energy would be as follows: 1
Z = CFRP acoustic impedance = 4.75 kg m s2 2
Z = air acoustic impedance= 0.0004 kg m s2
Reflected energy
2 4.75 0.0004 100% 99.8% 4.75 0.0004 − = + × =This property of sound waves allows the detection of discontinuities in ultrasonic testing. In a conventional UT, a couplant such as oil or gel is used between test items and transducer. Thereby making the transmission of the ultrasonic waves more efficient. By immersion technique, the tested part and transducer are submerged in a water tank. In this case, while a consistent distance between probe and component is maintained, more efficient sound-travel from the transducer to the specimen is realized [50].
1.6.3 Beam characteristics
In ultrasonic testing, a transducer converts a pulse of electrical energy into mechanical energy. The mechanical energy in the form of sound waves travels through the test part. The sound beam can be divided into two distinct zones called near-field and far-field. Near the ultrasonic transducer (near field) there are significant fluctuations in the sound intensity. The fluctuations are due to the constructive and destructive interference of the multiple wave patterns irradiated from the transducer surface, Fig 1-5. Because of the intensity variations, it is difficult to inspect materials in this area. The near field margin, NF, can be calculated from Eq. 1-2.
2 4 D f NF c × = × (1-2) D = Transducer diameter
f
= Transducer frequencyc
= Sound velocityIn the case of the immersion technique, it is suggested that the test specimen be placed at a distance beyond the transducer’s nearfield so that, uniform wavefronts are transmitted into the specimen.
In the near field, the beam is roughly cylindrical and is of the same diameter as the transducer crystal. Beyond the near field i.e. in the far-field, the beam spreads out like a cone (Fig 1-6) [49]. The angle of the cone (-6 dB half-beam spread angle) can be calculated from Eq. 1-2.
0.514 sin 2 c D f α = × × (1-3) Where; 2
α = Half angle of beam spread
f
= FrequencyD = Transducer crystal diameter
c = Sound velocity in the medium
1.6.4 Phased-array probe
A phased array probe is made up of multiple transducer elements. They work together as a large single element transducer. Each element has its own pulse and receiver circuit, and an ultrasonic system control all of them independently. The system activates each element by appropriate timing or phasing to achieve scanning function such as electronic scanning as shown in Fig. 1-7. The electronic scanning is performed by moving a beam in the inspecting area, which in turn activates different apertures. It also allows a mechanical scanning axis to be replaced electronically [51].
1.6.5 Gate
Gates are devices that are used at time base locations. They are applied to monitor the signal’s horizontal position and amplitude percentage within a time window. Depending upon the signal’s location, the electronic gates are moved. Modern UT flaw detectors utilize the gated signal to calculate and display flaw depth and also produce C-scan images [51].
1.6.6 Displays
There are different ways that ultrasonic testing data can be displayed.
• A-scan: It is the most basic presentation of ultrasonic data. In this display, echo’s amplitude and transit time are plotted by a vertical and horizontal axis, respectively.
• scan: This type of scan presents a cross-sectional view of the inspected part. In the B-scan, the vertical axis displays time-of-flight, the travel time of the sound beam, and the horizontal axis presents the probe’s position. Therefore, a B-scan is capable of determining the depth and the extent of the reflectors.
• C-scan: It is a plan view of the test piece parallel to the scanning surface. By using conventional probes, a C-scan is obtained, while a probe is moved back and forth and indexed to scan the entire test piece. In a phased array system, the probe is moved physically along the scan-axis while the beam electronically scans along the index axis. The data is displayed as a top view of the test piece, similar to an x-ray image. The colours represent the gated signal amplitude or the time of flight at each point in the test piece mapped to its x-y position [52].
1.6.7 Ultrasonic test procedure
In this section, the ultrasonic test procedure is presented. The tests are done, keeping in mind the tool and bag side of the CFRP coupons.
1.6.8 Ultrasonic setup
The Ultrasonic setup used in the current work is defined by the specifications which are provided in Tables 1-3 to 1-6. The ultrasonic phased-array testing is conducted by immersion technique. Fig. 1-8 demonstrates the flaw detector setup and its components.
Table 1-3 Equipment specification
UT System Topaz 32/128 PR (ZETEC)
Table 1-4 Phased array probe parameters
Frequency 5 MHz
Number of elements 64
Pitch (primary axis) 0.6 mm
Element width (secondary axis) 10 mm Total active aperture length 38.3 mm
Water column 110 mm
Table 1-5 General parameters
Voltage 75 V
Pulse duration 50 ns
Rectification bipolar (Full Wave Rectification)
Filter None
General gain 0 dB
Table 1-6 Phased array parameters
Electronic scanning Linear 0°
Aperture 16 elements
(a) (b)
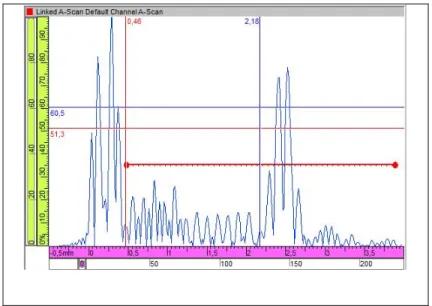
In the test method, the coupon and the transducer are submerged in a water tank. The water acts as the coupling medium. An encoder is used for locating the probe position in the scan and index axes, as shown in Fig. 1-8. A normal scan is performed on both sides of the samples. Fig. 1-9 shows a typical A-scan acquired on a test coupon. The gate is set from immediately after thefront surface echo until past the back wall echo so that TOF or thickness C-scan view is produced.
Figure 1-9 TOF technique’s gate setup Figure 1-8 Ultrasonic immersion tank setup
x
1.6.9 Ultrasonic testing results
The ultrasonic testing is performed from the tool and bag (impact) sides. The C-scan time-of-flight results show how the delamination is extended in different layers, Fig. 1-10, Fig 1-12 and Fig. 1-14 (a and b). The damage sizes for the three coupons are mentioned in Table 1-7. The B-scan views through Y axis (Scan axis) are shown in Fig. 1-11, Fig. 1-13 and Fig. 15 (a and b). They demonstrate the damages are local, such that no fibres are broken around the impacted zone. A double-helix pattern is also observed in which conical delamination is formed through the thickness [21], [53].
Table 1-7 Flaw sizing by time-of-flight ultrasonic testing Coupon Impact( )J Indication area2
(mm Tool side ) Indication area 2 (mm Bag side ) SC 1.1-E2 10 479.3 455.6 SC 1.1-E3 20 594.9 539.8 SC 1.1-E4 25 554.4 550.8
(a)
(b)
Figure 1-10 E2, C-scan of the defect from the (a) tool and (b) bag side
(a)
(b)
Figure 1-11 E2, B scan of the defect from (a) the tool and (b) bag side
(a)
(b)
Figure 1-12 E3, C-scan of the defect from the (a) tool and (b) bag side
(a)
(b)
Figure 1-13 E3, B scan of the defect from (a) the tool and (b) bag side
(a)
(b)
Figure 1-14 E4, C-scan of the defect from the (a) tool and (b) bag side
(a)
(b)
Figure 1-15 E4, B scan of the defect from (a) the tool and (b) bag side
CHAPTER 2
INFRARED THERMOGRAPHY TESTING
2.1 Overview
In this chapter, active infrared thermography techniques, are examined in reflection and transmission modes to evaluate low-velocity impact damage in CFRP. In a reflection mode, thermograms are recorded after stimulating the sample’s surface with a heat pulse. In the thermograms, the contrast of defect/no-defect could be increased by Fast Fourier Transform (FFT) processing. Finally, transmission pulse thermography is performed to measure the variation of diffusivity due to the levels of impact damage.
2.2 Introduction
Active Infrared thermography (IRT), as an NDT method, is based on thermal contrast which is recorded from the surface of the test specimen after thermal stimulating. The contrast appears due to the thermal properties differences between the subsurface defect and the sound material. This field of NDT is expanding from civil or electronic components to an inspection of artworks or composite materials [54]. IRT of aerospace components has been used for several years. The main advantages of thermography over conventional NDT techniques are its full-field results, fast inspection rate, and the absence of safety concerns.
Most of the common damage scenarios occurring in aerospace components, including delamination, debond, water ingress, core crushing, and impact damage, can be detected and quantified by using active thermographic techniques [55]. In this section, some fundamental aspects of active IRT are discussed.
2.2.1 Infrared Radiation (IR)
Electromagnetic spectrum can be classified according to the wavelength of the radiation in a vacuum. Frequency bands like gamma rays, x-rays, ultraviolet, visible light, infrared,
microwaves, radar rays, radio waves, and broadcast bands are parts of this spectrum, Fig. 2-1. The electromagnetic spectrum band in the range of 0.74 μm to 1000 μm corresponds to infrared radiation, which lies in between the visible and the microwave spectra. Infrared radiation wavelengths are longer than visible light and can be recognized as heat. Objects with a temperature above zero kelvin emit infrared radiation. IR radiation is a function of the object’s temperature. Therefore, measuring emitted infrared radiation of an object can be used to quantify the body temperature.
Basically, the relation between temperature and emitted infrared radiation is defined by the concept of blackbody [56].
2.2.2 Blackbody radiation
The radiometry in IR thermography is based on the blackbody concept and the Planck’s law [34]. A blackbody is an ideal physical body that absorbs all incident radiation(s) regardless of direction and wavelength. Besides, it is a perfect radiator. As depicted in Fig. 2-2, the emitted radiation is a function of the wavelength and temperature but independent of the direction [56]. Planck’s law describes the spectral radiance, Nλ,b, from a blackbody in thermal equilibrium as: 2 , 5 2 ( , ) (exp 1) b hc N T hc KT λ λ λ λ = − (Wm sr−2 −1μm−1) (2-1)
Where
λ
is the wavelength[ ]
μ
m
, T is the temperature[
K Kelvin
,
]
of a blackbody,34
6.63 10
h
=
×
−[ ]
Js is the Planck’s constant and Boltzman’s constant isK
=
1.381 10
×
−23[
J K
/
]
. However, real objects have limited absorbance, and only a part of the energy will be radiated from their surface. This portion of the blackbody spectral radiance is given by a surface property called emissivity ε . Eq. (2-2) estimates the spectral radiance for real object:
,
( , ) b( , )
Nλ λ T =εNλ λ T (2-2)
Emissivity, ε, depends on wavelength, temperature, viewing angle and surface condition [34]. Due to the link between wavelength and temperature, the most effective radiometry is carried out for the wavelength at which the emission is the most intense. The pick of a blackbody spectral radiance, in the moderate temperature, is in the range of infrared radiation, Fig. 2-2 [57]-[58].
In general, the IR spectral bands can be divided into four bands: • Near-infrared radiation band (NIR, from 0.75 to 1 μm)
• Short-wave Infrared radiation band (SWIR, from 1 to 2.5 μm) • Mid-wavelength infrared Radiation band (MWIR, from 3 to 5 μm)
• Long-wavelength infrared Radiation band (LWIR, from 7 to 14 μm)
Two of these various bands, MWIR and LWIR, represent the practical bands in infrared thermography. Fig. 2-1 is showing, where IR is absorbed by different air particles, due to lower absorption in these two ranges, more radiation is allowed to reach the sensor of the camera. Therefore, it leads to a better assessment of the object’s temperature by its IR radiation [56].
2.2.3 IR sensors
Infrared detectors are classified into thermal types and quantum types. Thermal detectors (uncooled sensors) use the infrared energy as heat, and their photosensitivity is less dependent on wavelength than quantum detectors. The thermal detectors do not require cooling, although they have a slow response time. In contrast, quantum detectors (cooled sensors) have higher detection performance and faster response speed, although their photosensitivity is dependent on wavelength. In general, quantum detectors must be cooled for accurate measurement [59].
Figure 2-2 Planck's law curves for ideal blackbody radiation at moderate temperature (a), and higher temperature sources radiate much more intensely and peak spectral response is
The principle involves directly measuring the incident photon. The photonic excitation is measured by a change of electrical conductivity or a generated voltage in the sensors [34].
2.2.4 Infrared Thermography approaches
The term of IRT as an NDT method covers a wide range of applications and many inspection procedures, as explained in the following sections.
Figure 2-3 Variety of IRT scenario [60]
Fig. 2-3 presents a diagram showing the different parameters that need to be selected to design an NDT inspection scenario [60]:
1) Approaches:
• Passive: Test materials or parts are naturally at different (higher or lower) temperatures than their background. The inspection procedure does not intervene in the thermal equilibrium of the system.
• Active: An external source is needed to stimulate a thermal contrast on the object surface. The inspection procedure imposes a transient in the thermal equilibrium of the system, or it stimulates its harmonic response at a specific frequency.
2) Configurations:
• Static: The camera, the object and the source remain fixed during the inspection. • Dynamic: At least one of these three elements is moving during the inspection. 3) Modes:
• Reflection: Energy is transmitted to the test specimen from the same side as the data are recorded.
• Transmission: Energy is delivered to one side of the specimen while data are captured from the opposite side.
• Internal: Heat is generated inside the test part, while data can be collected from either surface.
4) Scanning:
• Point scanning: A single point of the object’s surface is heated at a time. To obtain a full 2D image, the system needs to perform a raster scan (step and index axes) over the object’s surface.
• Line scanning: The heating source is focused on a line on the surface being inspected. To obtain a full 2D image, the system needs to move the line along a single scanning axis. • Surface scanning: An entire area of the inspected object is heated at once. A full 2D image
can be obtained without the need to move the source with respect to the object. 5) Sources:
• Optical: such as photographic flashes and halogen lamps • Mechanical: such as sonic or ultrasonic excitation
• Inductive: such as eddy current induction 6) Waveform
• Modulated: thermal waves modulated at a given frequency • Pulse: a short pulse of a few milliseconds
• Step: constant heat flux suddenly applied to the object surface • Square pulse: a long pulse of several seconds
2.3 Pulse thermography
As mentioned before, infrared thermography can be divided into two primary approaches, passive and active. In the passive approach, test materials are at a different temperature than ambient. Whereas, in the case of the active approach, an external stimulation source is necessary to induce thermal contrasts. Active thermography as a non-destructive testing method (NDT) offers non-contact, full-field, and subsurface detection [28], [54], [55], [61]. Modes of active thermography can be classified by the arrangement of a sample, an infrared camera, and a thermal stimulation source. Practically, in most of the cases, the advantages of thermography non-destructive testing are demonstrated in a one-side procedure, which is called reflection mode.
Pulse thermography is a reflection method in which a thermal pulse stimulates the surface of the test part. While the thermal energy diffuses through the material in a three-dimensional manner, explained by the Fourier diffusion equation [62], the temperature of the cooling surface is recorded at regular time intervals by a thermal camera. The captured thermograms form a 3D matrix of pixels and whose intensity corresponds to the temperature evolution of the pixel during the post-flash time, Fig. 3-4 [63]. For a sound area, the temperature of the surface decays as the square root of time [34].
Figure 2-4 (a) Temperature 3D matrix on the time domain, and (b) temperature profile for a non-defective pixel on coordinates (i,j) [63]
2.3.1 Thermogram sequence
The complete thermogram sequence is composed of five distinctive elements depicted in Fig. 2-5 [63].
• Cold image: At the time t , before the heat reaches the specimen’s surface, a cold image 0 is captured. The cold image can be used to remove spurious reflections due to non-unitary emissivity and to reduce fixed pattern artifacts.
• Saturated thermogram: During the application of a heat pulse, the captured thermogram are saturated in temperature. The acquired data are out of the calibration scale, and no accurate measurement can be conducted from them.
• Early Recorded Thermogram (ERT): Although the usable thermogram sequence starts at the ERT, defects are usually not yet visible at that time. This is because the surface temperature evolution has not affected by the discontinuity yet.
• Thermogram sequence: All subsequent thermogram are of interest for defect inspection. • Last Recorded Thermogram (LRT): As the last thermogram of the thermogram sequence,
temperature variations are considered negligible from this point in time.
2.3.2 Flaw detection
Fig. 2-6 presents a temperature profile, after applying a heat pulse, for a sound area and an artificial defect, a flat-bottom hole at a depth of 1 mm, in a plexiglass plate. In the first instance, the temperature decay curves for both the defective and the sound areas behave in a similar way. Although there is a difference in their temperature due to non-uniform heating at the surface. In this period, the heat energy does not reach the discontinuity yet. Since the material ability to exchange heat with its surroundings, thermal effusively, is much higher for plexiglass than the air, the sound area acts as a better thermal sink. Accordingly, once the thermal gradient has arrived at the bottom hole, the surface temperature will be higher over the defect compared to the sound area. It continues until the stabilization time.
Raw PT data, however, has some uncertainties to analyze. Therefore, a variety of post-processing techniques have been developed to enhance IR signatures [64].
2.4 Pulse Phased Thermography (PPT)
Indication signals can be degraded by many factors such as noise, external heating, cooling sources and uneven characteristics of the object’s surface. Therefore, raw infrared images are not usually appropriate. A solution in these situations is applying a post-processing method such as pulsed phase thermography (PPT) [36].
PPT is based on the phase delay of thermal images. Non-uniform heating and surface emissivity variations have a negligible impact on the phase data. Moreover, phase data is more likely to respond to differences in material thermal properties rather than geometrical features [31]. The experimental procedure to perform a PPT is the same as PT. For the post-processing, once the temperature data has been captured, the entire sequence can be processed, at the pixel level, using the one-dimensional Discrete Fourier Transform (DFT), Eq. (2-2).
2 0 ( ) Re Im N jkn N n n n k F T k eπ j = =
= + (2-2)Where j is an imaginary number, n designates the frequency increment and Re and Im are the real and the imaginary parts of the transform, respectively. For NDT applications, Eq. (2-2) is not practical due to massive computation time. The Fast Fourier Transform (FFT) algorithm is used instead because it reduces the complexity of computing and significantly speeds up the transformation process [63]. With the real and imaginary parts of the transform, phase delayφ , for a pixel becomes available as follows:
(
)
1
tan Im Re
n nφ
=
− (2-3)The procedure is applied for all the pixels on the sequence to form phase maps or phasegrams, as shown in Fig. 2-7 [31].
2.5 Transmission mode
To measure the thermal diffusivity of materials, Parker proposed a technique based on the analysis of recorded thermal image sequences caused by the transmission of heat pulses through the sample [30].
2.5.1 Methodology
In this method, a heat pulse is applied to the front surface of the test part, and the rising temperature is monitored from the test part’s backside. If the heat losses are neglected, the normalized temperature of the back surface is given by
![Figure 0-1 Typical impact damage mode for CFRP laminate [7]](https://thumb-eu.123doks.com/thumbv2/123doknet/7530284.227532/27.918.260.756.158.419/figure-typical-impact-damage-mode-cfrp-laminate.webp)

![Figure 1-5 Visual depiction of near-field and far-field of a transducer [51]](https://thumb-eu.123doks.com/thumbv2/123doknet/7530284.227532/43.918.222.769.759.991/figure-visual-depiction-near-field-far-field-transducer.webp)
![Figure 1-7 Schematic view of electronic scanning of a phased array probe [50]](https://thumb-eu.123doks.com/thumbv2/123doknet/7530284.227532/45.918.204.778.203.413/figure-schematic-view-electronic-scanning-phased-array-probe.webp)

![Figure 2-5 Complete thermogram sequence [62]](https://thumb-eu.123doks.com/thumbv2/123doknet/7530284.227532/64.918.244.661.698.1000/figure-complete-thermogram-sequence.webp)