Predicting weed and lowbush blueberry biomass using the point intercept method
Journal: Canadian Journal of Plant Science Paper Type: Short Communication
Authors: Josée-Anne Lévesque1, Robert L. Bradley2, Mireille Bellemare3, Jean Lafond4, and Maxime C. Paré1*
1 Département des sciences fondamentales, Université du Québec à Chicoutimi, Saguenay, QC, Canada, G7H 2B1
2 Département de Biologie, Université de Sherbrooke, Sherbrooke, QC, Canada, J1K 2R1 3 Club Conseil Bleuet, Dolbeau-Mistassini, QC, Canada, G8L 4W4
4 Agriculture and Agri-Food Canada, Soils and Crops Research and Development Centre, Normandin, QC, Canada, G8M 4K3.
* Corresponding author: [email protected]
Key words
Comptonia peregrina, Danthonia spicata, pin frame, point frame, Vaccinium angustifolium
Abstract
Lowbush blueberry is an important crop in the Saguenay‒Lac-Saint-Jean region of Quebec. Accurate evaluation of agronomic practices currently requires destructive sampling and loss of productive fields. We showed that the point intercept method (PIM) is a rapid and reliable non-destructive alternative for predicting biomass and yield of lowbush blueberry and competing species. Résumé
La production de bleuets sauvages est importante au Québec et particulièrement pour la région du Saguenay‒Lac-Saint-Jean. Correctement évaluer les impacts des pratiques agricoles sur la croissance des bleuetiers demande souvent l’utilisation d’un échantillonnage destructif. Nos résultats
indiquent que la méthode non-destructive avec point d’interception est une technique simple et rapide afin prédire efficacement les rendements en fruits ainsi que les biomasses aériennes du bleuet et des plantes compétitrices.
Introduction
Canada is the world’s leading commercial producer and exporter of wild lowbush blueberry fruits (Vaccinium angustifolium Ait.) and the Saguenay‒Lac-Saint-Jean, Quebec, is the most productive region with about 48 000 tonnes harvested in 2016 (MAPAQ 2016). Fruit yields vary from year to year due to winter and spring frost damage, pests, weeds, and diseases. For these reasons, landowners have resorted to a range of management practices such as erecting windbreaks, light burning and/or mowing of stems in alternate years, as well as applying fertilizers, herbicides and pest control agents. To gauge the effect of these management options for increasing the biomass of the lowbush blueberry relative to its competitors (i.e., weeds), it is necessary to establish sampling plots from which the above-ground biomass can be cultivated and compared at prescribed phenological stages.
Above-ground plant biomass can be estimated either by destructive harvesting or by non-destructive methods. As opposed to non-destructive harvesting, non-non-destructive methods may be performed many times within the same sampling area (e.g., same plot) with minimal disturbance and fewer sampling plots are generally needed. As such, repeatedly sampling the same plots eliminates experimental error due to spatial variations and allows the use of statistical tools that control for serial correlation. What is required, therefore, is a rapid, inexpensive, reliable and non-destructive method for estimating the biomass of various above-ground parts of lowbush blueberry plants and neighbouring weeds.
The point intercept method (PIM) is a well-established, non-destructive technique used in ecological studies to monitor patterns and changes in plant community structure (Clark et al. 2008; Hobbie et al. 1999; Jonasson 1988). Compared to conventional visual quadrat methods, the observer
bias of the PIM is low, which makes it a superior method in vegetation analysis (Bråthen and Hagberg 2004; Goodall 1952). The PIM consists of placing a grid pattern over a sampling quadrat and determining which plant species intercept each of the grid points. The PIM requires destructive sampling of a limited number of quadrats to statistically relate the number of intercepted grid points to the biomass of each of the species. Thereafter, the calibrated regression parameters can be used for repeated and non-destructive biomass estimates for each species.
We tested the efficiency of the PIM in predicting the biomass of lowbush blueberry relative to two common weeds, namely sweet fern (Comptonia peregrina) and poverty oat grass (Danthonia
spicata), in a commercial blueberry field in the Saguenay‒Lac-Saint-Jean region. We hypothesized that
the PIM would substantially reduce sampling time, compared to destructive sampling, and provide reliable estimates of plant biomass that can be used to assess the efficiency of lowbush blueberry management practices.
Materials and Methods
Our study was carried out in a commercial lowbush blueberry field near the town of Saint-Eugène-D’Argentenay (49° 00’ 21’’N; 72° 21’ 30’’W) in the Saguenay‒Lac-Saint-Jean region of Quebec. In total, 72 plots (1 m2) were established to represent different competition ratios from either
Comptonia peregrina or Danthonia spicata. More specifically, 36 plots ranged from 0 to 60% C. peregrina cover (avg. 36%), whereas 36 other plots ranged from 0 to 75% D. spicata cover (avg. 24%).
These two species were chosen as they have contrasting growth forms: C. peregrina is a shrub with several leafy stems growing from the base, whereas D. spicata is a perennial grass consisting of a dense clump of low basal leaves from which few thin flowering culms develop. The remaining plant cover in each plot was mainly composed of lowbush blueberry as no other weed was present.
At the onset of the blueberry fruit harvest period in mid-August 2016 (fruit production year), the species cover in each plot was sampled once using PIM (Goodall 1952; Jonasson 1988). We used a
10-point pin frame device as described by Elzinga et al. (1998). This consisted of an aluminum stand on which we fixed a m-wide aluminum bar having ten holes perforated at 10-cm intervals (Figure 1-A). A straight rod with a pointed tip was inserted vertically downward through each hole and we recorded the number of times the tip touched each plant species before touching the ground. The aluminum bar was then moved 10 cm forward in the plot and the procedure was repeated once again. We continued as such until the entire plot had been surveyed (i.e., 100 grid points per 1 m2 plot). Besides identifying the species, we also noted whether the rod tip touched a stem, a leaf or a berry. Immediately (2 to 5 days) following the pin frame survey, we harvested the entire above-ground biomass of each species in each plot (Figure 1-B). We then sorted the material as either stem, leaf, or fruit, after which the material was dried (55 °C) in an air-draft oven and then weighed.
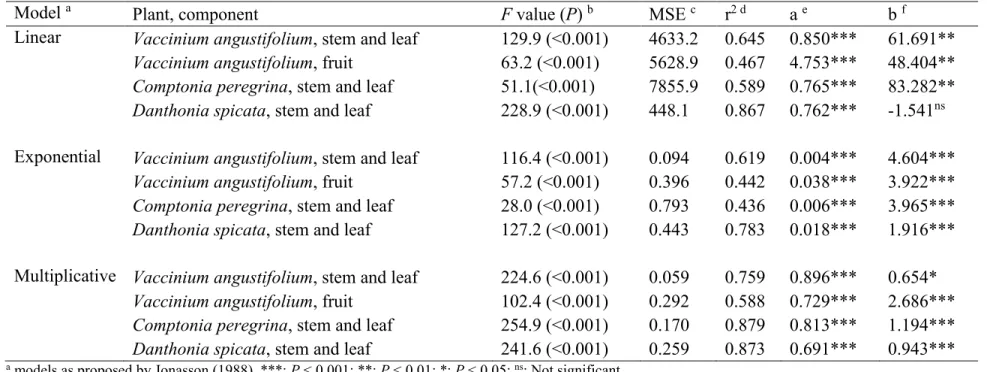
As proposed by Jonasson (1988), we tested the relationships between plant biomass components and the number of grid point intercepts using three models, namely (1) a linear model without any data transformation (i.e., linear model), (2) a linear model after logarithmic transformation of the dependent variable (i.e., exponential model), and (3) a linear model after logarithmic transformation of both the dependent and independent variables (i.e., multiplicative model). All statistical analyses were performed using the linear regression function procedure in SPSS, version 21 for Windows (IBM Corp. 2012). The best model was chosen as the model explaining the highest proportion of variance.
Results and Discussion
All three models predicted the measured plant biomass (Table 1). The multiplicative model performed the best (i.e., higher r2 values) for predicting all biomass components of each plant species, although there are a limited number of points at lower biomass for C. peregrina (Table 1, Figure 2). Nevertheless, a PIM approach using 1-m-wide point frame apparatus is a reliable way for lowbush blueberry farmers and agronomists to evaluate V. angustifolium, C. peregrina, and D. spicata biomass, and, therefore, the impacts of various crop management options over time. More importantly, it took us
less than 30 min to survey each 1 m2 quadrat, whereas destructive sampling took us about 4 h of field work per quadrat plus the time to ship, sort and weigh the plant material. Hence, the method is reliable as well as inexpensive relative to the material and labour costs of destructive sampling for evaluating the blueberry and weed plant component biomass.
To our knowledge, this is the first time that 100 point (per m2) grids have been used to estimate the biomass of small fruits such as blueberries. We did not readily expect this outcome as these fruits tend to be clustered, thus less likely to be intercepted with the vertical pin rod. Even though the regression estimate for blueberry fruits was the lowest of all plant components, the multiplicative model still managed to explain 59% of the total variance in fruit biomass (Table 1). If this was ever deemed to be insufficient, then the pin frame operator has the option to survey the plot a second time (e.g., along a perpendicular axis to the first survey). This would double the number of points within the grid pattern and improve fruit yield estimates (Bråthen and Hagberg 2004), although it would also double the sampling time.
Various current research questions preoccupying lowbush blueberry producers could be addressed using the PIM. For example, the PIM could be a useful non-destructive technique to measure blueberry and weed biomass responses to (1) rotation (2 vs 3 years cycles), (2) mowing (thermal vs mechanical), (3) fungal disease control (fungicide utilization), and (4) fertilizer sources (mineral vs organic). Indeed, to address these sorts of questions, a pin frame apparatus would be the ideal tool for monitoring year to year fluctuations in plant cover within each of the research plots. However, since the results are not replicated across sites and years, the PIM requires further evaluation to be proven robust and reliable across a range of plant species and management conditions.
Acknowledgements
The authors thank the Fonds de recherche axé sur l’agriculture nordique (FRAN-02), the Fonds de recherche du Québec – Nature et technologies (FRQNT), and the Fonds de développement de
l’Université du Québec à Chicoutimi (FUQAC) for their financial support. The authors thank M. Moreau and La Bleuetière Coopérative de Saint-Eugène for providing access to their sites and infrastructures. Thanks also to Club Conseil Bleuet employees, Andréanne Simard, Catherine Tremblay, and Jean Guy Girard for their laboratory and technical assistances.
References
Bråthen, K. A. and Hagberg, O. 2004. More efficient estimation of plant biomass. Journal of Vegetation Science 15: 653-660.
Clark, P. E., Hardegree, S. P., Moffet, C. A. and Pierson, F. B. 2008. Point sampling to stratify biomass variability in sagebrush steppe vegetation. Rangeland Ecology and Management 61: 614-622. Elzinga, C. L., Salzer, D. W., Willoughby, J. W., Management, U. S. B. o. L. and Center, N. A. R. S.
1998. Measuring & Monitoring Plant Populations. U.S. Department of the Interior, Bureau of Land Management, National Applied Resource Sciences Center.
Goodall, D. W. 1952. Some considerations in the use of point quadrats for the analysis of vegetation. Australian Journal of Scientific Research 5: 1-41.
Hobbie, S. E., Shevtsova, A. and Chapin Iii, F. S. 1999. Plant responses to species removal and experimental warming in Alaskan tussock tundra. Oikos 84: 417-434.
IBM Corp. 2012. IBM SPSS Statistics for Windows, Version 21.0. Armonk, NY: IBM Corp.
Jonasson, S. 1988. Evaluation of the point intercept method for the estimation of plant biomass. Oikos 52: 101-106.
MAPAQ. 2016. Monographie de l'industrie du bleuet sauvage au Québec. Ministère de l'Agriculture, des Pêcheries et de l'Alimentation du Québec (MAPAQ). Sous-ministériat aux politiques
Figure captions
Fig. 1. Instrument (pin frame) used for the point intercept method. For each 1-m2 plot, ten transects were placed at 10-cm spacings and were sampled with a pin passed vertically (from the top to the bottom) through the vegetation at 10-cm intervals. The instrument was built from aluminum by a professional machine shop (Machine Pro inc., Saint-Jérôme, Quebec, Canada).
Fig. 2. Relationships between plant dry (55 °C) weights (biomass) and the number of point contacts (intercept). A total of 100 pin positions per 1-m2 quadrat were used on 72 quadrats for Vaccinium
angustifolium and to 36 quadrats for both Comptonia peregrina and Danthonia spicata. A
multiplicative model (linear regression after logarithmic transformation of both the dependent and the independent variables) was used (dotted lines), as this model yielded the highest explained variances (Table 1).
Table 1. Regression data for dry biomass based on the number of pin contacts for a 1-m2 quadrat. Sample sizes (number of quadrats) for Vaccinium angustifolium was 72, and 36 for both Comptonia peregrina and Danthonia spicata.
Model a Plant, component F value (P) b MSE c r2 d a e b f
Linear Vaccinium angustifolium, stem and leaf 129.9 (<0.001) 4633.2 0.645 0.850*** 61.691**
Vaccinium angustifolium, fruit 63.2 (<0.001) 5628.9 0.467 4.753*** 48.404**
Comptonia peregrina, stem and leaf 51.1(<0.001) 7855.9 0.589 0.765*** 83.282**
Danthonia spicata, stem and leaf 228.9 (<0.001) 448.1 0.867 0.762*** -1.541ns
Exponential Vaccinium angustifolium, stem and leaf 116.4 (<0.001) 0.094 0.619 0.004*** 4.604***
Vaccinium angustifolium, fruit 57.2 (<0.001) 0.396 0.442 0.038*** 3.922***
Comptonia peregrina, stem and leaf 28.0 (<0.001) 0.793 0.436 0.006*** 3.965***
Danthonia spicata, stem and leaf 127.2 (<0.001) 0.443 0.783 0.018*** 1.916***
Multiplicative Vaccinium angustifolium, stem and leaf 224.6 (<0.001) 0.059 0.759 0.896*** 0.654*
Vaccinium angustifolium, fruit 102.4 (<0.001) 0.292 0.588 0.729*** 2.686***
Comptonia peregrina, stem and leaf 254.9 (<0.001) 0.170 0.879 0.813*** 1.194***
Danthonia spicata, stem and leaf 241.6 (<0.001) 0.259 0.873 0.691*** 0.943***
a models as proposed by Jonasson (1988). ***: P < 0.001; **: P < 0.01; *: P < 0.05; ns: Not significant b F-ratio of regression mean square to residual mean square
c Means Squared Error d coefficient of determination e slope of the regression line