HAL Id: hal-00848767
https://hal-ensta-paris.archives-ouvertes.fr//hal-00848767
Submitted on 6 Nov 2018
HAL is a multi-disciplinary open access
archive for the deposit and dissemination of
sci-entific research documents, whether they are
pub-lished or not. The documents may come from
teaching and research institutions in France or
abroad, or from public or private research centers.
L’archive ouverte pluridisciplinaire HAL, est
destinée au dépôt et à la diffusion de documents
scientifiques de niveau recherche, publiés ou non,
émanant des établissements d’enseignement et de
recherche français ou étrangers, des laboratoires
publics ou privés.
Study of titanium(IV) speciation in sulphuric acid
solutions by FT-Raman spectrometry
Fabien Baillon, Élise Provost, Walter Fürst
To cite this version:
Fabien Baillon, Élise Provost, Walter Fürst. Study of titanium(IV) speciation in sulphuric acid
so-lutions by FT-Raman spectrometry. Journal of Molecular Liquids, Elsevier, 2008, 143 (1), pp.8-12.
�10.1016/j.molliq.2008.04.010�. �hal-00848767�
Study of titanium(IV) speciation in sulphuric acid solutions by
FT-Raman spectrometry
Fabien Baillon
a, Elise Provost
b, Walter Fürst
b,⁎
aEcole des Mines d'Albi-Carmaux, Campus Jarlard, route du Teillet, 81013 Albi Cedex 09, France
bEcole Nationale des Techniques Avancées, Unité de Chimie et Procédés 32 Bd Victor, 75739 Paris Cedex 15, France
A B S T R A C T Keywords: Titanium Sulphuric acid Speciation Raman spectroscopy
The effects of the addition of titanium(IV) to aqueous solutions of sulphuric acid were studied by FT-Raman spectroscopy. Solutions containing 0 M to 4.01 M of titanium(IV) and 1.98 M to 6.17 M of sulphuric acid were analysed. A new peak, characteristic of titano-sulphate complexes, has been observed, in addition to the peaks characterising ions SO4 2− and HSO4 − . Free HSO4 − and SO4 2−
concentrations have been determined from the Raman peak areas. From mass balance it was deduced that two complexes are present in the solution: [Ti(OH)2SO4]
(aq) and [Ti(OH)2(SO4)2]2−(aq). Their apparent constants of formation have been estimated.
1. Introduction 1.1. Context of the study
Titanium dioxide, because of its optical properties, plays a significant role in the chemical industry, in particular in the form of anatase pigment powders. Precipitation by thermal hydrolysis in sulphuric medium of a titanyl sulphate solution is the usual process for the production of anatase. The anatase form is specifically used in papers, catalysts and cosmetics.
To be able to improve the performances of this process, its simulation implies a realistic modelling of the system, and thus, in the first instance, a knowledge of the species in solution. Although the speciation of aqueous solutions of sulphuric acid has been often studied in the past, in particular using Raman spectroscopy, very few works have focused on the study of titanium(IV) sulphate solutions. Furthermore, in these few studies, the concentrations of sulphuric acid and of titanium were low, compared with the range of concentrations considered in the present work. Hence the aim of our study is to get information about the speciation in H2O–Ti(IV)–
H2SO4solutions over a large range of composition, our laboratory having
conducted several works devoted to the characterisation of “strong acids” solutions using Raman spectroscopy[1–3].
1.2. Speciation of aqueous sulphuric acid
In aqueous solutions, sulphuric acid dissociates in two steps: H2SO4þ H2O ¼ H3Oþþ HSO−4
HSO−4þ H2O ¼ H3Oþþ SO2−4
Various authors studied[4–10], mainly by Raman spectroscopy, the distribution of HSO4−, SO42−and of the molecular H2SO4in aqueous
sulphuric acid solutions from 0 to 100 wt.% in acid, generally at 298.15 K. Spectra indicate that the molecular form appears only at acid concentrations larger than 20 M (M≡mol/L).
The Raman spectrum of an aqueous solution of sulphuric acid in the 400 cm− 1–1600 cm− 1range is given inFig.1. In the traditional approach
[3–5]the spectrum contains several peaks (425 cm− 1, 590 cm− 1and
1200 cm− 1) corresponding to both SO
42−and HSO4−species. The peaks
at 900 cm− 1and 1050 cm− 1are attributed to HSO
4−, the last one at
980 cm− 1being specific to SO
42-. In fact the location of this peak may
vary, in the various papers, from 978 cm− 1to 987 cm− 1, a discussion of
the peak position being made in Rudolph's paper[11], but to simplify we will use 980 cm− 1in the following. Other approaches[6–8]take
into account ion pairs formed by SO42−or HSO4−and H3O+, leading to
specific peaks: at 948 cm− 1(H
3O+SO42−or H3O+HSO4−) and 1024 cm− 1
(H3O+HSO4−). More recently Lund Myhre et al.[9]consider that the
948 cm− 1line is not necessary to describe the spectrum. Moreover,
they conclude that the peaks at 1024 cm− 1and 1050 cm− 1, necessary
to represent the asymmetry of the 1050 cm− 1peak correspond to the
stretching vibrations of HSO4−ions only. In this study, we focus on the
950 cm− 1–1150 cm− 1range, because, in this range each peak is specific
to only one species (HSO4−or SO42−). We will then consider the following
peaks: 980 cm− 1(SO
42−), 1050 cm− 1(HSO4−).
2. Experimental section 2.1. Sample preparation
The sulphuric acid solutions were prepared from concentrated acid of p.a. quality (98%, Aldrich) and distilled water. The titanyl sulphate solutions were prepared by hydrolysis of commercial titanate isopropoxide (from Aldrich, 97%) in concentrated sulphuric acid
⁎ Corresponding author. Tel.: +33 145524417; fax: +33 145528322. E-mail address:walter.furst@ensta.fr(W. Fürst).
solutions, following the protocol described by Raskopf[12], according to the reaction: Ti(OC3H7)4+H2O+H2SO4→ TiOSO4+4C3H7OH
The total concentrations of Ti(IV) and sulphate, respectively denoted cTiapparentand capparentH2SO4 , are adjusted by addition of water and
concentrated (98 wt.%) sulphuric acid. Titanium(IV) in solution within the samples is titrated using a spectrophotometer Shimadzu UV 160 at 400 nm wavelength, after complexation by hydrogen peroxide.
All Raman spectra were obtained at 25 °C and at concentrations ranging between 0 M and 4.01 M for cTiapparentand between 1.98 M and
6.17 M for cH2SO4
apparent.
2.2. Raman experiments
To acquire the Raman spectra of Ti(IV) in sulphuric medium, we used a Bruker IFS 66 FTIR spectrometer equipped with the FRA 106 FT-Raman module. The source is the 1064 nm line of a Nd:YAG laser and the effective maximum power on the sample is 1 W. A DTGS detector, cooled with liquid nitrogen, collects the diffused intensity. The nominal resolution was of 2 cm−1and the spectra resulted from 120 averaged interferograms.
The studied solutions were placed in a 5 mm quartz cell (Hellma 110 QS), closed by a PTFE stopper. This cell was then placed in a brass sample holder. The temperature was controlled by circulating a thermostated liquid through the metallic sample holder.
The spectra were corrected for the instrument response using a tungsten lamp as a blackbody source.
To avoid signal fluctuation among the experiments, we used an external reference. This reference solution is an aqueous NaNO3saturated
solution (CNaNO3=6.65 M). Its spectrum is recorded before and after the
analysis of each studied solution and presents a well-defined peak at 1050 cm−1corresponding to the nitrate ion. Hence, the experimental
values used to get species concentrations are normalized peak areas defined by the ratio of the area Aαiof peak α characteristic of a species i
over the average area Areferenceof the reference peak of the reference
solution. The concentration ciof the species i is then given by:
ci¼ kaidAai=Areference
This relation defines kiα, the relative response coefficient of the
peak α characterizing species i. It has to be determined by calibration experiments.
A deconvolution process is necessary to determine the peak areas. This was done using a fixed Lorentz Gaussian function for the representation of each peak. Its position, its area and its width at half maximum then characterise each peak. The area will be used for the quantitative determination of species concentrations.
2.3. Spectra analysis
In acid aqueous solutions, titanium(IV) forms, with hydroxyl groups, complexes whose general formula is: [Ti(OH)n(H2O)(6− n)](4− n)+[13,14],
with 0≤n≤4. Previous studies provide apparent constants for the formation of the various complexes[15–18]. According to Nabivanets' conclusions[17], it appears that, for strong acidic solutions as in the case of the systems considered in the present work, the [Ti(OH)2(H2O)4]2+ion
is dominating in solution. As reported by Sole[19], some authors assume that the divalent titanium(IV) ion is TiO2+or [Ti(OH)
2(H2O)4]2+but, as
there is no strong evidence of the existence of the titanyl ion TiO2+, we
assume that divalent Ti (IV) ion is [Ti(OH)2(H2O)4]2+.
In the presence of sulphate and hydrogensulphate ions, this ion can form complexes containing one or two HSO4−or SO42−ligands[20–23].
As it may be observed in Fig. 1, when titanium(IV) is added to sulphuric acid solutions, several significant changes in the Raman spectrum appear. The 950–1150 cm− 1wavelength range is particularly
interesting because a new peak appears at 1010 cm− 1. It is located
between the SO42−peak at 980 cm− 1and the HSO4−peak at 1050 cm− 1.
Fig. 2gives an example of the deconvolution process. As it may be
seen, knowledge of the position of the SO42−and HSO4−peaks helps to
locate the three peaks in the 900 cm− 1–1100 cm− 1range during the
deconvolution process.
Fig. 3gives the intensity of the deconvoluted peaks for sulphuric
solutions containing various titanium(IV) concentrations, the total concentration of SO4, expressed as apparent H2SO4 concentration,
being about 6 M. It may be observed that the intensity of the peak at 1010 cm− 1increases with increasing titanium concentration and that,
simultaneously, the intensities of the SO42−peak (980 cm− 1) and of the
HSO4−peak (1050 cm− 1) decrease.
On the base of its position in the spectrum and of its relation to titanium concentration, the 1010 cm− 1peak has been attributed to
HSO4−(or SO42−) molecules complexing titanium(IV). Fig. 1. Effect of Ti(IV) addition on the Raman spectrum of sulphuric acid. ▬ cH2SO4
apparent
=5.98 M and cTi=3.01 M, — cH2SO4
apparent
=6.03 M and cTi=0 M.
Fig. 2. Representation of the spectra through the deconvolution process.
Fig. 3. Changes of Raman spectrum of H2SO4 solutions for increasing Ti(IV)
concentrations at cH2SO4
apparent
3. Results
The normalized experimental areas of the peaks at 980 cm− 1(SO 42−),
1050 cm− 1 (HSO
4−) and 1010 cm− 1 (Ti complex) for the solutions
studied during the present work are presented in Table 1.The treatment of Raman spectra of sulphuric aqueous solutions at various acid concentrations (1.02 to 9.85 M) allows the determination of the k980
SO2# 4 and k
1050 HSO#
4 relative response coefficients defined in Section 2.2
because the speciation in these solutions is well known from the literature[4–6].
The values are : k980 SO2#
4 ¼ 4:14M and k
1050 HSO#
4 ¼ 6:59M.
Assuming that these values are still valid in systems containing titanium(IV), it is possible to deduce the values of HSO4− and SO42−
concentrations, cHSO4− and cSO42− respectively, from the areas of the
peaks at 980 cm− 1and 1050 cm− 1present in the spectrum of solution
containing titanium(IV).
In the solutions considered here, the H2SO4apparent concentration
(cH2SO4
apparent) is always significantly lower than the concentration limit
(20 M) where molecular H2SO4becomes significant. It has to be pointed
out that cH2SO4
apparentincludes the concentration of sulphuric acid used to
prepare TiOSO4as well as the concentration of sulphuric acid used to
adjust the total amount of SO4, as explained in Section 2.1. Thus the
difference between cH2SO4
apparent and the measured values of c
HSO4−+cSO42−
could be attributed to the concentration of species containing sulphur in titanium(IV) complexes.
This quantity noted ccomplexis then calculated by mass balance on
H2SO4:
ccomplex
¼ capparentH2SO4 # cHSO#4# cSO2#4
The variation of the peak area located at 1010 cm− 1with ccomplexis
presented inFig. 4. The proportional tendency is in accordance with our assumption concerning the peak attribution.
4. Discussion
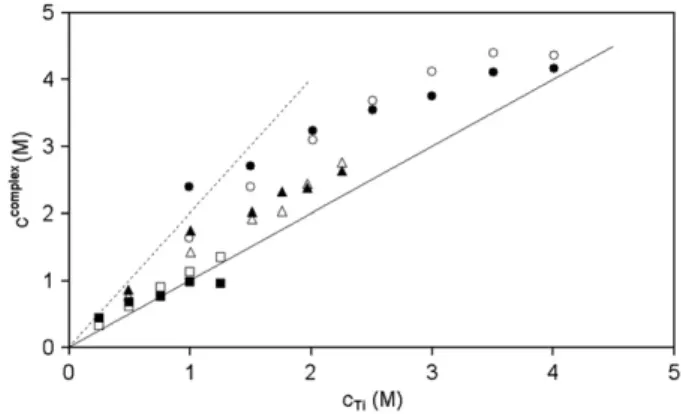
The variation of ccomplexas a function of the total concentration of
titanium(IV) noted cTiapparent, at three values of cH2SO4
apparentis presented in
Fig. 5. In this figure, the plain line corresponds to the behaviour
expected if there is only one 1–1 complex, neglecting the amount of free titanium(IV). For Ti(IV) complexes with two SO42−or HSO4−ligands,
the same assumptions give results represented by the dotted line. The actual variation lies between these two limiting cases. It indicates that both complexes (1–1 and 1–2) are present in the studied
systems, with, as expected, an increase of 1–1 complex and a decrease of 1–2 complex when the ratio cTiapparent/cH2SO4
apparent increases.
Experi-mental scatter and the assumption that there is no free Ti(IV) could explain why two experimental points are outside the sector determined by the two lines.
We suppose that the two complexes present in the solution can be formed with [Ti(OH)2(H2O)4]2+(whose concentration is denoted cTifree)
and HSO4−or SO42−.
With HSO4−, the complexes would be [Ti(OH)2HSO4(H2O)3]+and [Ti
(OH)2(HSO4)2(H2O)2], and their respective concentrations are denoted
ccpx1HSO 4
−
and ccpx2HSO 4
−
. If they are formed with sulphate, the complexes would be [Ti(OH)2SO4(H2O)3]0and [Ti(OH)2(SO4)2(H2O)2]− 2and their
respec-tive concentration are denoted ccpx1SO 4
2−
and ccpx2SO4.
2−
The equilibria corresponding to the complexes formation are, depending on the assumption concerning the ligand:
½TiðOHÞ2'2þðaqÞ þ i HSO−4¼ ½TiðOHÞ2ðHSO4Þi'ð2−iÞðaqÞ
with KHSO#4 i ¼ cHSO#4 cpx i cfree Ti ( cHSO# 4 ! "i
and i=1 or 2 or:
½TiðOHÞ2'2þðaqÞ þ i SO2−4 ¼ ½TiðOHÞ2ðSO4Þi'ð2−2iÞðaqÞ
with KSO2#4 i ¼ cSO2#4 cpx i cfree Ti ( cSO2#4 # $iand i =1 or 2
As the aim of the study is to characterise the solutions, we only consider apparent equilibrium constants. To estimate the complex
Table 1
Normalized area of HSO4
−
peak at 1050 cm− 1, of SO 4
2−
peak at 980 cm− 1and of 1010 cm− 1
peak corresponding to Ti complex, as a function of cTi apparent and cH2SO4 apparent cTi apparent (M) cH2SO4 apparent (M) ASO42− 980 /Areference AHSO4− 1050 /Areference ATi cpx1010 /Areference 0.25 1.98 0.069 0.017 0.036 0.50 1.98 0.059 0.014 0.065 0.76 1.99 0.054 0.013 0.051 1.00 2.00 0.046 0.011 0.072 1.26 2.01 0.054 0.013 0.055 0.50 3.52 0.113 0.027 0.096 1.01 3.93 0.084 0.020 0.156 1.51 3.93 0.066 0.016 0.176 1.77 3.98 0.055 0.013 0.200 1.98 4.03 0.062 0.015 0.179 2.26 4.32 0.061 0.015 0.186 1.00 5.88 0.139 0.034 0.186 1.51 5.93 0.108 0.026 0.229 2.02 5.96 0.107 0.026 0.240 2.51 5.95 0.098 0.024 0.258 3.00 5.97 0.095 0.023 0.332 3.51 6.17 0.050 0.012 0.325 4.01 6.00 0.049 0.012 0.345
Fig. 4. Variation of the complex peak area with ccomplex.
Fig. 5. Variation of ccomplexwith Ti concentration and c H2SO4 apparent ≈2 M (experimental ■, calculated □),cH2SO4 apparent ≈4 M (experimental ▲, calculated Δ), cH2SO4 apparent ≈6 M (experimental ●, calculated ○).)
formation constants, it is necessary to calculate ccpx iHSO4 − or SO 4 2− and cTifree, cSO42−or cHSO4−.
The concentrations cSO42−and cHSO4−are directly deduced from the
corresponding peak areas and, by mass balance on sulphuric acid. If only one kind of complex is present, the quantity of ligand and then of complex may be calculated using only a mass balance relation on sulphur. However as it has been found that there are probably two complexes, the determination of complex formation constants has to be made through an optimisation method. For instance in the case of sulphate ligand, at fixed values of K1SO 4
2−
and K2SO 4
2−
, the concentration of free titanium may be calculated by:
cfree Ti ¼ capparent Ti 1 þ KSO2#4 1 cSO2# 4 þ K SO2# 4 2 c2SO2# 4
Then it becomes possible to check the mass balance on sulphur as well as on titanium. The deviations on both mass balance conditions have been used as an objective function to get the formation constant values allowing calculation of the concentration of all species.
We obtain: KHSO#4 1 ¼ 1:1M and KHSO # 4 2 ¼ 0:9M2 KSO2#4 1 ¼ 3:4M and KSO 2# 4 2 ¼ 12:1M2
Both assumptions (complex with HSO4− or with SO42−) lead to
satisfactory results on the base of mass balances. On Fig. 5 is presented, together with the values deduced from mass balance, the values calculated ccomplexusing the preceding formation constants
with the assumption of complexes with SO42−.
To find the actual complexes, the concentration of H+, denoted c H+,
has been calculated by two different ways: –from HSO4−dissociation
–from electroneutrality condition
The first method is based on the relation between H+and the
concentrations of SO42− and HSO4− through the HSO4− dissociation
apparent constant.
The dissociation of HSO4−leads to
HSO# 4 ¼ SO2#4 þ Hþ with Kd¼ cSO2# 4 cHþ cHSO# 4
The apparent dissociation constant Kdhas been calculated from
our experiments on sulphuric acid solutions without titanium. In our range of H2SO4 concentration, Kd is quite proportional to cH2SO4
apparent:
Kd=0.51 cH2SO4
apparentwith σ (standard deviation)=±0.15 M. It has to be
pointed out that in the case of systems with titanium, the value of cH2SO4
apparentcorresponds to the initial apparent H
2SO4concentration less
the part involved in the complexes. This expression is used to fit the experimental points and cannot be extrapolated outside the concen-tration range used for the fitting. Knowing cHSO4− and cSO42− in the
solutions containing titanium from Raman experiments and Kdas a
function of cH2SO4
apparent, it was possible to estimate c H+.
cH+ may also be calculated by applying the electroneutrality
condition, the concentration of all other species being deduced from mass balance and from the analysis of Raman spectra.
Fig. 6represents cH+calculated from HSO4−dissociation constant as
a function of cH+calculated from electro neutrality.
It can be seen fromFig. 6that the assumption linked to complexes formed with SO42−leads to the best results. The remaining difference
could be explained by the experimental scattering and by the fact that we have considered free titanium only as [Ti(OH)2(H2)4]2+and have
not taken into account the other titanium(IV) hydroxide species.
Our values for K1SO 4
2−
(3.4 M) and KSO42−
2 (12.1 M2) differ from the values
obtained by the authors who have considered the same complexes: Nabivanets [23] has obtained K1SO 4
2−
=248.8 M and KSO42−
2 =157.5 M2
while Babko et al. [20] obtained K1SO4
2−
= 169.5 M and KSO42−
2 –=
76.9 M2. Moreover, Babko has considered a third complex containing
three SO42−. The differences can be explained by the difference in the
concentrations of H+, of SO
42−, and of Ti(IV). In the literature studies, cTi
is lower than in our work (capparent
Ti =2.10− 4 M for Nabivanets, and
capparent
Ti =10− 3M for Babko). The formation constants have then been
extrapolated to infinite dilution and are thermodynamic constants, contrary to the apparent constants that we have determined. Tur'yan and Maluka[24], who have considered a complex with Ti(OH)3+and
one SO42−, have shown than the apparent constant of formation
decreases when the ionic strength increases. Hence the apparent discrepancies between the published values are probably due to significant differences in the concentration ranges considered as well as to the use of different assumptions concerning the species. 5. Conclusions
When Ti(IV) is added to aqueous solutions of sulphuric acid, a new Raman peak appears at 1010 cm− 1that may be attributed to
sulphate ions present in titanium complexes. Based on the results of various tests, it appears that the best assumption is the formation of the two following titanium complexes: [Ti(OH)2SO4
(H2O)3]0and [Ti(OH)2(SO4)2(H2O)2]− 2. The corresponding apparent
equilibrium constants have been evaluated and compared with literature values.
References
[1] M. Cherif, A. Mgaidi, M.N. Ammar, W. Fürst, J. Solution Chem. 29 (2000) 255. [2] J-P. Passarello, W. Fürst, Fluid Phase Equilib. 116 (1–2) (1996) 177.
[3] J-P. Passarello, W. Fürst, Proceedings of XXIV JEEP, Université H. Poincaré, Nancy-France, 1998.
[4] T.F. Young, L.A. Blatz, Chem. Rev. 44 (1949) 93. [5] D.J. Turner, J. Chem. Soc., Faraday Trans. II 68 (1972) 643. [6] H. Chen, D.E. Irish, J. Phys. Chem. 75 (1971) 2672.
[7] R.A. Cox, Ü.L. Haldna, K.L. Idler, K. Yates, Can. J. Chem. 59 (1981) 2591. [8] Ü. Haldna, R.A. Cox, R. Juga, E. Rajavee, EESTI NSV Tead. Akad. Toim. Keemia 36
(1987) 261.
[9] C.E. Lund Myhre, D.H. Christensen, F.M. Nicolaisen, C.J. Nielsen, J. Phys. Chem. A 107 (2003) 1979.
[10] S. Kratsis, G. Hefter, P.M. May, Pal Sipos, Aust. J. Chem. 53 (2000) 363. [11] W.W. Rudolph, G. Irmer, G.T. Hefter, Phys. Chem. Chem. Phys. 5 (2003) 5253. [12] G. Raskopf, PhD dissertation. Ecole des Mines de Paris, Paris (1990).
[13] C.F. Baes, R.E. Mesmer, The Hydrolysis of Cations, Krieger Publi. Comp., Hefty fellow, Florida, 1976.
[14] J.-P. Jolivet, M. Henry, J. Livage, Savoirs Actuels, InterEdition/CNRS Editions, Paris, 1994.
[15] A. Liberti, V. Chiantella, F. Corigliano, J. Inorg. Nucl. Chem. 25 (1963) 415. Fig. 6. Comparison between values of cH+calculated from HSO4
−
dissociation constant and from electroneutrality condition, assuming HSO4
−
complexes (□) or assuming SO4
2−
[16] V.A. Nazarenko, V.P. Antonovich, E.M. Nevskaya, Russ. J. Inorg. Chem. 16 (1971) 530. [17] B.I. Nabivanets, V.V. Lukachina, Ukrain. Khim. Zhur. 30 (1964) 1123.
[18] F.I. Lobanov, V.M. Savostina, L.V. Serzhenko, V.M. Peshkova, Russ. J. Inorg. Chem. 14 (1969) 562.
[19] K.C. Sole, Hydrometallurgy 51 (2) (1999) 239.
[20] A.K. Babko, E.A. Mazurenko, B.I. Nabivanets, Russ. J. Inorg. Chem. 14 (1969) 1091.
[21] A.B. Lundin, T.V. Luzgina, I.I. Kalinichenko, Russ. J. Inorg. Chem. 31 (1986) 44. [22] J. Beukenkamp, K.D. Herrington, J. Am. Chem. Soc. 82 (1960) 3025. [23] B.I. Nabivanets, Russ. J. Inorg. Chem. 7 (1962) 210, 352.