HAL Id: hal-01100675
https://hal.inria.fr/hal-01100675
Submitted on 6 Jan 2015
HAL is a multi-disciplinary open access
archive for the deposit and dissemination of
sci-entific research documents, whether they are
pub-lished or not. The documents may come from
L’archive ouverte pluridisciplinaire HAL, est
destinée au dépôt et à la diffusion de documents
scientifiques de niveau recherche, publiés ou non,
émanant des établissements d’enseignement et de
Measuring the Performance of User Traffic in Home
Wireless Networks
Srikanth Sundaresan, Nick Feamster, Renata Teixeira
To cite this version:
Srikanth Sundaresan, Nick Feamster, Renata Teixeira. Measuring the Performance of User Traffic
in Home Wireless Networks. Passive and Active Network Measurement Conference, Mar 2015, New
York, United States. �hal-01100675�
Measuring the Performance of User Traffic
in Home Wireless Networks
Srikanth Sundaresan1, Nick Feamster2, Renata Teixeira3
srikanth@icsi.berkeley.edu, feamster@cs.princeton.edu, renata@inria.fr
1ICSI 2Princeton 3Inria
Abstract. This paper studies how home wireless performance characteristics af-fect the performance of user traffic in real homes. Previous studies have focused either on wireless metrics exclusively, without connection to the performance of user traffic; or on the performance of the home network at higher layers. In contrast, we deploy a passive measurement tool on commodity access points to correlate wireless performance metrics with TCP performance of user traffic. We implement our measurement tool, deploy it on commodity routers in 66 homes for one month, and study the relationship between wireless metrics and TCP per-formance of user traffic. We find that, most of the time, TCP flows from devices in the home achieve only a small fraction of available access link throughput; as the throughput of user traffic approaches the access link throughput, the charac-teristics of the home wireless network more directly affect performance. We also find that the 5 GHz band offers users better performance better than the 2.4 GHz band, and although the performance of devices varies within the same home, many homes do not have multiple devices sending high traffic volumes, implying that certain types of wireless contention may be uncommon in practice.
1
Introduction
Many home networks use 802.11 wireless as a predominant mode of communication; in fact, many consumer devices in home networks connect exclusively over a wireless connection. Despite increasingly widespread deployment of home wireless networks, there is little information about their performance in real homes, particularly as it relates to that of real user traffic and end-to-end performance. Understanding how wireless performance affects end-to-end user performance will become increasingly important as the throughput of residential access links continues to increase and the home wireless network becomes more likely a bottleneck.
There is an extensive set of previous work studying wireless network performance in many settings, including conferences, enterprise networks, and even apartment com-plexes [1, 3, 6, 9, 10, 12]. These studies have measured either layer-2 performance met-rics (such as wireless bitrates and retransmissions) or layer-3 performance such as TCP throughput over the wireless link. Yet, wireless network performance is extremely vari-able, even on short timescales, and mapping layer-2 performance to higher-level perfor-mance metrics such as throughput or latency is challenging. Additionally, active mea-surements can only capture the wireless network performance at one point in time; these
measurements may not correspond to the performance that users see in practice for their actual application traffic.
In this paper, we explore the relationship between wireless performance metrics and TCP performance of user traffic. To do so, we passively measure wireless performance metrics on user traffic as it passes through the home wireless access point and correlate these metrics with the TCP performance of user traffic. We implement a measurement tool that runs on a commodity home wireless access point, which permits a widespread deployment and the ability to differentiate wireless versus wide-area performance. The routers that we use for our study have both 2.4 and 5 GHz radios, which allows us to compare the performance of these two bands. The deployment on commodity hardware poses strict design constraints: (1) the devices are resource-constrained, which limits the amount of collection and processing we can do; (2) each home has only a single mea-surement vantage point; and (3) we aim to use unmodified drivers to avoid interfering with the very environment that we are trying to measure. We measured the performance of wireless networks in 66 home networks around the world; we passively measure user traffic to extract both the performance of active TCP connections and wireless statistics such as frame bitrate and retransmissions. Our study both confirms results from previ-ous studies and reveals new phenomena. Specifically, we find:
• As access link capacity increases, wireless performance plays a greater role in the TCP throughput that users observe.
• Latency inside the home is a significant contributor to end-to-end latency.
• The 5 GHz channel performs better than the 2.4 GHz (in particular, latency over the wireless is larger for 2.4 GHz); we also find that bitrates are generally low and retransmission rates high on 2.4 GHz.
• Within the same home, different devices experience different wireless performance. • It is rare for devices in a home to send significant traffic volumes simultaneously. As content providers continue to place content closer to users and governments and companies continue to invest in increasing access link throughput, understanding how users’ home wireless networks relate to the performance that their traffic experiences will become critical for improving user experience. Our findings are a first step towards understanding the relationship between wireless performance metrics and TCP perfor-mance of user traffic. The results from this paper may ultimately be useful for designing a system to detect and isolate performance problems in home wireless networks.
2
Method
We describe the passive measurement tool that we developed for home access points, and the TCP and wireless performance metrics we used.
2.1 Measurements
We perform passive measurements of user traffic from commodity home wireless access points and correlate those measurements with the wireless metrics for the correspond-ing traffic. In contrast to active measurements, passive measurements more accurately
reflect the actual performance that users experience. Further, passive measurements do not introduce contention or other artifacts that could affect the conditions that we seek to characterize. A measurement tool that operates on commodity access points facili-tates both a widespread deployment, which can take advantage of an installed base of access points, and the ability to differentiate wireless versus wide-area performance. Ul-timately, such a tool could operate in practice for a large user population. On the other hand, both the resource limitations of commodity access points and the bandwidth con-straints in real home networks introduce design concon-straints that preclude using existing network diagnostic tools.
We collect packet traces of connections from the WAN interface and both wire-less interfaces on the access point using pcap. Packet traces from the WAN interface provide information about wide-area TCP connections and IP packets that traverse the access point. We configure the wireless interfaces in monitor mode to capture radiotap headers [11]. For each frame, the radiotap headers provide the source and destination MAC addresses, the received signal strength (RSSI), and the frame control bits (the bitrate used, and whether the frame was retransmitted).
Deployment:We deploy our measurements on BISmark [2, 17], which uses Netgear’s
WNDR 3700/3800 access point. This device has an Atheros chipset with a 450 MHz processor, one 802.11gn radio and one 802.11an radio. The 3800 has 128 MB of RAM, and the 3700 has 64 MB of RAM. The devices run OpenWrt with the ath9k wireless driver that uses the Minstrel rate adaptation algorithm with the default setting to a max-imum bitrate of 130 Mbps. To respect user privacy, we do not collect payloads, and we anonymize all IP addresses and MAC addresses using SHA-256 and a per-access point secret salt as the data is collected on the router. Table 1 summarizes our IRB-approved deployment and the characteristics of the home networks in this deployment; we collected data from 66 homes in 15 countries for one month in 2013.
Limitations: Our collection methods limit the types of wireless performance
prob-lems that we can study. First, continuous data collection from multiple interfaces on a commodity access point imposes significant CPU and data requirements. Thus, the router collect data only every five minutes on average for 15 seconds per iteration. The router exports only flow summaries, to reduce upload bandwidth requirements. This level of sampling precludes analyzing fine-grained characteristics (e.g., transient faults, other conditions that frequently vary) or characteristics that derive from complete TCP flows. Second, because we anonymize device MACs and IP addresses, finer-grained analysis of the impact of certain types of application flows on certain devices (video in mobile devices, for example) is not possible. It is also not possible to account for device-specific issues, such as buffering in mobile devices. Third, we only have a single vantage point from which to collect our measurements, because typically homes only have a single access point. In contrast, other studies collect and correlate data from mul-tiple radios [10] or mulmul-tiple vantage points [3, 6, 12]. Finally, due to a driver limitation in the deployed devices, we could not scan for nearby access points. Scanning caused persistent disconnections for a small number of users; since this had a direct impact on users (BISmark devices are intended to be used as the primary access point), we did not scan the medium.
2.2 Metrics
We use the passive traffic traces to extract both TCP-level performance metrics and wireless performance metrics.
TCP performance metrics.The access point runs tcptrace, which processes the
pcap traces to provide TCP statistics. We study the average download TCP throughput achieved during the captured lifetime of the flow. We use this metric to compute the
aggregate throughputat every one-second interval by summing the average
through-put of all active flows downloading traffic through a given access point during that interval. For reference, we compare the aggregate throughput with the access link ca-pacity, which we measure using BISmark’s active measurements. BISmark performs a multi-threaded TCP throughput test approximately every two hours [16, 17]. We de-fine the access link capacity as the 95th percentile of the multi-threaded throughput test measurements. We also study the round-trip time (RTT) of TCP connections, which
tcptracecomputes as the difference between the time of the data and SYN
pack-ets and its corresponding acknowledgments (tcptrace’s analysis algorithm already handles many corner cases, such as delayed acknowledgments). Running tcptrace at the access point allows us to measure both the RTT between the access point and the home devices (the LAN RTT) and the RTT between the access point and destinations in the wide-area (the WAN RTT).
Wireless performance metrics.We use the bitrate, retransmission rate, and received
signal strength indication (RSSI) as our indicators of wireless performance problems because we can obtain these metrics easily from packet headers. IEEE 802.11 bitrate adaptation techniques adjust the transmission bitrate as wireless channel conditions change. Although these techniques usually adapt rates even under benign conditions to determine the channel quality, rate adaptation is typically more frequent when the chan-nel quality is poor, because wireless senders typically reduce the bitrate in response to bit errors [8]. Thus, we also use the normalized bitrate, which is the average wireless bitrate computed over one second intervals, normalized by the maximum bitrate sup-ported by that channel, as an indicator of a poor wireless channel. Normalized bitrate tends to be low when the wireless channel quality is poor. When bitrate adaptation does not adjust the bitrate (e.g., due to varying channel conditions or contention), the normal-ized bitrate might not indicate channel quality, but in these cases retransmission rates are still high. We also compute the retransmission rate as the fraction of frames with the retransmit bit set in any given one-second interval.
3
Results
We present the results from our measurement study. We first measure the throughput and RTTs of user traffic in home networks and how these performance metrics relate to wireless performance metrics. We then explore the wireless performance characteristics of user traffic in more detail.
Total # of homes 66 Total # of countries 15
2.4 GHz
Active devices 192 Average devices per home 2.9
5 GHz
Active devices 66 Average devices per home 1.0
Fig. 1: Data collected for this study.
0.0 0.2 0.4 0.6 0.8 1.0
Normalized aggregate throughput
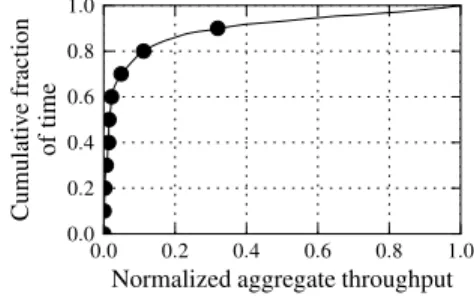
0.0 0.2 0.4 0.6 0.8 1.0 C um ul at iv e fr ac tio n of tim e
Fig. 2: The fraction of time that the collection of active flows receive a particular ratio of flow throughput to access link throughput.
3.1 Correlating TCP & Wireless Performance
We explore the achieved throughput of user traffic and the contributions of the home wireless network to this performance. Then, we study RTTs of user traffic and how the poor wireless network performance can result in higher LAN RTTs. This finding is relevant in light of the many recent efforts by service providers to reduce latency to end-to-end services with myriad optimizations and careful placement of content.
User traffic rarely achieves the full access-link throughput.Figure 2 shows the
frac-tion of time that the sum of TCP throughput for all flows in a home (the “aggregate throughput” as defined in Section 2.2) achieves a particular value relative to the access link throughput, as measured with BISmark’s active throughput test (the normalized aggregate throughput). The results show that the user traffic rarely saturates the avail-able access link throughput. Of course, the TCP traffic might not saturate the access link throughput for many reasons: for example, user traffic demand may be insufficient (in fact, previous studies have shown this phenomena is often the case [15]), or flows may be short enough that they fail to saturate the access link, which could happen if many short Web transfers are the dominant traffic type. Unfortunately, we have only the flow statistics exported by tcptrace, so we cannot run a tool like T-RAT [18] to identify with certainty when the application, as opposed to the network, was limiting TCP throughput. Nevertheless, it is remarkable that the access link is so underutilized so often. We suspect that one reason for lower utilization of the access link (when there is sufficient demand to saturate it) may be the presence of wireless bottlenecks in the home network. The rest of this section explores this possibility.
Achieved throughput often correlates with wireless performance metrics.To
ex-plore the relationship between the TCP throughput of user traffic in homes and access-link throughput, we measure how the aggregate throughput correlates with the bitrate and the retransmission rate. We normalize the aggregate throughput by the access link capacity (normalized throughput) and correlate this value with each of the wireless performance metrics. When we consider all traffic flows, TCP throughput does not cor-relate with any of the wireless performance metrics: the correlation coefficient between
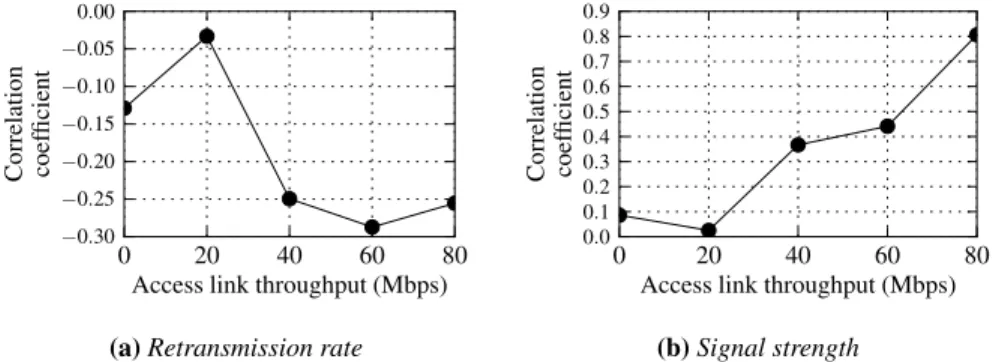
0 20 40 60 80 Access link throughput (Mbps)
−0.30 −0.25 −0.20 −0.15 −0.10 −0.05 0.00 C or re la tio n co ef fic ie nt
(a) Retransmission rate
0 20 40 60 80
Access link throughput (Mbps)
0.0 0.1 0.2 0.3 0.4 0.5 0.6 0.7 0.8 0.9 C or re la tio n co ef fic ie nt (b) Signal strength
Fig. 3: Correlation of wireless metrics to normalized throughput at different access link through-put levels. 0 10 20 30 40 50 LAN RTT (ms) 0.0 0.2 0.4 0.6 0.8 1.0 C um ul at iv e fr ac tio n of de vi ce s
(a)Distribution of TCP round-trip time between the access point and client across all devices in our study.
10−2 10−1 100
Ratio of LAN RTT/WAN RTT
0.0 0.2 0.4 0.6 0.8 1.0 C um ul at iv e fr ac tio n of de vi ce s
(b) The distribution of the median ratio of the LAN TCP round-trip time to the WAN TCP round-trip time across all flows for that device, across all devices.
Fig. 4: Round-trip latency of flows.
retransmission rate and normalized throughput is -0.01; for bitrate, the correlation co-efficient is -0.02; and for RSSI, the correlation is 0.06.
However, when we explore the correlation for the subset of flows whose normalized throughput is greater than 0.1 (i.e., for which we determine there is sufficient user de-mand), correlation between wireless metrics and access link throughput is stronger. This correlation increases with the access link throughput. In Figure 3a we show how the cor-relation coefficient between aggregate throughput and retransmission rate varies as we only consider users with access link throughput above a certain value; we see as this value increases, the correlation becomes stronger. Figure 3b shows a similar trend when we correlate RSSI with normalized throughput (though, obviously, the opposite trend holds; normalized throughput is positively correlated with RSSI). This result makes sense: wireless is more likely to introduce a bottleneck as access link throughput in-creases. The coefficient for bitrate follows a similar trend, but correlation is weaker for access links whose speeds exceed 60 Mbps, where the wireless network may be
operat-ing closer to its capacity. (The default settoperat-ing of the access points supports a maximum bitrate of 130 Mbps, which translates to a TCP throughput of about 85 Mbps under ex-cellent conditions; actual throughput will likely be less.) Patro et al. [10] also show in a more limited setting (dense deployments in two apartment complexes) that achieved throughput is highly correlated with the above wireless metrics.
The latency inside a home network is often a significant contributor to overall
round-trip time. The TCP round-trip time between the wireless access point and a
wireless client should be on the order of one millisecond. As this RTT increases, it not only signifies that the wireless link is bottlenecked due to buffering or medium access delays, but it can have an adverse impact on performance, especially for applications that are latency sensitive. Figure 4a plots the distribution of the median LAN RTT (as defined in Section 2.2) across all devices in our study. The median device on the local wireless network sees a median wireless latency of about 8 ms, but nearly 30% of the devices experience local TCP round-trip latencies greater than 15 ms. Buffering affects latency, particularly for mobile devices that sleep more frequently. While we cannot distinguish mobile devices in our dataset (because we anonymize MAC addresses and do not look into the payload), we try to minimize this issue by considering the mean of the RTTs, and only for flows with at least 25 packets in the downstream direction.
We also analyze the performance of the home network relative to the wide-area network performance; we compare the round-trip times between the devices and the access point to the round-trip times from the access point to the wide-area destination for each flow. We define the median latency ratio for a device as the median ratio of the LAN RTT to the WAN RTT (Section 2.2) across all flows for that device. Figure 4b shows the distribution of the median latency ratio across all devices. The result shows that 30% of devices have a median latency ratio greater than 0.2, meaning that for those devices, at least half of the flows have end-to-end latencies where the home wireless network contributes more than 20% of the overall end-to-end latency.
3.2 Wireless Performance of User Traffic
We now characterize wireless performance in our deployment. Our preliminary findings include: (1) the 5 GHz wireless band consistently achieves better performance than the 2.4 GHz band; (2) the performance of a home wireless network varies across individual wireless devices within the same home; and (3) multiple devices in the same home network rarely send high traffic volumes at the same time.
The 5 GHz band performs better than the 2.4 GHz band.We analyze the
perfor-mance that devices in home wireless networks achieve and how perforperfor-mance varies depending on whether devices are on the 2.4 GHz band or the 5 GHz band. Our hy-pothesis was that devices on the 5 GHz band would perform better because there are generally fewer devices (and surrounding access points) in the 5 GHz band, and that the 5 GHz band also has less non-WiFi interference (e.g., microwaves, baby monitors). As shown in previous studies, devices on 2.4 GHz experience both WiFi and non-WiFi interference [10].
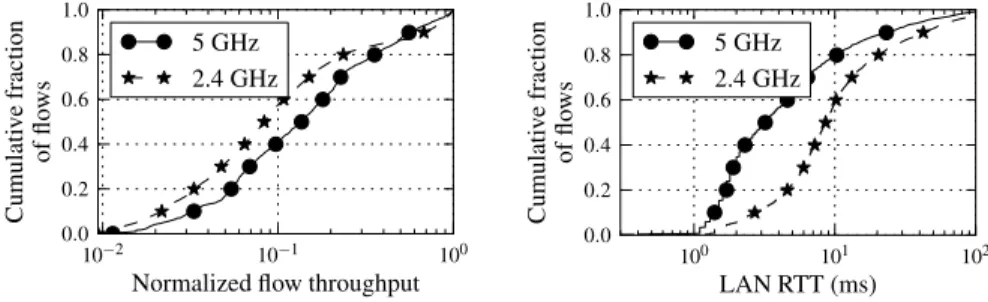
Figure 5a shows the impact of spectrum on flow throughput for flows that have throughput greater than 1 Mbps. We present the normalized flow throughput to
elimi-10−2 10−1 100
Normalized flow throughput
0.0 0.2 0.4 0.6 0.8 1.0 C um ul at iv e fr ac tio n of flo w s 5 GHz 2.4 GHz
(a) Flows in the 5 GHz band achieve higher throughput. 100 101 102 LAN RTT (ms) 0.0 0.2 0.4 0.6 0.8 1.0 C um ul at iv e fr ac tio n of flo w s 5 GHz 2.4 GHz
(b) Flows in the 2.4 GHz band experience higher LAN RTT.
Fig. 5: Characteristics of flows in the 5 GHz vs. the 2.4 GHz spectrum.
0 50 100 150 200 250 Bitrate (Mbps) 0.0 0.2 0.4 0.6 0.8 1.0 C um ul at iv e fr ac tio n of de vi ce s 2.4 GHz 5 GHz
Fig. 6: Distribution of wireless bitrates for de-vices in both the 2.4 GHz and 5 GHz spectrums, for all devices in the deployment. Devices in the 2.4 GHz spectrum see lower bitrates.
0.0 0.2 0.4 0.6 0.8 1.0 Normalized Bitrate 0.0 0.2 0.4 0.6 0.8 1.0 C um ul at iv e fr ac tio n of de vi ce s 2.4 GHz 5 GHz
Fig. 7: Distribution of median normalized bi-trates, for devices in both the 2.4 GHz and 5 GHz spectrums. Devices do not achieve max-imum bitrate, especially in the 2.4 GHz range.
nate any bias related to the access link capacity. Flows to devices on the 5 GHz spec-trum have higher normalized throughput than those on 2.4 GHz. Similarly, we see in Figure 5b that the LAN RTT for flows in 2.4 GHz are much higher than for flows in 5 GHz. The distribution of normalized flow throughput in each spectrum is similar be-tween the 2.4 GHz and 5 GHz when we consider flows whose normalized throughput is less than 0.1. We are investigating this phenomenon, but these could include cases where we suspect that there is not enough application demand. Even in those cases, however, the LAN RTTs are smaller for devices connected over 5 GHz.
Figure 6 plots the CDF of the median bitrate for all devices in all homes, for both the 2.4 GHz band and the 5 GHz bands. Only 30% of 2.4 GHz devices see median bitrates above 65 Mbps; in contrast, more than 50% of devices in the 5 GHz spectrum see bitrates greater than 100 Mbps. It is worth noting that the wireless bitrates do not correspond to the actual throughput. Even under perfect conditions, a wireless bitrate
0.0 0.1 0.2 0.3 0.4 0.5 Retransmission rate 0.0 0.2 0.4 0.6 0.8 1.0 C um ul at iv e fr ac tio n of de vi ce s 2.4 GHz 5 GHz
Fig. 8: Median retransmission rates, for devices in both the 2.4 GHz and 5 GHz spectrums. Re-transmissions are higher in the 2.4 GHz spec-trum, where nearly 30% of devices see a median retransmission rate greater than 10%.
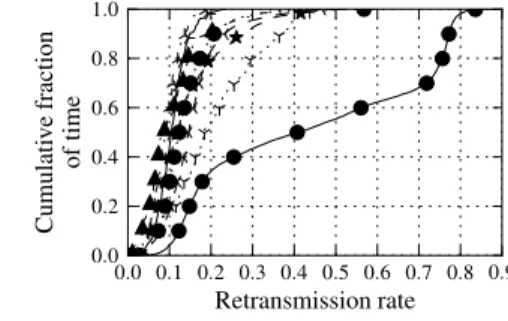
0.0 0.1 0.2 0.3 0.4 0.5 0.6 0.7 0.8 0.9 Retransmission rate 0.0 0.2 0.4 0.6 0.8 1.0 C um ul at iv e fr ac tio n of tim e
Fig. 9: The retransmission rates between the access point and clients in a single home net-work. In this home retransmission rates are high. Interestingly, one device has a signifi-cantly higher retransmission rate.
of 130 Mbps corresponds to an actual TCP throughput of about 80 Mbps. The bitrate values thus reflect a loose upper bound on the achievable end-to-end throughput.
Figure 7 shows the median bitrate per device for each home network, normalized by the maximum supported bitrate of the corresponding wireless protocol (between 65 Mbps and 300 Mbps for 802.11n, and 54 Mbps for 802.11a/g). Many devices, espe-cially those in the 2.4 GHz range, often operate close to the maximum bitrate supported by the protocol, more so than 5 GHz devices. However we also see that the maximum bitrates of 5 GHz devices are higher. This discrepancy can be explained by the fact that many devices in the 2.4 GHz channel could be small mobile devices with single an-tennas that restrict their maximum bitrates to 65 Mbps. Also, attenuation is higher on 5 GHz, which could lead to more active bitrate adaptation.
Figure 8 shows the retransmission rates for all devices across all homes; the result shows similar trends with respect to the 2.4 GHz and 5 GHz ranges: retransmissions are more common in the 2.4 GHz band, with about 20% of devices having retransmission rates above 10%.
Within a single home network, individual devices can experience very different
wireless performance. We also studied the performance of individual devices in a
home network and the extent to which wireless performance varies across devices in the same home network. We found many cases where the median wireless retransmis-sion rates for a device was high. For the devices in the home shown in Figure 9, nearly all of the devices have median retransmission rates greater than 10%. Interestingly, one device experiences a high retransmission rates nearly all of the time, suggesting a per-sistent problem that may result from device placement, interactions between the access point and that device’s driver, or some other cause.
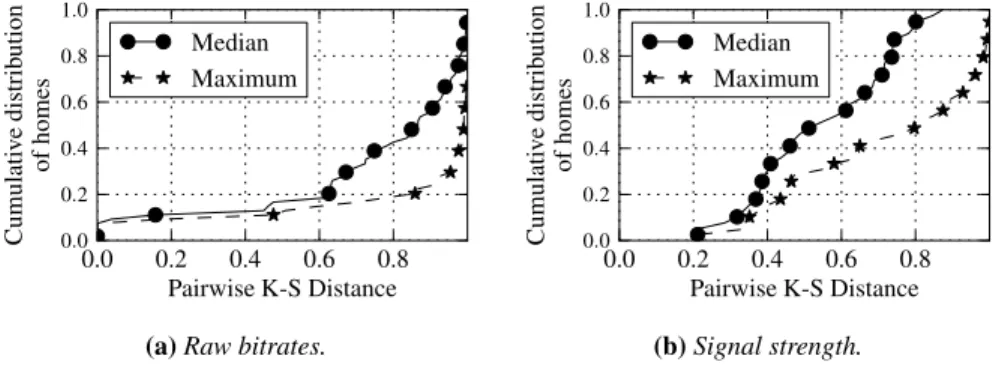
To study how wireless performance varies across devices in a single home, we mea-sure the K-S distance of the distributions of raw wireless bitrates between each pair of devices in each home. Figure 10a plots the median and the maximum pairwise K-S distance in each home. We find that more than 80% of homes have at least one pair
0.0 0.2 0.4 0.6 0.8 Pairwise K-S Distance 0.0 0.2 0.4 0.6 0.8 1.0 C um ul at iv e di st ri bu tio n of ho m es Median Maximum
(a) Raw bitrates.
0.0 0.2 0.4 0.6 0.8 Pairwise K-S Distance 0.0 0.2 0.4 0.6 0.8 1.0 C um ul at iv e di st ri bu tio n of ho m es Median Maximum (b) Signal strength.
Fig. 10: The pairwise K-S distance between devices within a home network, across all homes.
of devices with a K-S distance of more than 0.6, indicating that most homes have at least one poorly performing device (due to either poor placement, poor hardware, or poor drivers). We investigate the variance of RSSI across different devices and we see similar differences (Figure 10b). Future work could involve investigating the disparate performance across devices further and determining whether the variability in device performance is caused by any single factor.
Simultaneous communication is infrequent.Most of the homes in our deployment
had more than one active device during our study. Interestingly, however, these devices often were not highly active at the same time. We measured one-second intervals and observed the number of times that multiple devices were sending at least 25 packets within the one-second interval. To our surprise, simultaneous communication was rare: for 85% of the one-second intervals on the 2.4 GHz band and 93% of the intervals on the 5 GHz band, we observed at most one device sending at least 25 packets in the interval. This observation relates to wireless contention and may imply that certain types of wireless contention are infrequent. This finding contrasts with previous work that shows that contention is a factor in wireless performance [10]. This discrepancy may result from differences in either deployment locations or in measurement method and warrants further exploration.
4
Related Work
We focus our survey of related work on studies of wireless performance in real de-ployments and on attempts to detect and characterize common wireless performance problems.
The WiSe project is most similar to our efforts [10]; WiSe is a deployment of mul-tiple wireless monitors in a diverse set of home environments that are configured with custom measurement and monitoring software. In this deployment, each access point is a custom OpenWrt-based embedded device with two network interface cards: one that forwards traffic and another that monitors the quality of the wireless channel. Be-cause each WiSe access point has two interfaces, the deployment sees a much more
complete picture of the wireless spectrum. The deployment is also concentrated in two dense residential complexes; our deployment is larger and more diverse, but it does not use custom hardware with multiple network interfaces, which limits our ability to collect certain types of measurements. The work also designs an estimator for TCP performance based on wireless performance metrics; validating this model in our own testbed is part of our ongoing work. Other efforts have deployed dense monitors to study wireless in conferences, and university buildings [3, 5, 6]; these studies explore similar characteristics but do not focus on home network settings, which are generally lightly managed (or unmanaged) and hence potentially more chaotic. Papagiannaki et
al.[9] deploy and measure wireless performance characteristics in three homes.
Other work has characterized wireless performance problems using custom hard-ware or active measurements. Rayanchu et al. [13] detected non-wireless interference using custom hardware. Kanuparthy et al. [4] developed a tool to detect wireless per-formance problems (e.g., low signal-to-noise ratio, congestion, hidden terminals) us-ing both active probes and an additional passive monitor deployed within the network. Other techniques have also studied different types of wireless performance problems. Manweiler et al. build a tool to detect hidden interference in homes and adjust channel selection to minimize interference [7]; the tool requires a custom kernel and does not run on a commodity access point. Srivastava et al. develop a tool for estimating inter-ference in enterprise wireless LANs [14]; the tool requires collection and analysis of packet traces at multiple access points within an enterprise to perform diagnosis.
5
Conclusion
In this paper, we characterized the performance of user traffic in home wireless net-works from 66 homes in 15 countries using passive network measurements. We ana-lyzed passively collected traces in both the 2.4 GHz and the 5 GHz spectrum. One of the more significant challenges in executing this study involved designing a measure-ment tool that could operate within the tight constraints of a commodity home router and draw reasonable inferences from a single vantage point without a second monitor radio. Our study of this real user traffic in home networks revealed that most TCP flows in home networks achieve only a small fraction of the available access link throughput, that wireless characteristics have a greater effect on the performance of user traffic as access link throughput increases, that the 5 GHz channel exhibits better performance than the 2.4 GHz band, and that distinct devices within the same home can see very different wireless performance. We plan to build on these insights to create a diagnostic tool that can identify both the location of the network bottleneck link and the underlying causes of the bottleneck, should it lie in the wireless network. Finally, although wireless performance often suffers as a result of transient factors, such as microwaves, passing humans, or even minute changes in orientation of devices, many wireless performance problems are persistent. Our ability to monitor wireless performance over longer time periods in many homes may shed light on the persistent performance problems, which could offer a more holistic picture of wireless network performance problems.
References
1. Adya, A., Bahl, P., Chandra, R., Qiu, L.: Architecture and techniques for diagnosing faults in ieee 802.11 infrastructure networks. pp. 30–44. MobiCom ’04, ACM, New York, NY, USA (2004), http://doi.acm.org/10.1145/1023720.1023724
2. BISMark: Broadband Internet Service Benchmark, http://projectbismark.net/ 3. Cheng, Y.C., Afanasyev, M., Verkaik, P., Benk¨o, P., Chiang, J., Snoeren, A.C., Savage,
S., Voelker, G.M.: Automating cross-layer diagnosis of enterprise wireless networks. SIG-COMM Comput. Commun. Rev. 37(4), 25–36 (Aug 2007)
4. Kanuparthy, P., Dovrolis, C., Papagiannaki, K., Seshan, S., Steenkiste, P.: Can user-level probing detect and diagnose common home-wlan pathologies. SIGCOMM Comput. Com-mun. Rev. 42(1), 7–15 (Jan 2012)
5. Kotz, D., Essien, K.: Analysis of a campus-wide wireless network. Wirel. Netw. 11(1-2), 115–133 (Jan 2005)
6. Mahajan, R., Rodrig, M., Wetherall, D., Zahorjan, J.: Analyzing the mac-level behavior of wireless networks in the wild. pp. 75–86. SIGCOMM ’06 (2006)
7. Manweiler, J., Franklin, P., Choudhury, R.: Rxip: Monitoring the health of home wireless networks. In: INFOCOM, 2012 Proceedings IEEE. pp. 558–566 (March 2012)
8. Minstrel rate adaptation algorithm. http://goo.gl/5xPSC
9. Papagiannaki, K., Yarvis, M., Conner, W.S.: Experimental Characterization of Home Wire-less Networks and Design Implications. In: Proc. IEEE INFOCOM. Barcelona, Spain (Mar 2006)
10. Patro, A., Govindan, S., Banerjee, S.: Observing home wireless experience through wifi aps. pp. 339–350. MobiCom ’13, ACM, New York, NY, USA (2013)
11. Radiotap, http://radiotap.org
12. Rayanchu, S., Mishra, A., Agrawal, D., Saha, S., Banerjee, S.: Diagnosing wireless packet losses in 802.11: Separating collision from weak signal. In: INFOCOM 2008. pp. 735 –743 (april 2008)
13. Rayanchu, S., Patro, A., Banerjee, S.: Airshark: detecting non-wifi rf devices using commod-ity wifi hardware. pp. 137–154. IMC ’11, ACM, New York, NY, USA (2011)
14. Shrivastava, V., Rayanchu, S., Banerjee, S., Papagiannaki, K.: Pie in the sky: Online passive interference estimation for enterprise wlans. pp. 25–25. NSDI’11, USENIX Association, Berkeley, CA, USA (2011)
15. Siekkinen, M., Collange, D., Urvoy-Keller, G., Biersack, E.: Performance limitations of ADSL users: A case study. In: the Passive and Active Measurement Conference (PAM) (2007)
16. Sundaresan, S., de Donato, W., Feamster, N., Teixeira, R., Crawford, S., Pescap`e, A.: Broad-band internet performance: A view from the gateway. In: Proc. ACM SIGCOMM. Toronto, Ontario, Canada (Aug 2011)
17. Sundaresan, S., Burnett, S., de Donato, W., Feamster, N.: Bismark: A testbed for deploy-ing measurements and applications in broadband access networks. In: Proceeddeploy-ings of the USENIX Annual Technical Conference. Philadelphia, CA (Jun 2014)
18. Zhang, Y., Breslau, L., Paxson, V., Shenker, S.: On the characteristics and origins of internet flow rates. In: Proc. ACM SIGCOMM. Pittsburgh, PA (Aug 2002)