HAL Id: hal-01942692
https://hal-mines-albi.archives-ouvertes.fr/hal-01942692
Submitted on 3 Dec 2018
HAL is a multi-disciplinary open access
archive for the deposit and dissemination of
sci-entific research documents, whether they are
pub-lished or not. The documents may come from
teaching and research institutions in France or
abroad, or from public or private research centers.
L’archive ouverte pluridisciplinaire HAL, est
destinée au dépôt et à la diffusion de documents
scientifiques de niveau recherche, publiés ou non,
émanant des établissements d’enseignement et de
recherche français ou étrangers, des laboratoires
publics ou privés.
Measuring the Complexity of Product Configuration
Systems
Amartya Ghosh, Katrin Kristjandottir, Lars Hvam, Élise Vareilles
To cite this version:
Amartya Ghosh, Katrin Kristjandottir, Lars Hvam, Élise Vareilles. Measuring the Complexity of
Product Configuration Systems. ConfWS 2018 - 20th Configuration Workshop, Sep 2018, Graz,
Austria. p.61-68. �hal-01942692�
Measuring the Complexity of Product Configuration
Systems
Amartya Ghosh and Katrin Kristjansdottir and Lars Hvam
1and Élise Vareilles
2Abstract.1 The complexity of product configuration systems is an
important indicator of both development and maintenance effort of the systems. Existing literature proposes a couple of effort estimation approaches for configurator projects. However, these approaches do not address the issues of comprehensibility and modifiability of a configuration model. Therefore, this article proposes a metric to measure the total cognitive complexity of the configuration model corresponding to a product configuration system, expressed in the form of an UML class diagram. This metric takes into account the number and the type of attributes, constraints and the relationships between classes in an UML class diagram. The proposed metric can be used to compare two configuration models, in terms of their cognitive complexity. Moreover, a relation between development time for a PCS project and the total cognitive complexity of the corresponding configuration model is established using linear regression. To validate the proposed approach a case study is conducted where the cognitive complexity is calculated for two configuration models.
1
Introduction
Information technology tools, such as product configuration systems (PCSs), are widely used to handle the increased amount of information shared amongst customers, sales and production departments at companies, arising out of an increase in the demand of product customization [1]. PCSs are knowledge-based IT systems which fulfil a configuration task. A configuration task is a special type of design activity [2] facilitated by a number of components, their corresponding properties and ports, and constraints which restrict the number of feasible combinations associated with the components [3].
PCSs contain detailed information about the companies’ offerings. The information included in the configuration models depend on the type of the configuration system and usually include different components, attributes and rules of how the different components can be combined. Generally, the PCSs are not standalone IT systems. These systems are linked to existing IT systems within the companies (e.g., ERP, CAD, PLM, PDM, and calculation systems) either through integrations and/or interfaces. Coupled with the inherent complexity of the product knowledge modelled into the system, the integrations to other IT systems will render these configuration systems to be highly complex.
Practitioners in the industry are interested in metrics for comparing different PCS [5] and predicting the resource consumption required for developing, maintaining and extending the systems [6], [7]. The approach proposed in [6] defines a load
1 Engineering Management Department, Technical University of Denmark,
email: [email protected], [email protected], [email protected]
2 Toulouse University, email: [email protected]
estimation function that takes into account the impact of the industry and the organization on the project and the size and complexity of the product under consideration. The activities associated with the PCS development project include modelling the product structure and programming this model into a configuration software. However, this approach does not explicitly take into the consideration the complexity of the configuration model, while estimating the load required. Another approach to estimating the costs associated with PCS projects is to calculate the functional size of the UML class diagram of the configuration knowledge base using the IFPUG Function Point Analysis (FPA) technique [7]. This approach, however, is subjective in nature with regards to the definition of internal and external logical files (ILFs and ELFs). Moreover, the function point approach does not clarify the definition of one unit of function point [8]. The parametric complexity approach proposed in [5] involves calculating a metric on the basis of the number of business rules and the number of attributes, across two categories: field of engineering (sales, engineering and/or both) and the integration to other IT systems. However, the parametric complexity approach fails to take into account the complexity associated with the manner in which the configuration problem has been modelled into a PCS. A method to analyse the complexity of PCS is, therefore, needed.
This paper proposes a complexity metric that captures the different aspects associated with the PCS by focusing on the cognitive complexity of the configuration model. The metric can be used to effectively compare different PCS both developed on the same configuration software platforms or on different platforms. Also, the metric can be used to identify the impact of the complexity on the resource consumption for the development and maintenance activities associated with the PCS. Given that resources required for these activities are valuable and have limited availability, it is imperative that practitioners in the field have some metrics for predicting the extent of resource consumption required.
The proposed complexity metrics build on the approaches proposed in Felfernig (2004) and Kristjansdottir et al. (2017) by ascertaining the cognitive complexity of the UML class diagram associated with a given configuration problem. The proposed metric takes into account the effort required to understand and modify the way in which the PCS has been modelled, in terms of generalizations and aggregation structures, and the number and the type of business rules and attributes present in the configuration model.
The remainder of the paper is structured as follows. In Section 2 the concept of cognitive complexity known of software systems is introduced. The research methodology employed to carry out the analysis is explained in Section 3. Section 4 provides an overview of the mapping of the cognitive complexity metric of software
systems to configuration models. Section 5 then presents the findings from applying the method in a case company. Finally, Section 6 discusses the results and provide guidance for further studies.
2
Theoretical Background
This section presents the theoretical background for the proposed complexity metric for configuration models. It provides an overview of the existing literature on the topic of cognitive complexity of software systems.
Cognitive complexity is a measure of the functional complexity associated with designing and understanding a software system, based on the basic control structures (BCSs) existing in the system [9]. BCSs are considered to the building blocks of any software system. They are a collection of fundamental flow control mechanisms which are necessary for constructing the logical architecture of a software system [8]. Initially, Hoare et al. [10] identified three types of primitive commands (SKIP, ABORT and Assignment) and five types of more complex commands (sequential composition, non-determinism, conditional, iteration and recursion) in programming languages. Later, two further BCSs (function call, interrupt) were identified in system modelling by Wang [11]. Considering the sequential BCS as being representative of a unit BCS, a different cognitive weight is assigned to each BCS. The cognitive weight of a BCS is considered to be proportional to the effort required by a user in understanding the functionality and the semantics of the BCS, relative to the sequential BCS. Table 1 summarizes the BCSs and the corresponding cognitive weights:
Table 1: Cognitive weights of basic control structures (Adapted from
Wang, 2006 [9]
Category of BCS BCS Cognitive Weight
Sequential Sequence (SEQ) 1 Branch If-Then- Else (I-T-E) 2 Case 3 Iteration For-do 3 Repeat-until 3 While-do 3
Embedded Function Call (FC) 2 Recursion (REC) 3 Concurrency Parallel (PAR) 4 Interrupt (INT) 4
Existing literature proposes several approaches for calculating the cognitive complexity of programs written in object-oriented programming languages, based on the cognitive weights of the BCSs. Object-oriented programs comprise a number of classes, each of which consist of a number of attributes and methods, and are linked to other classes through aggregation, generalization or association structures. The overall complexity of object-oriented programs is obtained by calculating the cognitive complexity of the constituent classes based on the relationships between the classes. The class complexity (CC) is calculated by taking into consideration the cognitive complexity of the individual methods,
which in turn are made up of the blocks of BCSs, and the constituent attributes [12]. Therefore, the cognitive complexity of a method comprising q linear blocks of m layers of nesting BCSs with n linear BCSs in each layer, is calculated using the following equation (1):
(1) Where,
MC: total cognitive weight of the method 𝑤𝑤𝑐𝑐(𝑗𝑗, 𝑘𝑘, 𝑖𝑖): cognitive weights of individual BCSs
Moreover, the attributes of a class are assigned cognitive weights according to a categorization of the cognitive phenomena associated with their datatypes [13]. The cognitive weights for the attribute categories are summarized in Table 2. The attribute complexity (AC) of a class is calculated by multiplying the number of attributes belonging to a particular datatype category and its corresponding cognitive weight.
Table 2: Cognitive weights assigned to attributes (Adapted from
Arockiam and Aloysius [13])
Attribute Datatype
Associated Cognitive Phenomena
Cognitive Weight
Primary Sub-concious cognitive function
1 Derived Meta cognitive function 2 User-defined Higher cognitive function 3
Therefore, for a class containing ‘m’ number of methods, with the i-th method having a complexity of MCi, and having an attribute complexity, AC, equation (2) shows the cognitive complexity of the class (CC).
(2)
T
he reusability of software code in object-oriented programming languages is facilitated through the concept of inheritance. However, the use of several levels of inheritance often has an adverse impact on the maintainability and comprehensibility of software systems [14], [15]. Therefore, a number of cognitive complexity metrics have been proposed to penalise the use of inheritance structures in OOPs [14], [16].At the class level, the cognitive complexity of a class, CCi,
takes into account the number and complexity of the inherited classes, as shown in the following equation (3) [14][17]:
(3) Where,
: cognitive complexity of the i-th class due to inheritance : cognitive complexity of an inherited class of class i 𝑘𝑘: the number of inherited classes of class i
𝑙𝑙: the number of constituent methods in class i
: the cognitive complexity of the j-th method of class i Another approach to account for the presence of inheritance structures involves changing the way in which the total cognitive complexity of the program is calculated, depending on the level of inheritance of individual classes [16]. In this case, if the classes are on the same level of inheritance, their cognitive complexity
values are added together. However, if the classes are children of parent classes, then their values are multiplied. This is shown in the following equation (4) :
(4) Where,
𝑇𝑇C: cognitive complexity of the program
WCC𝑗𝑗𝑘𝑘: cognitive complexity of k-th class at level j of inheritance.
The cognitive complexity approach has been applied to empirically calculate the complexity of UML class diagrams. The cognitive complexity of UML class diagrams has been shown to be correlated to the generalization and association structures, with an increase in the number of classes and attributes leading to an increase in the cognitive complexity and also the time required to understand and modify the class diagrams [18]. This implies that, given the UML class diagram of a configuration model and, consequently, the cognitive complexity of the configuration model, the required man-hours for developing and maintaining the PCS can be estimated. In turn, this will make it possible for better resource planning for PCS projects, allowing more accurate business cases to be developed, prior to the initiation of projects.
3
Methodology
The authors have adopted the case study research method to calculate the complexity of a configuration model and, subsequently, propose a relation, which expresses the development time in terms of the proposed complexity metric.
The case company is a world leader in catalysts and surface science. It offers a variety of catalysts and a complete range of proprietary equipment, spare parts, and consumables. The company first launched a PCS in 2013 and has since then been building up the configuration area at the company. Currently the company uses five PCSs in the company, while two configurators are under development. The PCSs used by the company support the sales process of both catalysts and equipment at the company and where the first PCS supporting the engineering process, or the detail design of an equipment is being tested. The complexity of the PCSs used at the company has quite variations but the lack of method for analysing the complexity makes it difficult both to predict maintenance effort for the different PCS in utilization at the company and development effort required for new PCS. Thus, the company’s challenges were aligned with the research focus of the article.
In this study, the authors have analysed the configuration models pertaining to two PCSs. For each PCS, the following dataset was extracted from the configuration platform and used in the analysis:
• Model properties and statistics o Number of business rules o Number of attributes o Number of classes
• Documentation of the configuration model o Class structure
o The attributes and their domains for each class o The business rules for each class
These parameters are utilized to calculate the cognitive complexity metric for each configuration model.
Moreover, the information regarding the development time and maintenance time for both the PCSs were also collected, in order to establish a relation between the cognitive complexity metric and the development time and maintenance time. However, the time registrations for these PCSs are not accurately maintained by the company, thereby requiring an assessment of the reliability of the data. After an initial analysis of the data, coupled with discussions with the members of the configuration team at the case company, the authors decided to analyse the two PCSs for which the time registrations were accurate and reliable. The relation between the development time for the PCSs, the cognitive complexity metrics and the unknown time constants were framed in the form of an objective function. The objective functions were solved to obtain the values for the time constants, by means of linear regression.
4
Proposed Cognitive Complexity Metric for
Configuration Models
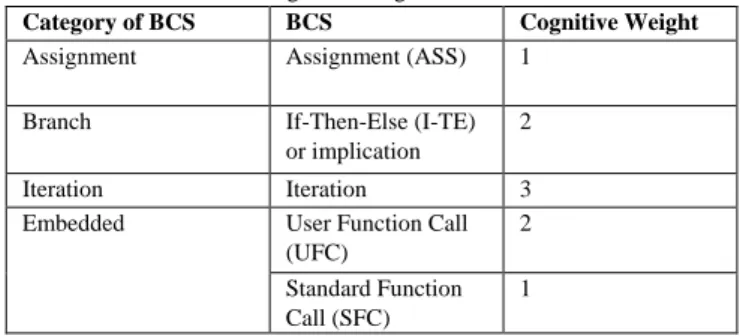
As addressed earlier, existing literature proposes a number of approaches for measuring the cognitive complexity of OOPs. However, the application of this concept to UML class diagrams of product configuration models presents an important deviation from those pertaining to OOPs. As PCSs are knowledge-based systems, the complexity of business rules (BRs) have a vital impact on the development and maintenance efforts of these systems [7]. In order to account for the impact of the BRs, the authors have assumed that each BR corresponds to a single method with a single block of layered BCS. Each constituent BCS of a BR has been assigned a cognitive weight, based on the classification proposed by Wang [8]. Table 3 summarises the cognitive weights for BCSs for each BR.
Table 3: Cognitive weight of BCS for BR
Category of BCS BCS Cognitive Weight
Assignment Assignment (ASS) 1 Branch If-Then-Else (I-TE)
or implication
2
Iteration Iteration 3
Embedded User Function Call (UFC) 2 Standard Function Call (SFC) 1
Thus, the cognitive complexity of a BR (BRC), consisting of m layers of nesting BCSs with nj linear BCSs in each layer, can be
calculated using the following equation (5):
(5) Where,
𝑤𝑤𝑐𝑐(𝑗𝑗, 𝑖𝑖): cognitive weight of the i-th BCS in the j-th layer of a
nesting BCS pertaining to a BR.
nj: number of BCS in the j-th layer of a nesting BCS pertaining to
a BR
Another feature of UML class diagrams specific to configuration models is the cardinality of the classes representing the aggregation structure. This particular feature is accounted for
by the presence of the iteration BCS. A nested BR containing an iteration BCS would only be invoked in cases wherein more than a single instance of a particular class is required to be created.
As mentioned earlier, the cognitive complexity of a class also comprises the cognitive complexity of the attributes. Table 4 shows the possible attribute domains present in the configuration platform used at the case company categorised according to the datatype categories mentioned in Table 2.
Table 4: Cognitive Weights of Attribute Datatypes Datatype Category Attribute Domain Cognitive Weight
Primary Integer, Float, Boolean
1 Derived Named Domain 2 User-defined Function, Class 3
Therefore, given a configuration model, the cognitive complexity of a constituent class (CCi), comprising ‘m’ methods, ‘n’ attributes and ‘p’ business rules, is calculated by adding the cognitive complexities of the methods (MCj), attributes (AC) and
the business rules (BRCk), as shown in equation (6):
(6) However, as the source codes of the configuration platforms (such as Tacton, Configit, SAP Configurator and so on) are generally confidential in nature and not available publicly, the authors decided to consider only the attribute complexity and the complexity of the business rules. Therefore, the final form of the cognitive complexity metric for a class used in the analysis is shown in equation (7).
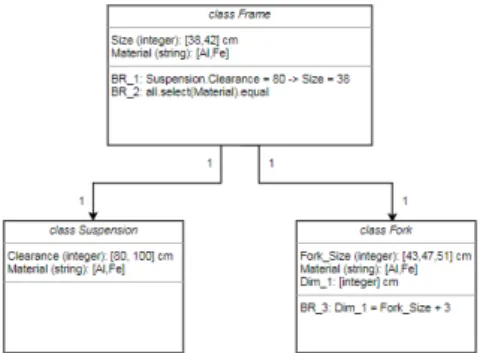
(7) As an example to illustrate the various calculations, an excerpt of an UML class diagram, depicting the configuration model pertaining to a bicycle, is presented in Figure 1. The model comprises three classes (class Frame, class Suspension and class Fork). The model comprises two aggregation relationships (wherein class Suspension and class Fork are “parts of” the class Frame) but no inheritance structures. The corresponding cardinalities, attributes and business rules are also shown in the figure.
Figure 1: Descriptive example of bicycle
In case of the class Frame in Figure 1, the calculation for the attribute complexity is shown below in Table 5.
Table 5: Descriptive example of bicycle: Calculation of attribute
complexity Attribute Name Domain Datatype category Cognitive Weight Attribute Complexity (AC)
Size Integer Primary 1
1+2 = 3 Material Named
Domain
Derived 2
For calculating the BRC for the class Frame, the nature of the BRs are established and the component BCSs are assigned their cognitive weights based on the categorization of BCSs.
BR_1 comprises of a single layer of nesting BCS (if statement) consisting of a single assignment BCS within it. Therefore, the BRCBR_1 is calculated using equation (5) as shown below:
BRCBR_1 = (Cognitive weight of if statement) * (Cognitive weight
of assignment statement) BRCBR_1 = 2*1 = 2
BR_2, on the other hand, is categorized as a standard function in the PCS software which has been used to model the configuration problem. Therefore, the business rule complexity of BR_2, BRCBR_2, is assigned the cognitive weight of 1. Therefore, the cognitive complexity of the class Frame, CCFrame, is calculated as shown below, according to the equation (7).
CCFrame = ACFrame + (BRCBR_1 + BRCBR_2) = 3+(2+1) = 6
Table 6 summarizes the results for the remainder of the classes shown in Figure 1.
Table 6: Descriptive example of bicycle: Calculation of class complexity
Class Name BRC AC CC
Frame 3 3 6
Suspension 0 3 3
Fork 1 4 5
Depending on the inheritance structure, the total complexity of the configuration model (TC) can be calculated by a combination of the cognitive complexities of the constituent classes, as shown in equation (8).
(8) Where,
CC𝑗𝑗𝑘𝑘: cognitive complexity of the k-th class at the j-th level of
inheritance.
Therefore, the total complexity of the configuration model shown in Figure 1 is given by: TC = 6+3+5 = 14. Given the value of the total cognitive complexity metric, TC, for a particular configuration model, the authors propose a relation, as shown by equation (9), to estimate the development time (XTime) and the
maintenance time for the model in man-hours.
Where,
𝑎𝑎: development time constant (in man-hours)
𝑏𝑏: development time constant (in man-hours) associated with a configuration model having a cognitive complexity of 1.
Taking into consideration the development times and the cognitive complexities of the two configuration models for which the time registration is available and accurate, the values of the time constants, a and b, are calculated, using linear regression.
However, as the value of TC is often not readily available before a configuration model has been fully developed, an estimated development time, 𝑋𝑋𝑋𝑋𝑇𝑇, can be calculated for a particular configuration model if the number of constraints and the number of attributes, as shown in equation (10), or the number of classes, as shown in equation (11), are known.
𝑋𝑋𝑋𝑋𝑇𝑇 = 𝑎𝑎 + 𝑏𝑏. ({#𝑎𝑎ttribute. AC𝑎𝑎v + #BR. BRC𝑎𝑎v}) (10)
𝑋𝑋𝑋𝑋𝑇𝑇 = 𝑎𝑎 + 𝑏𝑏. (#class. CC𝑎𝑎vg) (11)
The following section presents the results obtained from the application of the proposed metrics on two configuration models at the case company.
5
Results from the Case Study
As explained earlier, the authors have only considered two PCSs, for which reliable and accurate time registration data was available, for their analysis. To calculate the cognitive complexity metric of the corresponding configuration models, the following data was extracted from the configuration platform used at the case company:
• The UML class diagrams
• The attributes and their datatypes for each class • The business rules associated with each class
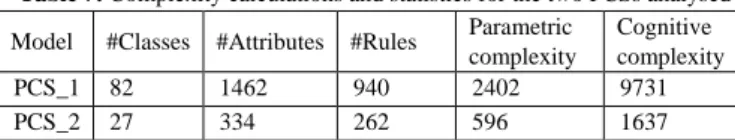
• Statistics pertaining to the overall configuration model: o Number of classes in the UML class diagram o Total number of attributes in the UML class diagram o Total number of constraints in the UML class diagram Based on this data, the total complexity, TC, of the two PCSs were calculated. The results, along with the input data are summarised in Table 7.
Table 7: Complexity calculations and statistics for the two PCSs analysed
Model #Classes #Attributes #Rules Parametric complexity Cognitive complexity PCS_1 82 1462 940 2402 9731 PCS_2 27 334 262 596 1637
Table 5 shows considerable differences in both the parametric and the total cognitive complexities (TC) of the analysed PCSs. This result is aligned with the initial scoping of the research of selecting PCSs representing both high complexity values and low complexity values. Moreover, three additional metrics were also defined for each model, as shown in Table 8. These metrics include the average values of the attribute complexity (ACavg), business
rule complexity (BRCavg) and the class complexity (CCavg).
Table 8: Additional metrics representing the complexity of the
PCS
Model ACavg BRavg CCavg
PCS_1 2.24 6.87 118.67
PCS_2 1.71 4.08 60.63
Overall average for any PCS 1.97 5.48 89.65
The values for ACavg and BRavg for each of the models do not take
into consideration the class structure for the configuration models. Based on these three metrics, the estimated average attribute complexity, average business rule complexity and average class complexity values for a configuration model developed at the case company are 1.97, 5.48 and 89.65 respectively. However, the results also show that there is a great variation of the complexity metrics calculated for the two systems, thus, the average complexity might not be provide us with the best possible estimates for the complexity of configuration models at the case company. Moving forward, more PCSs at the case company will have to be analysed to obtain results that are more indicative of the average PCS complexity at the company.
For the calculation of the time constants, a and b, pertaining to the relation between the cognitive complexity of the two configuration models and the development time for the corresponding PCSs, as expressed in Equation (9), the development times (in man-hours) are noted in Table 9.
Table 9: Development time in man-hours for the analysed PCS in the case
company
Model Development Time (in man-hours) PCS_1 2219
PCS_2 380
Therefore, given the value of the total cognitive complexity of a configuration model, TC, the estimated development time of a PCS at the case company can be calculated as:
𝑋𝑋𝑇𝑇𝑖𝑖𝑇𝑇e = 8.065 + 0.227𝑇𝑇C (12)
The ACavg, BRCavg and CCavg are obtained from the data for the
PCSs that have been analysed in this paper. Therefore, the final form of the equations (10) and (11) to estimate the development time of PCSs in man-hours at the case company, given the expected number of attributes and business rules or the expected number of classes, are presented in equations (13) and (14) respectively:
𝑋𝑋𝑋𝑋𝑇𝑇 = 8.065 + 0.227({#attribute × (1.97) + #BR × (5.48)}) (13)
𝑋𝑋𝑋𝑋𝑇𝑇 = 8.065 + 0.227({#𝑐𝑐lass × (89.65)}) (14)
Therefore, the following parameters of the configuration model are the pre-requisites for calculating an estimated development time for the PCS:
• The estimated number of classes, or
• The estimated number of business rules and attributes. Moreover, based on the hours used for development the required hours for maintenance can be calculated. Based on interviews in the company it is estimated that 30% of the total development hours are required on a yearly base for the maintenance activities.
6
Discussions and Conclusions
This paper proposes a metric for evaluating the complexity of a PCS, by taking into the consideration the UML class diagram of the corresponding configuration model. The proposed cognitive complexity metric takes into the account the effort required to understand and modify the way in which the configuration problem has been modelled. Furthermore, the authors also investigate the relation between the effort in man-hours required for the development of a new PCS and the proposed complexity metric. The results obtained in the present article aim to contribute to the field of PCS complexity and the impact of PCS complexity on the effort estimation associated with the development and maintenance of PCS projects.
The proposed metric for calculating the cognitive complexity of a configuration model builds on research in the fields of the cognitive complexity of object-oriented software systems [8], [9], [12], [13], complexity of PCS [5]–[7] and the cognitive complexity of UML diagrams [18]. The presence of business rules and a lack of material on the source codes of commercial configuration platforms render the direct application of existing cognitive complexity metrics to configuration models unviable.
By having a more standardized way of analysing the complexity of a configuration model should enable both more accurate resource estimations and allow for a comparison of different configuration models. The authors adopted a structured approach to analyze the cognitive complexity of a configuration model and relating it to the development and maintenance efforts. First, an UML class diagram is analysed, which should give information regarding total complexity of a configuration model (based on number of classes, the number and type of attributes, number and type of business rules). Second, the average values of the attribute complexity (ACavg), business rule complexity (BRCavg) and the
class complexity (CCavg) are calculated. Third, linear regression is
used to analyse man-hours for already developed systems to predict the future workload for new PCS.
The proposed method is validated in a case company where two different PCS were selected. The two PCS represent both PCSs with high and low parametric complexity. The proposed metric for analysing the cognitive complexity of the PCS confirmed the variation in the complexity. Further, by analysing the man-hours used for developing the systems, a function of total complexity and man-hours is used to predict the workload for a new PCS. The testing of the proposed method confirmed its usability. Further, testing is planned with in the case company where all the PCSs will be analysed in more detail, in order to verify the accuracy of the estimated development effort in man-hours when starting new PCS projects.
There are a few limitations to the research presented in this article. The proposed cognitive complexity metric primarily addresses only those configuration models which can be presented in form of an UML diagram. Further research will have to conducted in order to investigate the viability of applying cognitive complexity concepts to declaratively modeled products. Moreover, in case of declarative BRs, the authors have used their discretion to assign cognitive weights to such BRs. In certain cases, the procedural equivalent of the declarative BR is assigned the corresponding cognitive weight, whilst in others, the authors have considered the declarative BR to be either a standard function of the PCS or a user defined function.
This study focuses on the complexity of the configuration model. This means that the complexity resulting from integrations to other IT systems are not considered. Also, complexity for generating user interfaces and output documents are not taken into the account in the present study. Future work will, therefore, focus on including these parameters to better capture the overall complexity associated with a PCS and not only the complexity of the configuration model.
7
REFERENCES
[1] C. Forza and F. Salvador, “Managing for variety in the order acquisition and fulfilment process: The contribution of product configuration systems,” Int. J.
Prod. Econ., vol. 76, no. 1, pp. 87–98, 2002.
[2] S. Mittal and F. Frayman, “Towards a generic model of configuration tasks,” Proc. Elev. Int. Jt. Conf. Artif. Intell., vol. 2, pp. 1395–1401, 1989.
[3] A. Felfernig, G. E. Friedrich, and D. Jannach, “UML as domain specific language for the construction of knowledge-based configuration systems,” Int. J. Softw.
Eng. Knowl. Eng., vol. 10, no. 4, pp. 449–469, 2000.
[4] K. R. Ladeby and J. L. Pedersen, “Applying Product Configuration Systems in Engineering Companies : Motivations and Barriers for Configuration Projects,” DTU, 2009.
[5] K. Kristjansdottir, S. Shafiee, L. Battistello, L. Hvam, and C. Forza, “Complexity of Configurators Relative to Integrations and Field of Application,” 19th Int. Config.
Work., 2017.
[6] M. Aldanondo and G. Moynard, “Deployment of
Configurator in Industry: Towards a Load Estimation,”
ECAI 2002 Work. Config., pp. 125–130, 2002.
[7] A. Felfernig, “Effort Estimation for Knowledge-based Configuration Systems.,” SEKE, pp. 148–154, 2004. [8] Y. Wang, “Cognitive Complexity of Software and its
Measurement,” Proc. 5th IEEE Int. Conf. Cogn.
Informatics, vol. 1, pp. 226–235, 2006.
[9] J. Shao and Y. Wang, “A new measure of software complexity based on cognitive weights,” in Canadian
Conference on Electrical and Computer Engineering,
2003, vol. 2, pp. 1333–1338.
[10] C. A. R. Hoare et al., “Laws of programming,” Commun.
ACM, vol. 30, no. 8, pp. 672–686, Aug. 1987.
[11] Y. Wang, “The Real-Time Process Algebra (RTPA),”
Ann. Softw. Eng., vol. 14, no. 1–4, pp. 235–274, 2002.
[12] S. Misra, M. Koyuncu, M. Crasso, C. Mateos, and A. Zunino, “A Suite of Cognitive Complexity Metrics,” in
International Conference on Computational Science and Its Applications -2012, 2012, pp. 234–247.
[13] L. Arockiam and A. Aloysius, “Attribute Weighted Class Complexity : A New Metric for Measuring Cognitive Complexity of OO Systems,” World Acad.
Sci. Eng. Technol. Int. J. Comput. Electr. Autom. Control Inf. Eng., vol. 5, no. 10, pp. 1151–1156, 2011.
[14] D. Mishra and A. Mishra, “Object-oriented inheritance metrics in the context of cognitive complexity,” Fundam.
Informaticae, vol. 111, no. 1, pp. 91–117, 2011.
[15] R. Harrison, S. Counsell, and R. Nithi, “Experimental assessment of the effect of inheritance on the maintainability of object-oriented systems,” J. Syst.
[16] S. Misra, M. Koyuncu, M. Crasso, C. Mateos, and A. Zunino, “A Suite of Cognitive Complexity Metrics,” Int.
Conf. Comput. Sci. Its Appl. - ICCSA 2012, vol. 7336, pp.
234–247, 2012.
[17] H. Li, “Dynamic analysis of Object-Oriented software complexity,” 2012 2nd Int. Conf. Consum. Electron.
Commun. Networks, CECNet 2012 - Proc., pp. 1791–
1794, 2012.
[18] M. Esperanza Manso, J. A. Cruz-Lemus, M. Genero, and M. Piattini, “Empirical Validation of Measures for UML Class Diagrams: A Meta-Analysis Study,” LNCS, vol. 5421, pp. 303–313, 2009.
![Table 2: Cognitive weights assigned to attributes (Adapted from Arockiam and Aloysius [13])](https://thumb-eu.123doks.com/thumbv2/123doknet/12434833.334845/3.892.67.421.629.880/table-cognitive-weights-assigned-attributes-adapted-arockiam-aloysius.webp)