HAL Id: hal-00787317
https://hal.inria.fr/hal-00787317
Submitted on 11 Feb 2013
HAL is a multi-disciplinary open access archive for the deposit and dissemination of sci-entific research documents, whether they are pub-lished or not. The documents may come from
L’archive ouverte pluridisciplinaire HAL, est destinée au dépôt et à la diffusion de documents scientifiques de niveau recherche, publiés ou non, émanant des établissements d’enseignement et de
Propofol-induced GABAergic Tonic Inhibition
Diminishes α-rhythms and Induces δ-rhythms in
neuronal populations
Laure Buhry, Axel Hutt
To cite this version:
Laure Buhry, Axel Hutt. Propofol-induced GABAergic Tonic Inhibition Diminishes α-rhythms and Induces δ-rhythms in neuronal populations. [Research Report] Inria. 2013. �hal-00787317�
Propofol-induced GABAergic Tonic Inhibition
Diminishes
α-rhythms and Induces δ-rhythms in
neuronal populations
Laure Buhry1∗
and Axel Hutt1
1INRIA-Nancy Grand Est Research Center
Cortex Team - Building C 615, rue du Jardin Botanique
54600 Villers-ls-Nancy France
∗Email: laure.buhry@inria.fr
Abstract
Anaesthetic agents such as propofol are known to have an effect on both synaptic and extra-synaptic receptors. On the one hand, binding of propofol to GABA A synaptic receptors induces a phasic inhibition, as opposed to tonic inhibition which seems mainly induced by binding to extra-synaptic receptors. On the second hand, under aneasthesia, an increase in amount of slow oscillations, mainly δ (0-4Hz), concurrent to a decrease of α oscil-lations (8-12Hz), is observed in EEG recordings of occipital areas in most mammals including humans. The latter observation cannot be explained by sole phasic inhibition. Therefore, we propose to investigate, through numer-ical simulations, the role of tonic inhibition in the increase (in amount) of slow oscillations under propofol anaesthesia. To account for the biological realism of our simulations, the cortical model includes two neuronal popu-lations, one excitatory modeled by Type I Leaky integrate-and-fire neurons, one inhibitory modeled by Type II Morris-Lecar neurons, the stimulations are noisy, and the intrinsic cellular properties heterogeneous. The cells are connected through exponential conductance-based synapses. We show that, in presence of tonic inhibition, 1) the oscillation frequency of the network de-creases as well as subthreshold oscillations, inducing δ-rhythms in EEG-like recordings; 2) simulatneously, the amount of α-rhythms decreases supporting experimental evidence about the role of tonic inhibition.
Keywords: general anaesthesia, alpha oscillations, delta oscillations,
numerical simulations, propofol, tonic inhibition
0.0.1. Highlights
• Tonic inhibition induces a decrease in spiking frequency of neural net-work activity;
• The spike synchrony of the excitatory neuronal population decreases as tonic inhibition increases;
• α-rhythms in neuronal subthreshold activity tend to disappear in pres-ence of tonic inhibition;
• The peak in the power spectrum of the mean membrane voltage shifts toward δ-frequencies with the increase of tonic inhibition.
1. Introduction
Several anesthetic agents such as propofol (2,6-di-isopropylphenol) are known to elicit δ-rhythms (2-4 Hz) (Gugino et al., 2001) in the EEG of the occipital lobe and α-rhythms (10-15 Hz) in the EEG of more frontal parts of the cortex (Feshchenko et al., 2004; Gugino et al., 2001). Moreover, these phenomena are correlated with loss of consciousness. At the molecular level, propofol has been relatively well studied: the anesthetic induces inhibition effects through the binding to GABAA receptors (Houston et al., 2012). Two
major effects where especially highlighted experimentally: phasic (Kitamura et al., 2003) and tonic inhibition (Glykys and Mody, 2007). In addition to the phasic inhibition obsviously resulting from synaptic action, a process of tonic inhibition takes place when propofol is injected. Indeed, as the blood contration increases, molecules bind to extra-synaptic GABAAreceptors,
re-sulting in tonic inhibitory currents (Houston et al., 2012; Glykys and Mody, 2007; Farrant and Nusser, 2005; Scimemi et al., 2005; Semyanov et al., 2004; Mody, 2001).
Although the molecular effects of propofol are relatively well known, the interplay between the microscopic effects and the macroscopic observations in EEG, reflecting neuronal population activity, remains to be elucidated.
Models of synaptic action of propofol have been recently proposed in an attempt to explain the appearence of frontal α-rhythms (Ching et al., 2010), however no model can successfully reproduce the important amount of occipital δ-rhythms found under general anaesthesia nor the decrease of α-rhythms. The latest model included only synaptic effects of propofol, but never took into account consequences of extra-synaptic bindings. Hence, a potentiation of GABAAsynaptic current, only, does not seem to account for
the latter phenomenon.
The present work uses a computational model and numerical simulations to demonstrate, through tonic inhibition, that binding to extra-synaptic re-ceptors has non negligible effects at the neural network level under propofol anaesthesia. The model shows different effects of tonic inhibition, both on spiking and neuronal subthreshold activity: 1) the mean spiking activity is decreased by tonic inhibition, 2) in our study, spike synchrony of excitatory cells decreases as propofol concentration increases, 3) the amount of alpha oscillations in EEG-like signals decreases when tonic inhbition increases, 4) it induces an increase in the ratio between the amount of δ-oscillations and α-oscillations.
The paper is organized as follows: in section 2, we describe the neuron models used and the neural network designed for the simulations; section 3 summarizes the simulation results showing the effect of tonic inhibition on the raster plots of inhibitory and excitatory cells, and EEG-like data (mean excitatory membrane voltage).
2. Material and methods
2.1. Neuron models and tonic inhibition
12 32
4562
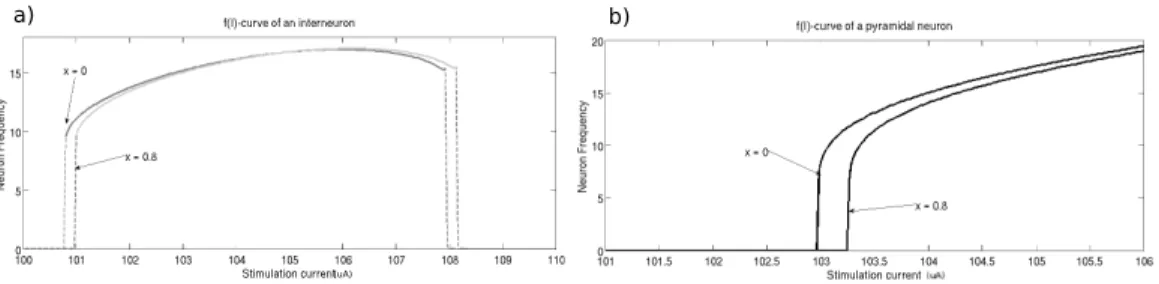
Figure 1: f(I) curves – Effects of tonic inhibition. x represents the amount of tonic inhibition in µS: here gton1= 20x µS namely 6µS and 16µS, and gton2= 100x µS namely
30µS and 80µS.
On the one hand, tonic inhibition apparently is mainly due to the presence of extra-synaptic receptors (Houston et al., 2012; Glykys and Mody, 2007; Farrant and Nusser, 2005; Scimemi et al., 2005; Semyanov et al., 2004; Mody, 2001). On the other hand, we know that extra-synaptic receptors are found on inhibitory as well as on excitatory neurons and, therefore, that tonic inhi-bition affects the two types of neuronal populations in different brain areas (Song et al., 2011; Belelli et al., 2009; Kullmann et al., 2005). Our mod-eling thus takes into account the effects of tonic inhibition on two different neuronal populations: pyramidal cells (400 µm2
) modeled by Type I excita-tory cells according to a Leaky-Integrate-and-Fire (LIF) neuron published in (London et al., 2008) and interneurons modeled by Type II inhibitory cells described by the Morris-Lecar model (Borisyuk and Rinzel, 2005).
Shunting/tonic inhibition occurs when the equilibrium potential of the tonic inhibition terms is very close to the resting potential of the cell; here, we model tonic inhibition by setting a pair of equilibrium potential and maximal conductance for the excitatory cells and a pair for the inhibitory cells. The
equations of the two neuron models including tonic inhibition are provided below.
2.2. Equations of the Leaky-Integrate-and-Fire model (LIF)
dV
dt = (gL(EL− V ) + I + ge ∗ (Eelif − V ) + gi(Eilif − V ) + gton1(Eton1− V ))/C1(1)
dgsyn = −
gsyn
τsyn
(2) where syn = e ori,
when spike, gsyn → gsyn+ wsyn
where Eton2 = −76mV (resting potential of Type I neurons) C1 = 33.181nF
(membrane capacitance), gL = 22.88nS, τm = C1/gL = 14.5ms (membrane
time constant), EL = −76.mV , VT = −58.0mV (threshold), Vr = −68.0mV
(reset), refractory period = 8.0ms.
2.3. Equations of the Morris-Lecar model (ML)
dV
dt = (−gCam∞(V )(VCa) − gKw(V − VK) − gL(V − EL)
−ge(V − Ee) − gi(V − Ei) − gton2(V − Eton2) + Iapp)/C2(3)
τw(V ) dw dt = w∞(V ) − w (4) dgsyn = − gsyn τsyn (5) where syn = e ori,
when spike, gsyn → gsyn+ wsyn
where gL is the leak conductance, EL is the resting potential, ge,i, Ee,i, τe,i
the parameters for the synapses, and gton, Eton the parameters for tonic
in-hibition. m∞, w∞, τw are given by:
m∞= 0.5(1 + tanh((V − V 1)/V 2))
w∞ = 0.5(1 + tanh((V − V 3)/V 4))
The fixed parameter values have been chosen as following:
Eton2= −60.9mV (resting potential of Type II neurons) C2 = 20µF/cm2; V 1 =
−1.2mV ; V 2 = 18mV ; gK = 8mS/cm2; gL= 2mS/cm2; VCa = 120mV ; VK =
−84mV ; VL = −60mV
V 3 = 2mV ; V 4 = 30mV ; gCa = 4mS/cm2; ϕ = 0.04;
Regarding tonic inhibition, we define tonic conductances that are phys-iologically reasonable for GABAA receptors (Song et al., 2011; Farrant and
Nusser, 2005) with respect to the stimulation needed to make the model neu-rons fire: gton1 = 20x µS and gton2 = 100x µS where x varies between 0 and
1, namely gton1 varies between 0µS and 20µS, andgton2 varies between 0µS
and 100µS.
In our study, the conductance of tonic inhibition in inhibitory cells is higher than for excitatory cells. This is consistent with the experimental observation that the tonic GABAA current usually is significantly smaller
than those in interneurons (Song et al., 2011; Scimemi et al., 2005).
The firing profiles of the two neurons are shown in Fig 2.1 without and with different amounts of tonic inhibition. At the cellular level, we notice a shift of the f (I)-curves to the right as tonic inhibition increases.
2.4. Noise and heterogenity 2.4.1. Noisy stimulations
The external input current applied during the simulations is given by constant values disturbed by white noise the following way:
Iapp= I0+ U [−60.0 µA; 60.0 µA](t, neuron) (for Type II neurons)
Iapp= Iconstant1+ U [−2.0 µA; 2.0 µA](t, neuron) (for Type I neurons)
where Iconstant1 is a constant value fixed for each simulation and I0, defined
below, depends on a constant value fixed for each simulation. This means that, for the values of I0 and Iconstant1 we use, the firing frequencies of the
neurons in the network range from 0 to 17 Hz, which is a rather high level of noise.
2.4.2. Heterogeneity
• For Type II
we add a spatial (i.e. over neurons) perturbation to the external input Iapp such that: ∀i ∈ {N eurons}I0(i) = Iconstant2+ N (0, ǫ2) (in µA),
where ǫ and Iconstant2 are constant values fixed for each simulation.
• For Type I
we add a spatial (i.e. over neurons) perturbation to the firing threshold such that: VT = −49 + N (0, ǫ1) (in mV)
For the results shown in the present article, we chose ǫ2 = 2 ans ǫ1 =
0.0001.
2.5. The neuronal network
1000 (750 LIF excitatory Type I and 250 ML inhibitory Type II) neu-rons are randomly connected with exponential synapses and the following parameters:
τe = 5ms (excitatory time constant)
τi = 20ms (inhibitory time constant)
wee = 0.005mS (excitatory synaptic weight to excitatory neurons),
wie = 0.008mS (inhibitory synaptic weight to excitatory neurons)
wei = 0.4mS (excitatory synaptic weight to inhibitory neurons)
wii = 0.5mS (inhibitory synaptic weight to inhibitory neurons)
Ei = −27.mV
Ee= 0mV (excitatory resting state)
Eilif = −75mV
The time constants of the synapses correspond, for the excitatory neurons, to those found in NMDA-type synapses, and for the inhibitory, to those found
in GABAA synapses.
The connectivity, very sparse, reflects cortical connectivity (Binzegger et al., 2004). We used the following probabilities of connections:
• inhibitory neurons to inhibitory neurons: 0.05 • inhibitory neurons to excitatory neurons: 0.02 • excitatory neurons to inhibitory neurons: 0.01 • excitatory neurons to excitatory neurons: 0.005
2.6. Analysis tools
2.6.1. Coherence Measure
Several ways of calculating the coherence of neural network activity have been described in the literature. The method that we have retained is the coherence measure, κ, based on the normalized cross-correlation of neuronal pairs in the network and described in Wang and Buzs´aki (1996). The coher-ence of two neurons x and y is calculated as following by the cross-correlation of their spike trains represented by X and Y within a time bin, τbin over a
time interval T : κxy(τbin) = PK l=1X(l)Y (l) q PK l=1X(l) PK l=1Y (l) 0 ≤ κxy ≤ 1.
The spike trains are given by: X(l) = 0 or 1 and Y (l) = 0 or 1, l = 1, 2, ..., K (K = τbin/T ), which mean that X(l) = 1 if there is at least one
spike in the bin.
The population coherence measure κ(τbin) = N1 X i=1 N2 X j=1 κij(τbin) M
computed in this work is the the coherence measure of pairs averaged overM pairs of spike trains of the numbers N1, N2. For instance, M = N (N − 1)/2
for intra-network coherence with N1 = N2 = N neurons, while M = N1N2for
coherence measures between different networks of number N1, N2 neurons.
When the time bin τbin is very small, a strong synchrony renders κ(τbin) close
to 1, and the smaller κ(τbin) the less synchronized the network activity.
2.6.2. Power spectrum
The power spectra are computed with a fast Fourier transform and aver-age over 10 simulations of the network with different random initializations (of noise, heterogeneity and connections) with a duration of 5s and a time resolution of 5ms, however, the simulation are run with an integration time of 0.5ms to avoid numerical integration problems. The fft Matlab routine is used to compute the spectra; this method decomposes the problem using the Cooley-Tukey algorithm; then, we take its absolute value, center it and keep only the positive frequencies.
3. Results
Propofol modifies GABAergic receptor dynamics and changes neural fir-ing activity, exertfir-ing either inhibition or even excitation Borgeat et al. (1991); McCarthy et al. (2008) It is also known that anesthetic agents induce changes in EEG recordings indicating that they alter the subthreshold activity of excitatory neurons since EEG is known to originate from subthreshold den-dritic currents on spatially aligned apical cortical dendrites (Nunez and Srini-vasan, 2005). In order to investigate whether tonic inhibition can induce such changes in EEG and decrease in neural firing activity, we perform a study of the power spectra of the subthreshold activity in excitatory neurons and the neural firing statistics in the populations.
To understand the effect of tonic inhibition on single neuron activity, Fig. 2.1 illustrate the firing rate of excitatory and inhibitory neurons sub-jected to external constant currents. Pyramidal cells exhibit a sigmoid-like f − I−curve and tonic inhibition shifts it to the right, i.e. a larger stim-ulation current is necessary to ellicit spikes in presence of tonic inhibition (Fig. 2.1(a)).
These findings, have consequences on neuronal population activity as de-scribed in the following.
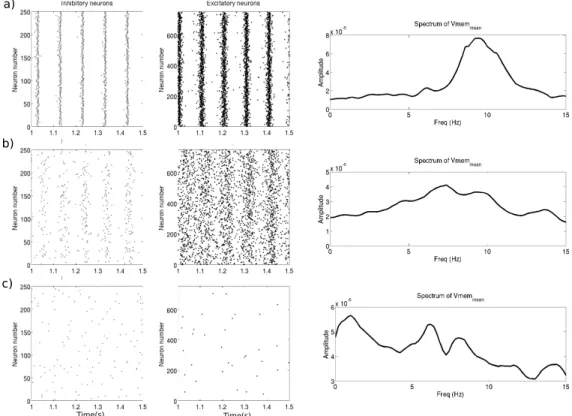
Figure 2 illustrates the behavior of the network when tonic inhibition is applied. In the absence of tonic inhibition, the network displays synchronized patterns of oscillations at about 9.5Hz (α-band) visible in the raster plots of the two neurnal populations and which also show up in the power spectrum of the subthreshold activity of the pyramidal neuronal population (Fig 2a).
When weak tonic inhibition is added (Fig 2b), the spiking activity slows down slightly, the synchrony visibly decreases and the activity becomes more random. Moreover, the frequency of the maximum power spectral density shifts to lower values, i.e. the amplitude of the α−activity decreases.
As the level of tonic inhibition keeps increasing (Fig 2c), the neurons fire more randomly accompanied by an extinction of α-activity in the neu-ral firing and subthreshold activity and a clear enhancement of δ-activity in the subthreshold activity as observed in the power spectral density. Finally, when the level of tonic inhibition x is increass further (x = 1.2), the firing of excitatory neurons stops and the inhibitory neurons remain active only for a transient period before its neuronal activity fully dies out as well (result not shown).
12
32
42
56789A2 56789A2
Figure 2: Raster plots of inhibitory and excitatory populations and smoothed power spec-trum of the membrane voltage of the excitatory cells: a) without tonic inhibition, b) with tonic inhibition, x = 0.3, gton1 = 6 µS and gton2 = 30 µS, and c) with x = 0.8,
gton1= 16 µS and gton2= 80 µS.
To further quantify the effect of tonic inhibition on the network activ-ity, Fig. 3(a) presents the intra-population coherence in the excitatory and inhibitory population and the inter-correlation between the excitatory and inhibitory population. It shows that the coherence in the excitatory popula-tion (dashed grey curve) decreases monotonically with the increase of tonic inhibition. In contrast the coherence of the inhibitory population (plain black curve) exhibits a minimum at x ≈ 0.45 and increases as the activity of the excitatory population becomes more random for x > 0.45. The coherence between the pyramidal and the interneuron populations (plain grey curve) is maximal, one notices a maximal synchrony at about x = 0.16 (zoom in
not shown), then the coherence becomes weaker in conjunction with the re-duction of the excitatory activity. A computation of κ for various bin sizes τ shows that it does not increase linearly with τ (not shown) and hence the relative firing time of neural pairs is not uniformly distributed between 0 and the oscillation period and thus that there really is synchronization, see the paper of Wang and Buzsaki for details..
Moreover, Fig. 3b) shows that the ratio between the amount of δ-rhythms and the amount of α-rhythms (dashed black curve) increases as a sigmoid-like function of the propofol concentration x and becomes larger than 1 from x = 0.575 (namely the quantity of α-rhythms is then smaller than the quantity of δ-rhythms); the ratio between the amount of θ and α-rhythms (plain gery curve) increases for x ∈ [0; 0.6], becoming larger than 1 for x > 0.49. The curve of the θ ratio crosses the curve of the δ ratio at x = 0.65 where the mount of delta remains higher. The ratio between β and α (dotted grey line) is larger than the ratio θ/α for x ∈ [0; 0.19], and larger than the ratio δ/α for x ∈ [0; 0.32], then is significantly smaller than the two other ratios reaching a maximum of 0.54 for x = 0.8.
12 32
Figure 3: Summary of the effects of tonic inhibition on the synchrony and the subthreshold activity of a cortical neural network. a) Coherence measure of the neuronal population as a function of propofol concentration (x). b) Ratio of the power values δ, θ and β compared to α.
4. Discussion – Conclusion
We could show with a two neuronal population model that, despite the role of extrasynaptic receptors is often negelected, the resulting tonic inhibi-tion greatly modifies the behavior of neural networks under propofol anaes-thesia.
On the one hand, regarding single neurons, we observed a shift to the right of the f(I) curve in presence of tonic inhibition which implies, for a same stimulation value, a lower firing frequency for the excitatory cells.
As a consequence, since excitatory cells entrain the inhibitory population, the whole network fires less often (raster plots of Fig. 2 and Fig. 3a). Hence, the amount of fast oscillations, like α decreases and the relative amount of δ increases as the propofol’s concentration increases (Fig. 2 power spectra and Fig. 3b), suggesting that tonic inhibition could be at the origin of increased δ-frequencies in occipital EEGs δ-frequencies in occipital EEGs.
On the other hand, in our case, synchrony is lower with than without tonic inhibition: tonic inhibition tends to “disconnect” the network. This decrease of spike synchrony explains in turn the diminution of the mean power spectra amplitude in Fig. 2.
Slow oscillations in presence of tonic inhibition emerge as a network ef-fect in the sense that single cells we used here, in particular the inhibitory cells, cannot fire at frequencies below about 8Hz. Moreover, noise and cell’s heterogeneity play a major role in “stabilazing”, making more robust, the effect of tonic inhibition; indeed, in absence of noise and heterogeneity, the network activity is very sensitive to tonic inhibition level that rapidly has a shunting effect as the level of tonic inhibition increases. We suspect that the effects of tonic inhibition would be even more stable with cells whose the firing profile, i.e. the f(I)-curve, would be less steep at slow frequencies. This would suggest that the appearance of δ-rhythms is not only due to tonic inhibition but also depends on intrinsic cellular properties.
To conclude, tonic inhibition through binding to extrasynaptic receptors probably accounts for the increased amount of δ-rhythms recorded in oc-cipital EEGs. This, together with the fact that extrasynaptic receptors are largely present in the hippocampus, could also, at least partly, explain ob-servations made in the MTL under general anaesthesia (Fell et al., 2005). References
Belelli, D., Harrison, N.L., Maguire, J., Macdonald, R.L., Walker, M.C., Cope, D.W., 2009. Extrasynaptic GABAA receptors: form, pharmacology, and function. The Journal of neuroscience : the official journal of the Society for Neuroscience 29, 12757–12763.
the Circuit of Cat Primary Visual Cortex. The Journal of Neuroscience 24, 8441–8453.
Borgeat, A., Dessibourg, C., Popovic, V., Meier, D., Blanchard, M., Schwan-der, D., 1991. Propofol and spontaneous movements: an EEG study. Anes-thesiology 74, 24–27.
Borisyuk, A., Rinzel, J., 2005. Understanding neuronal dynamics by geomet-rical dissection of minimal models, in: Models, in Neurophysics, M. (Eds.), Proc. Les Houches Summer School 2003, pp. 19–52.
Ching, S., Cimenser, A., Purdon, P.L., Brown, E.N., Kopell, N.J., 2010. Thalamocortical model for a propofol-induced -rhythm associated with loss of consciousness. Proceedings of the National Academy of Sciences . Farrant, M., Nusser, Z., 2005. Variations on an inhibitory theme: phasic
and tonic activation of GABAA receptors. Nature Reviews Neuroscience 6, 215–229.
Fell, J., Widman, G., Rehberg, B., Elger, C.E., Fern´andez, G., 2005. Human mediotemporal EEG characteristics during propofol anesthesia. Biological Cybernetics 92, 92–100.
Feshchenko, V.A., Veselis, R.A., Reinsel, R.A., 2004. Propofol-induced alpha rhythm. Neuropsychobiology 50, 257–266.
Glykys, J., Mody, I., 2007. Activation of GABAA Receptors: Views from Outside the Synaptic Cleft. Neuron 56, 763–770.
Gugino, L.D., Chabot, R.J., Prichep, L.S., John, E.R., Formanek, V., Aglio, L.S., 2001. Quantitative EEG changes associated with loss and return of consciousness in healthy adult volunteers anaesthetized with propofol or sevoflurane. British Journal of Anaesthesia 87, 421–428.
Houston, C.M., McGee, T.P., MacKenzie, G., Troyano-Cuturi, K., Ro-driguez, P.M., Kutsarova, E., Diamanti, E., Hosie, A.M., Franks, N.P., Brickley, S.G., 2012. Are Extrasynaptic GABAA Receptors Important Targets for Sedative/Hypnotic Drugs? The Journal of Neuroscience 32, 3887–3897.
Kitamura, A., Marszalec, W., Yeh, J.Z., Narahashi, T., 2003. Effects of halothane and propofol on excitatory and inhibitory synaptic transmission in rat cortical neurons. The Journal of pharmacology and experimental therapeutics 304, 162–171.
Kullmann, D.M., Ruiz, A., Rusakov, D.M., Scott, R., Semyanov, A., Walker, M.C., 2005. Presynaptic, extrasynaptic and axonal GABAA receptors in the CNS: where and why? Progress in biophysics and molecular biology 87, 33–46.
London, M., Larkum, M.E., H¨ausser, M., 2008. Predicting the synaptic information efficacy in cortical layer 5 pyramidal neurons using a minimal integrate-and-fire model. Biological cybernetics 99, 393–401.
McCarthy, M.M., Brown, E.N., Kopell, N., 2008. Potential network mech-anisms mediating electroencephalographic beta rhythm changes during propofol-induced paradoxical excitation. The Journal of neuroscience : the official journal of the Society for Neuroscience 28, 13488–13504. Mody, I., 2001. Distinguishing between GABA(A) receptors responsible for
tonic and phasic conductances. Neurochemical research 26, 907–913. Nunez, P.L., Srinivasan, R., 2005. Electric Fields of the Brain: The
Neuro-physics of EEG, 2nd Edition. Oxford University Press, USA. 2 edition. Scimemi, A., Semyanov, A., Sperk, G., Kullmann, D.M., Walker, M.C., 2005.
Multiple and plastic receptors mediate tonic GABAA receptor currents in the hippocampus. The Journal of neuroscience : the official journal of the Society for Neuroscience 25, 10016–10024.
Semyanov, A., Walker, M.C., Kullmann, D.M., Silver, R.A., 2004. Tonically active GABA A receptors: modulating gain and maintaining the tone. Trends in neurosciences 27, 262–269.
Song, I., Savtchenko, L., Semyanov, A., 2011. Tonic excitation or inhibi-tion is set by GABAA conductance in hippocampal interneurons. Nature Communications 2, 376+.
Wang, X.J., Buzs´aki, G., 1996. Gamma Oscillation by Synaptic Inhibition in a Hippocampal Interneuronal Network Model. The Journal of Neuroscience 16, 6402–6413.