HAL Id: hal-01845397
https://hal.archives-ouvertes.fr/hal-01845397
Submitted on 8 Nov 2019
HAL is a multi-disciplinary open access
archive for the deposit and dissemination of
sci-entific research documents, whether they are
pub-lished or not. The documents may come from
teaching and research institutions in France or
abroad, or from public or private research centers.
L’archive ouverte pluridisciplinaire HAL, est
destinée au dépôt et à la diffusion de documents
scientifiques de niveau recherche, publiés ou non,
émanant des établissements d’enseignement et de
recherche français ou étrangers, des laboratoires
publics ou privés.
Textural characterization of media composed of
compacted pieces of cardboard and polyethylene using a
gas tracer method
Mariem Kacem, Sylvain Salvador, Michel Quintard
To cite this version:
Mariem Kacem, Sylvain Salvador, Michel Quintard. Textural characterization of media composed
of compacted pieces of cardboard and polyethylene using a gas tracer method. Waste Management,
Elsevier, 2009, 29 (2), p.660-667. �10.1016/j.wasman.2008.09.002�. �hal-01845397�
Textural characterization of media composed of compacted pieces of cardboard
and polyethylene using a gas tracer method
M. Kacem
a, S. Salvador
a, M. Quintard
b,*aEcole des Mines d’Albi Carmaux, Route de Teillet, 81013 Albi CT Cedex 09, France bInstitut de Mécanique des Fluides de Toulouse, Allée C. Soula, 31400 Toulouse, France
a b s t r a c t
The aim of this work is the experimental determination of effective transport properties of porous media consisting of compacted pieces of cardboard and polyethylene (PE). The proposed method itself is more general and can be applied to many different materials and contexts. Three major transport properties were determined: porosity, tortuosity factor and permeability. Three parameters characterizing the media were varied over a wide range: the bulk density, the size of the elements entering the mix, and the proportion of cardboard and PE in the mix. The properties were measured by means of a specially designed experimental device based on miscible gas tracing. The porosity and tortuosity factor were simultaneously determined by parametric identification, based on the experimental sample output response to an inlet gas concentration step change compared to the results of a direct numerical model. Permeability was calculated in the standard way from the measurement of the pressure drop across the sample.
The reproducibility of the measurements was very good. It was found that changing the material den-sity of the medium significantly affects all three structural properties. When the bulk denden-sity is varied between 300 and 900 kg m!3, the tortuosity factor varies in a range as large as 18–8 and the permeability
decreases by a ratio of 2–3. The tortuosity factor shows unusual variation, characterized by a decrease when density is increased above 500 kg m!3. The size of the elements does not significantly affect the
structural properties of the medium in the range of parameters studied.
1. Introduction
Measuring the effective properties of porous materials is obvi-ously of general interest, and there is extensive literature on the subject. However, few results are available for the type of material generated by compaction processes, especially in the case of waste materials. The performances of many waste management pro-cesses are highly affected by transport properties such as porosity, permeability and effective diffusion. For instance, in a landfill, li-quid is injected near the top of the medium and flows through the porous medium, while gas flows to producing wells. In another domain, pellets or bricks are used in furnaces and during their combustion, oxygen is transported inside each fuel element.
Medium composition and density are likely to change depend-ing on various conditions such as initial mixdepend-ing of the different components or the density resulting either from the height of the pile or mechanical compaction. As a consequence, the fluid (gas or liquid) transport properties may also change drastically depend-ing on these conditions and this will affect very significantly the
progress of the chemical or biochemical reactions involved. As numerical modeling is used more and more often to simulate and understand such processes, it is important to have a good quantitative knowledge of the parameters that control fluid trans-port through the medium. However, the literature about the prop-erties of such complex media is very sparse. This motivated the design of an experimental apparatus based on gas tracing suitable for measuring transport properties of such materials.
Determination of diffusive properties is usually obtained from several types of diffusion cells. The most commonly used diffusion cell is the Wicke–Kallenbach device (Wicke and Kallenbach, 1941). It consists of two isobaric through-flow compartments communi-cating only by the porous medium. Two pure gas streams are setup in both compartments, and concentration in both streams is af-fected by counter-current diffusion through the porous wall. The analysis of the outlet gas compositions allows the effective diffu-sion coefficient in the porous material to be measured. This cell was later modified byDogu and Smith (1975). In the new design, the chambers are at the same pressure with the same gas, and a pulse injection of the second gas is made from one side. A slightly different diffusion cell design was proposed byCurrie (1960), and later modified byKim et al. (1987) to measure longitudinal and
*Corresponding author. Tel.: +33 5 63 49 30 26; fax: +33 5 63 49 30 99. E-mail address:salvador@enstimac.fr(M. Quintard).
axial effective diffusion coefficients. These methods are efficient for effective diffusivity determination, but they require sealed cham-bers so that any gas exchange has to pass through the sample. None of these methods are suitable for the measurement of disper-sion coefficients. They also cannot be used directly to measure other transport properties such as permeability.
Several methods have been developed to estimate dispersion coefficients. Most of the time, these methods can also be used for the determination of other transport properties. This is particularly the case for the methods based on the establishment of a miscible displacement in a porous column. The reader may look at the paper byPerkins and Johnston (1963)for a review of the early experi-mental works on diffusion/dispersion through porous media.
Since our objective is not limited to the measurement of effec-tive diffusion coefficients, we chose the principle of a dispersion column. Because of the sensitivity of these materials to liquids, in-ert gases were adopted as tracer fluids. The experimental setup is based upon the design of a special Hassler-type cell (Hassler, 1942). The apparatus allows three transport properties to be determined:
(i) Permeability is determined through the measurement of the pressure drop and the flow rate, with the help of Darcy’s law. (ii) Porosity and tortuosity factor are determined from the elution
curve through a parameter identification method.
Since no results were available for the materials under consid-eration in this study, the experimental procedure was first tested with spherical glass beads to validate the protocols. The device was then used to characterize mixes of compacted cardboard and polyethylene (PE) pieces. Cardboard and PE were chosen as typical materials to be found in waste. They are often both found in the form of sheets of films which can be shredded and compacted. Cardboard is a porous material, while PE is non-porous, and their mixture allows insight into a wide variety of waste material mixtures.
2. Description of the experimental device and direct numerical models
2.1. Experimental device
The experiments are conducted with cylindrical samples 100 mm high and 100 mm in diameter. For the porous medium made of glass beads, the sample is placed inside a cylindrical alu-minum cell. For compacted samples of PE and cardboard, the
sam-ples are prepared in cylindrical form. Two aluminum caps are placed at the top and bottom, as illustrated inFig. 1. They can be adjusted to the exact length of the sample, and are maintained in contact with the sample during the experiments. In order to dis-tribute the gas flow at the sample surfaces, the caps are grooved in two perpendicular directions with 6-mm deep V-shape grooves, every 11 mm. Gas injection is carried out through eight, 4-mm diameter holes uniformly distributed at the surface of the top cap. Tightness around the sample and around the caps is ensured following the Hassler design thanks to a 1-mm thick latex mem-brane (Hassler, 1942). An absolute air pressure of about 1.15 bars is maintained upon the outer surface of the membrane in order to keep it tightly pressed against the sample and cap surfaces.
The gas flow rates are controlled by two mass flow meters/con-trollers. The change in the gas composition at the entrance face of the sample is achieved manually by a four-way valve. The gases at the outlet of the sample are collected by the bottom cap, filtered for particles, and sent to a thermal conductivity detector (TCD) to measure the concentration.
The mass flow meters are calibrated using a soap bubble flow meter. A TCD calibration curve is established using the two mass flow meters by imposing alternatively eight gas mixtures – with different fractions of the two gases – at a constant total volume flow rate. A calibration curve with a standard deviation r2better than 0.999 is typically obtained. The sample inlet and outlet pres-sures P1and P2are measured using water column manometers.
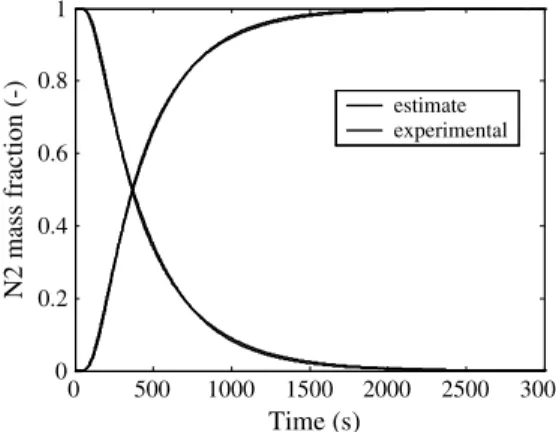
The gas pairs used in the experiments were either N2–He or N2– Ar, because they were suitable for the two detectors at our dis-posal. The three gases were also chosen because they have no physical interaction with the samples. This was attested by the very accurate prediction of the experimental response by the numerical model, and by the fact that the response to transitions Gas 1 ? Gas 2 and Gas 2 ? Gas 1 were symmetrical. This is illus-trated inFig. 2, where Gas 1 was N2and Gas 2 was He.
2.2. Parameter determination
The chosen geometry and boundary conditions are suitable for obtaining a 1D solution provided no heterogeneity or anisotropy effects occur. The waste material under consideration is obviously anisotropic, due to the packing of very slim pieces of material. Gi-ven the way the cardboard and PE pieces are packed in the cylin-ders, it is reasonable to assume that the permeability and dispersion tensors’ principal directions are parallel and perpendic-ular to the cylinder axis. Pieces were packed with as much care as possible to ensure homogeneity of the material. As a consequence, the 1D assumption is justified.
1. Porous medium 2. Cell 3. Cap
4. Latex membrane 5. TCD
CA: Compressed air 6.Four way valve 7. Air leak valve
M: Mass flow meter/controller
Fig. 1. General assembly for the experimental device.
0 500 1000 1500 2000 2500 3000 0 0.2 0.4 0.6 0.8 1
Time (s)
N2 mass fraction (-)
estimate experimentalFig. 2. Typical fit between the experimental and modeled responses to inlet gas step during both N2–Ar and Ar–N2transitions in a glass bed.
In this paper, we will assume that double-porosity effects are negligible. This question deserves some analysis. In the remainder of the paper we will not talk about closed porosity, which is not accessible to flow displacement and cannot be seen therefore in our experiments. Open porosity, which we will call simply porosity from now on, corresponds to the accessible porosity within the cardboard pieces, and the ‘‘void” between cardboard and PE parti-cles. This material structure is typical of double-porosity behav-iours, which at the macro-scale may lead to abnormal dispersion effects, i.e., a non-Gaussian elution curve for typical 1D flows. Such phenomena appear as soon as different time-scales for diffusion are at play (Cushman and Ginn, 1993). The main cause in our case is probably the contrast of diffusivity between the intra-particles pores (later termed macroporosity) and the cardboard porosity. However, given the complex geometrical structures of the packed pieces, it is not unthinkable that dead-end macropores may play a role. As discussed detail inAppendix 1, it is not the case for the present mix of cardboard and PE.
The general equations governing the 1D convective/diffusive transport of a binary gas mixture through a porous medium are
o
eq
ot þ oeq
u ox ¼ 0 ð1Þ oeqx
ot þ oeqx
u ox ¼ o oxeq
Deff ox
ox ! " ð2Þe
u ¼ !j
l
op ox ð3Þwhere
e
is the porosity,q
is the fluid density,x
is the mass fraction of Gas 2, t is the time, x is the position, u is the interstitial velocity, Deffis the xx-component of the effective diffusivity tensor,j
is the xx-component of the permeability tensor,l
is the dynamic viscos-ity, and p is the pressure. If dispersion is large, the effective diffusiv-ity in Eq. (2) will have an additional term associated with dispersion. Because of the low gas density and the small column height, gravity is neglected in the momentum equation, Eq. (3). The injection of a gas with a step change in the gas concentration may be represented by the following initial and boundary conditions: umol¼ u0;x
¼x
injðtÞ x ¼ 0 p ¼ p0; Deffox
1 ox ¼ 0 ðconvective conditionÞ x ¼ L pðt ¼ 0; xÞ ¼ piðxÞ;x
ðt ¼ 0; xÞ ¼x
iðxÞ ð4Þwhere L is the column length and umolis the molar average velocity. The condition on the velocity at x = 0 describes more accurately the inlet conditions since this is the volume of injected gas that is controlled. A convective condition is used to describe the outlet concentration (following the work by Danckwerts, 1953). To be representative of a real system, this latter condition requires that the column Péclet number, as expressed by
Pes¼uD0L
eff ð5Þ
is greater than 0.1, as shall be discussed later in this paper. Pure gases were used because increasing the concentration var-iation increases the accuracy when measuring the outlet concen-tration. As a consequence, because our experiments consist in replacing one gas by another, with potentially highly different mo-lar masses, the non-linearity induced by the density, viscosity and diffusion coefficient variations may be considerable. The above equations were solved for different velocities and permeabilities, in the range of parameters expected from the experiment design. It was found that, for a velocity of about 10!3m s!1, and for the N2–He and N2–Ar mixtures, the non-linear effects, mainly due to pressure variations, could be neglected for permeability higher
than 10!13m2(seeAppendix 2for some details on this problem). This means that, under similar conditions, the initial problem may be replaced by a simplified problem corresponding to 1D flow with constant molar density and molar velocity. In this case, the dispersion equation written in terms of molar fraction and molar velocity may be solved independently of Darcy’s equation, and we simply re-write the dispersion equation as
oC otþ u0 oC ox¼ Deff o2C ox2 ð6Þ
where C is the molar fraction of component 2, and where we used the approximation, valid under the above-mentioned conditions, that the molar velocity is equal to u0in the entire porous domain. The interstitial velocity may be computed from the total flow rate, Q, as
u0¼Q
e
A ð7Þwhere A is the area of the sample cross section. The initial condition reads as
Cðx; 0Þ ¼ 0 for x P 0 ð8Þ
It is also often convenient to replace the Dankwerts outlet con-dition by
lim
x!1Cðx; tÞ ¼ 0 for t P 0 ð9Þ
while keeping, of course, the observation of the solution at x = L. In the present experimental device, it was not possible to re-duce the dead volumes – of the ducts and cap grooves – to a neg-ligible value, and the transition from Gas 1 to Gas 2 was found to be slightly different from a pure jump condition at the sample inlet. This was clearly established from an experiment where the sample was removed from the cell and the two caps were put in contact. As a consequence, the direct model for the experiment – called inlet with relaxation model– consists of a numerical integration of Eq.(6)
with a specific description of the sample inlet boundary condition during gas transition. The inlet boundary condition is described by an exponential relaxation as
C
C0¼ expð!t=rÞ ð10Þ
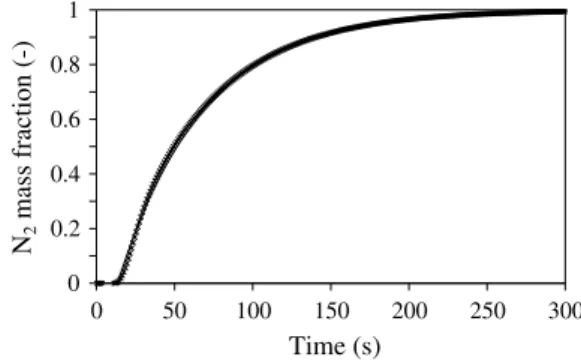
where r was determined by fitting the predictions of Eq.(10)with the experimental response of the empty cell. A typical fit is illus-trated in Fig. 3. A satisfactory description for the inlet boundary condition is obtained for a value of r = 55 s for Q = 45 ml/min, in our case.
Using the inlet with relaxation model, the simultaneous identifi-cation of a single value for porosity and tortuosity factor is possible as will be detailed further.
0 0.2 0.6 0.4 0.8 1 0 50 100 150 200 250 300
Time (s)
N
2mass fraction (-)
Fig. 3. Typical experimental and modeled responses of the experiment in the configuration for the characterization of the dead volumes: (&) experimental transition Ar–N2and (–) modeled transition Ar–N2with r = 55 s.
Permeability was determined from the sample inlet pressure P1 and the outlet pressure P2. Integrating Eq.(3)and using the perfect gas law leads to Eq.(11)
P2 1! P22¼
2
l
RTQmLj
AM ð11Þwhere R is the perfect gas constant, Qmis the gas mass flow rate, M is the molar mass of the gas and T is the temperature. Thus we have
j
¼ 2QmRTLl
AMðP2 1! P22Þ
ð12Þ
2.3. Parameter estimation
The sensitivity curves of the mass fraction of one species in the effluent gas to the two parameters (pi), porosity and tortuosity fac-tor, can be defined as
Spi¼ piopoC
i ð13Þ
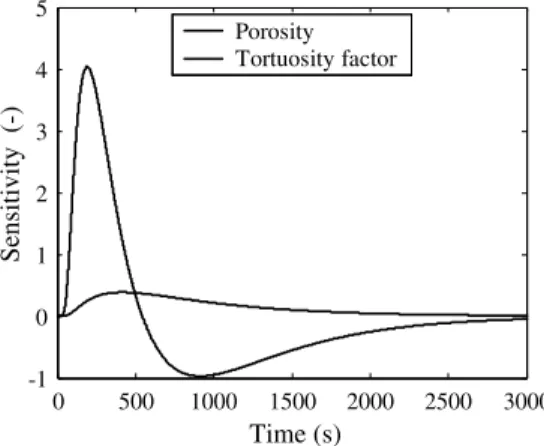
As shown inFig. 4, the sensitivities to the two parameters com-puted from the direct model are not correlated. Therefore, the simultaneous identification of a single value for each parameter is possible.
The parameter identification method used is based on the Nel-der–Mead simplex algorithm. The objective function to be mini-mized, defined in Eq. (14), is the difference between the experimental effluent concentration response curve and the mod-el-predicted response curve
OF ¼1iX i C C0 ! " exp! C C0 ! "!2 ð14Þ where C C0 # $
exp is the experimental gas fraction, C C0
# $
is the model-predicted gas fraction and i is the number of points. For the first iteration, porosity and tortuosity factor (
s
) are initialized to typical values.The error on the values of
e
ands
due to the identification pro-cedure itself was estimated as follows. A numerical experiment was first built running the direct model with given values fore
ands
. The value of each experimental parameter – the length of the sample, the diameter of the sample, the gas flow rate and the detector quantification – were then varied one by one and new val-ues fore
ands
were determined each time by re-identification. The deviations obtained by varying each experimental parameter with-in its uncertawith-inty range were fwith-inally added together, leadwith-ing to the estimation error. The values obtained are near 0.01% fore
and 1% fors
. Moreover, if the initial values fore
ands
are changed – evendrastically – the change in the identified parameters are 10!4% for
e
and 10!3% fors
. These results attest that the identification proce-dure itself does not introduce a significant error in the determina-tion ofe
ands
.2.4. Precautions regarding experimental conditions
There are a number of non-trivial conditions to be satisfied in order to make the experiments reliable and accurate.
First, the macro-scale diffusive effects, which we want to char-acterize, should not be negligible as compared with convective ef-fects. This is obtained by imposing a constraint on the maximum value for the macro-scale Péclet number Pes. However, to avoid ret-ro-diffusion in the cell end (Danckwerts, 1953), Pes should be greater than 0.1. Given these two requirements, we kept the macro-scale Péclet number Pesat a value close to unity.
We verified that this constraint is also coherent with the fact that we are interested in effective diffusion and not dispersion. This requires that the pore-scale Péclet number is maintained low-er than 1 (Bear, 1972, among many others). If we define the pore-scale Péclet number as
Pep¼Dudp
mol ð15Þ
where dpis the pore diameter and Dmolis the molecular gas diffu-sion. The Pepvalue is indeed normally much lower than Pesgiven the fact that
– dp' L, by 2 to 3 orders of magnitude (it is difficult to define pre-cisely the pore diameter for our peculiar material),
– Dmolis only greater than Deffby an order of magnitude maxi-mum for the type of material considered in this study.
Therefore, if Pes(1, Pep' 1, and this allows us to conclude that dispersion effects should be negligible in our experiments. For con-venience, we will express the effective diffusion coefficient as Eq.
(17)(Epstein, 1989)
Deff¼Dmol
s
ð16ÞA final experimental constraint has to be considered. A propa-gating horizontal front separating two fluids can be subjected to viscous and gravity induced instabilities. At some flow regimes, and depending on the properties of the two fluids (density and vis-cosity) and that of the porous medium (permeability), fingering of one fluid into the other might appear. If this happens, the propaga-tion of the front cannot be described by the 1D equapropaga-tion (Eq.(6)). The vertical flow stability in a porous medium has been extensively studied, e.g.,Stevenson et al. (2004). In the case of gases – charac-terized by a large diffusion coefficient compared to liquids – it may be inferred fromQuintard et al. (1987)that the front stability prob-lems are minimized because of the small differences between the densities and viscosities of the two fluids, and because of the stabi-lizing effectof a large diffusion coefficient. Therefore, we believe that our measurements were not affected by dynamic fluid insta-bilities. The results of the validation tests using glass spheres are provided inAppendix 3, and they provide confidence in the results with the test materials.
3. Materials and experimental conditions
The cardboard PE samples that were characterized were those used in the combustion tests described inSalvador et al. (2004). They consist of cylinders of 100 mm diameter and 100 mm height. The size of the cardboard and PE pieces packed in the cylinders was controlled using a blade grinder fitted with a perforated grid at its
0 500 1000 1500 2000 2500 3000 -1 0 1 2 3 4 5
Sensitivity (-)
Porosity Tortuosity factorTime (s)
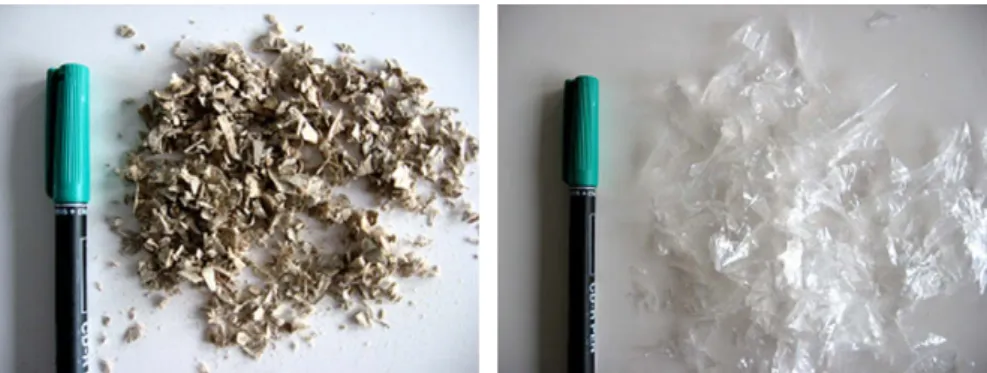
bottom. The diameter of the grid holes was varied to be alterna-tively 8, 20 or 40 mm. The elementary materials used were origi-nally a sheet or a film shape. The grinding resulted in the shredded aspect illustrated inFig. 5. Consequently, a well-defined particle size cannot be introduced for these samples.
Cardboard and PE were ground separately. Two weighed quan-tities of each material were mixed to reach controlled mass frac-tions of each material and final density. Mixing was carried out by hand.
Compaction was obtained inside a cylinder fitted with two pis-tons that were moved simultaneously along the axis. This leads to relatively good homogeneity in the brick density. The compaction pressure required to prepare samples at densities of 500 and 900 kg m!3 can be estimated at 2 MPa and as much as 50 MPa, respectively.
After compaction, the brick is extruded from the cylinder using a long piston, and forced inside a steel belt. A stainless-steel grid (2 mm diameter wire and 20 mm opening) was placed
on each flat surface of the sample (Fig. 6). This packaging was nec-essary to ensure a stable density of the brick during storage and experiments (Salvador et al., 2004). The bulk densities were calcu-lated using the final sample height, after an eventual small decom-pression.Table 1summarizes the properties of the samples used in the experiments.
A value for the pore diameter was required later to calculate Pep. For the glass bed, the pore diameter is correlated to the particle diameter, and we use this latter well-defined dimension as the characteristic length. As regards the compacted cardboard and PE samples, an estimation of the pore diameter was obtained using the bed permeability value and following the Cozeny–Carman equation: dp¼ ffiffiffiffiffiffiffiffiffiffiffiffiffiffiffiffiffiffiffiffiffiffiffi B
j
ð1 !e
Þ2e
3 s ð17Þin which the value B = 180 – established for spherical particles – was used as the Cozeny constant. The estimated size of the pores ranged from 27 to 57
l
m depending on the preparation.4. Results and discussion
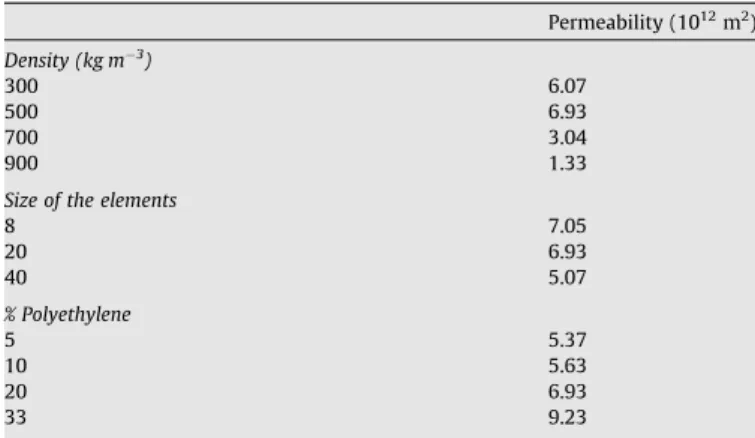
The preparation parameters were varied one at a time. The ‘‘central” values were 500 kg m!3for the density, 20 mm for the size of the elements, and 20% PE for the composition. All the results are grouped together inTable 2for porosity,Table 3for tortuosity factor andTable 4for permeability. Evaluation and estimation of uncertainty is discussed inAppendix 4.
4.1. Effect of bulk density
A plot of the evolution of
e
,s
andj
with the bulk density of the sample is given inFig. 7. The uncertainty of the values plotted in the figure was determined as discussed inAppendix 4. The porosity decreases linearly with increasing densities (or compaction), as Fig. 5. Photographs of the ground elements of cardboard and of polyethylene. The length of the cap on the pen is 42 mm.Fig. 6. Photograph of the bricks composed of cardboard and polyethylene ground elements.
Table 1
Samples composition and properties and estimation of experimental Péclet number
Materials Particle size (mm) % Polyethylene Bulk density (kg m!3) Pe
p Pes
Glass bed 1.6 0 2533.8 0.021 1.26
Compacted cardboard and polyethylene 8 20 500 1.13 & 10!4 0.26
20 5 500 0.89 & 10!4 0.25 10 500 0.92 & 10!4 0.25 20 300 0.63 & 10!4 0.23 20 500 1.15 & 10!4 0.26 20 700 1.51 & 10!4 0.33 20 900 1.86 & 10!4 0.41 33 500 1.58 & 10!4 0.28 40 20 500 1.01 & 10!4 0.26
expected. The measured values are very close to the value calcu-lated from the densities method as reported before.
The tortuosity factor result is quite surprising since it is nor-mally observed to decreases with the degree of compression (Golin et al., 1992).
One possible explanation can arise because there are two types of porosity: porosity of the cardboard itself and porosity of the bed (PE is a non-porous material). It is therefore likely that gas trans-port in this system was ensured in two ways:
– gas flow in the porosity of the bed, i.e., in the empty space between cardboard and PE pieces;
– gas flow through the cardboard elements themselves.
Since the majority of the bed porosity has disappeared, one can expect that the second mechanism has become predominant, i.e., the gas is forced through the porous cardboard pieces. However, it is not clear for which conditions and geometry this would lead to the type of behavior we have observed. This explanation should also lead to a sensitivity of the transport parameters to the mix composition, which is not clearly observed as we shall report later. Previous computations of effective diffusion coefficients for 3D packings have shown that the tortuosity factor may be very sensi-tive to the spatial organization of the particles (Quintard, 1993). Because of our lack of knowledge about the real pore-scale struc-ture of such materials, it is impossible to go beyond conjecstruc-tures.
Another possible explanation lies in the fact that, even if the pore-scale Péclet number seems to be small, justifying the idea that we are in a diffusive regime, it is possible that some regions of the cylinder are affected by dispersion. This would lead to a smaller apparent tortuosity factor. One may imagine that compac-tion increases these effects. Once again, it is difficult to go beyond these hypotheses in the absence of structural information. At high compaction rates, the permeability goes down to values which are closer to the roughly estimate threshold of about 10!13m2that al-lows simplification of the general transport equation into the sim-ple diffusion equation used for identification (seeAppendix 2). It is therefore possible that some non-linear effects begin to play a role at the high compaction rates.
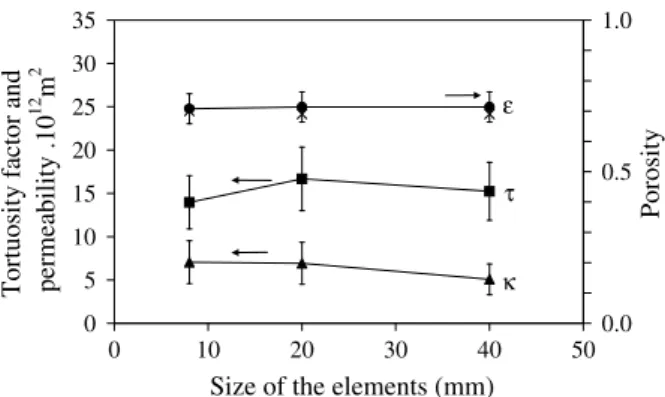
4.2. Effect of the size of the elements
The impact of changing the size of the elements entering the composition of the medium can be analyzed fromFig. 8. A fairly constant porosity is found, as expected, since the shredded pieces remain similar in intrinsic properties whatever their size. These re-sults attest to the good quality of the sample preparation protocol. The tortuosity factor also appears to remain constant at a value around 15. This can be explained by the fact that the pore-scale geometry remains similar, and the effective diffusivity does not de-pend on the characteristic length (Carbonell and Whitaker, 1984; Quintard, 1993; Quintard and Whitaker, 1993). Permeability shows a small decrease when increasing the element size. It is
Table 2
Values for the sample porosity with different elaboration parameters, determined from parameter identification
N2–He He–N2 Average Difference (%)
Density (kg m!3)
300 0.825 0.820 0.822 ±0.3
500 0.707 0.720 0.714 ±0.9
700 0.590 0.577 0.5833 ±1.1
900 0.477 0.483 0.480 ±0.6
Size of the elements
8 0.707 0.709 0.708 ±0.1 20 0.707 0.720 0.714 ±0.9 40 0.716 0.712 0.714 ±0.3 % Polyethylene 5 0.736 0.720 0.728 ±1.1 10 0.710 0.730 0.720 ±1.4 20 0.707 0.720 0.714 ±0.9 33 0.683 0.690 0.687 ±0.5
When not specified, the density is 500 kg m!3, the size of the elements is 20 mm
and the percentage of PE is 20%.
Table 3
Values for the sample tortuosity factor with different elaboration parameters, determined from parameter identification
N2–He He–N2 Average Difference (%)
Density (kg m!3)
300 14.4 14.3 14.4 ±0.3
500 17.1 16.3 16.7 ±2.4
700 11.0 11.6 11.3 ±2.7
900 5.6 5.4 5.5 ±1.6
Size of the elements
8 14.0 14.0 14.0 ±0.1 20 17.1 16.3 16.7 ±2.4 40 15.9 14.6 15.2 ±4.2 % Polyethylene 5 13.0 13 13 ±0.1 10 14.3 14.3 14.3 ±0.04 20 17.1 16.3 16.7 ±2.4 33 14.3 12.9 13.6 ±5.0
When not specified, the density is 500 kg m!3, the size of the elements is 20 mm
and the percentage of PE is 20%.
Table 4
Values for the sample permeability (m2) with different elaboration parameters
Permeability (1012m2) Density (kg m!3) 300 6.07 500 6.93 700 3.04 900 1.33
Size of the elements
8 7.05 20 6.93 40 5.07 % Polyethylene 5 5.37 10 5.63 20 6.93 33 9.23
When not specified, the density is 500 kg m!3, the size of the elements is 20 mm
and the percentage of PE is 20%.
0 5 10 15 20 25 30 35 0 200 400 600 800 1000
Apparent density (kg.m
-3)
Tortuosity factor and
permeability .10
12
m
2 0.0 0.5 1.0Porosit
y
τ κ εFig. 7. Evolution of porosity, tortuosity factor and permeability versus the medium bulk density: (d) porosity; (j) tortuosity factor; (N) permeability; and (&) porosity value from density method.
well-known that permeability scales as the square of a pore-scale characteristic length (Quintard and Whitaker, 1993); however, it is difficult to find the relevant characteristic length in media of such complexity. Nevertheless, the indicated effect remains very small, and within the experimental uncertainty.
4.3. Effect of the percentage of PE
Results with various percentages of the non-porous material (PE) are reported inFig. 9. When the percentage of PE increases, the porosity decreases linearly. The measured values are very close to the values estimated from the densities method.
The tortuosity factor first increases when the percentage of PE is increased. This result can be explained intuitively by the fact that adding a non-porous material will make the flow more tortuous since the fluid can cross through the elements themselves less and less easily. When the percentage of PE is increased from 20% to 30%, a slight decrease in the tortuosity factor from 16.7 down to 13 is observed, but the values remain in the error range. It is dif-ficult at this stage to propose a physical explanation for this behavior.
Surprisingly, permeability appears to increase monotonically when the percentage of PE increases. The interpretation of this re-sult would require considering the actual shape of the elements in-side the sample, which is difficult to determine.
4.4. Impact of gas velocity on the determined properties
Tortuosity has been defined in the case of pure diffusion, and is, therefore, not dependent upon velocity. However, if some
disper-sion effects are present, the value can be affected by the velocity of the gas tracer. More precisely, it should depend on the Péclet number, Pes. If the experimental conditions enter the dispersive re-gime, this would result in a greater measured tortuosity factor.
To investigate the potential for this impact, experiments were carried out on our reference sample (500 kg m!3, 20 mm elements and 20% PE) using a gas injection velocity of half and then twice the velocity used in all previous experiments. The values, obtained for three Péclet numbers (Pes= 5.73 & 10!5, 1.14 & 10!4 and 2.12 & 10!4), are represented inFig. 10. The determined porosity is almost unaffected by the change in Pes, which is the expected re-sult since this property is not flow dependent. In contrast, the determined value for the tortuosity factor varies from 18 at the lower Pesto less than 8 at the higher Pes. Nevertheless, regarding the large uncertainty in the values for this parameter, it is possible to trace a horizontal line within the error bars for the three values. If the differences were significant, this would probably mean that some dispersion mechanisms are occurring. The estimated pore-scale Péclet number being small, this would need some further analysis. One possible explanation is that the pore geometry is very heterogeneous (shape, length), thus leading to dispersion mecha-nisms in some places and diffusive regimes in other places. Once again, it seems very difficult to obtain enough pore-scale informa-tion for such materials to discuss these findings further.
5. Conclusion
In this paper, we presented an attempt to measure transport properties of complex porous media typical of waste material. An experimental setup based on the output response of a cylindrical porous sample submitted to a gas inlet step change allowed us to obtain estimates of various transport properties, such as porosity, tortuosity and permeability. The results show a very different behavior of these materials when compared, for instance, to packed beds results. In particular, the impact of the structural properties does not seem to be classical. It is well-known that intrinsic permeability and tortuosity are directly dependent upon the geometry. Porosity and tortuosity do not change for similar structures, while permeability changes with the square of a charac-teristic length. The only characcharac-teristic length at hand is the size of the sheet pieces. Our results show no influence of this size in the studied range. This tells that this is not the length that character-izes the flow pattern within the material. It would be interesting to investigate the material structural properties, perhaps with X-ray tomography, and relate them to the transport properties. Once these data are available, it would be interesting to try to relate the resulting effective properties to a minimal set of geometric charac-teristics. Given the mechanical behavior of such packings, the
0 5 10 15 20 25 30 35 0 10 20 30 40 50
Size of the elements (mm)
Tortuosity factor and
permeability .10
12
m
2 0.0 0.5 1.0Porosit
y
τ κ εFig. 8. Evolution of porosity, tortuosity factor and permeability versus the size of the elements: (d) porosity; (j) tortuosity factor; (N) permeability; and (&) porosity value from density method.
0 5 10 15 20 25 30 35 0 10 20 30 40
% of polyethlene
Tortusity factor and
Permeability .10
12
m
2 0.0 0.5 1.0Porosity
τ κ εFig. 9. Evolution of porosity, tortuosity factor and permeability versus the percentage of PE inside the medium: (d) porosity; (j) tortuosity factor; (N) permeability; and (&) porosity value from density method.
0 0.5 1
0.0E+00 5.0E-05 1.0E-04 1.5E-04 2.0E-04 2.5E-04
Pe
pPorosity
0 5 10 15 20 25 30 35Tortuosit
y factor
τ εFig. 10. Values for porosity and tortuosity factor of the medium at 500 kg m!3bulk
density, 20 mm element size and 20% PE, determined using three different values of the Péclet number.
study should also focus on the impact of compression on the evo-lution of the structure.
The results for diffusion/dispersion do not show a clear influ-ence of the average velocity, given the accuracy of the measure-ments. It would be interesting to investigate more thoroughly this aspect. The same experimental setup could be used to measure the apparent longitudinal dispersion coefficient, provided that the length is augmented to work with higher Péclet numbers. The first question would be how to correctly define the Péclet number, since we know from the other results that the size of the pieces is not really relevant. If the 3D pore-scale structure is available from tomography measurements, the upscaling theories could be used to calculate the dispersion coefficient, thus giving some idea of the resulting dispersion tensor, which is difficult to obtain experimentally.
Appendix A. Supplementary material
Supplementary data associated with this article can be found, in the online version, atdoi:10.1016/j.wasman.2008.09.002. References
Bear, J., 1972. Dynamic of Fluids in Porous Media. American Elsevier Publishing Company Inc., New York, London, Amsterdam.
Carbonell, R.G., Whitaker, S., 1984. Heat and mass transfer in porous media. In: Bear, J., Corapcioglu, M.Y. (Eds.), Fundamentals of Transport Phenomena in Porous Media. Martinus Nijhof Publication, pp. 121–198.
Cushman, J.H., Ginn, T.R., 1993. Nonlocal dispersion in media with continuously evolving scales of heterogeneity. Transport in Porous Media 13, 123–138. Currie, J.A., 1960. Gaseous diffusion in porous media – part 1. A non steady state
method. British Journal of Applied Physics 11, 314–317.
Danckwerts, P.V., 1953. Continuous flow systems. Distribution of residence times. Chemical Engineering Science 2, 1–13.
Dogu, G., Smith, J.M., 1975. A dynamic method for catalyst diffusivities. AIChE Journal 21, 58–61.
Epstein, N., 1989. On tortuosity and the tortuosity factor in flow and diffusion through porous media. Chemical Engineering Science 44, 777–779.
Golin, Y.L., Karyakin, V.E., Pospelov, B.S., Seredkin, V.I., 1992. Pore tortuosity estimates in porous media. Urals Electrochemical Complex, Sverdlovsk. Translated from Electrokhimiya 28, 109–113.
Hassler, G.L., 1942. Method and apparatus for permeability measurements. Serial No. 437 788 United States Patent Office, Berkley, California, Shell Development Company, San Francisco, California, A Corporation of Delware.
Kim, J.H., Ochoa, J.A., Whitaker, S., 1987. Diffusion in anisotropic porous media. Transport in Porous Media 2, 327–356.
Quintard, M., Bertin, H., Prouvost, L., 1987. Criteria for the stability of miscible displacement through porous columns. Chemie Ingenieur Technik 59, 354–355. Quintard, M., 1993. Diffusion in isotropic and anisotropic porous systems:
three-dimensional calculations. Transport in Porous Media 11, 187–199.
Quintard, M., Whitaker, S., 1993. Transport in ordered and disordered porous media: volume averaged equations, closure problems, and comparison with experiment. Chemical Engineering Science 48, 2537–2564.
Salvador, S., Quintard, M., David, C., 2004. Combustion of a substitution fuel made of cardboard and polyethylene: influence of the mix characteristics-experimental approach. Fuel 83, 451–462.
Stevenson, K., Bromhal, G.S., Ferer, M., Wilder, J., Smith, D.H., 2004. Miscible, vertical network model 2-D simulations of two-phase flow displacements in porous media. Physica A 343, 317–334.
Perkins, T.K., Johnston, O.C., 1963. A review of diffusion and dispersion in porous media. Society of Petrol Engineering Journal 3, 70–84.
Wicke, E., Kallenbach, R., 1941. Die Oberflächendiffusion von Kohlendioxid in aktiven Kohlen. Kolloidnyi Zhurnal 2, 135–151.
![[PDF] Introduction au POO en C formation generale - Cours langage c](data:image/gif;base64,R0lGODlhAQABAIAAAP///wAAACH5BAEAAAAALAAAAAABAAEAAAICRAEAOw==)