Publisher’s version / Version de l'éditeur:
Vous avez des questions? Nous pouvons vous aider. Pour communiquer directement avec un auteur, consultez la première page de la revue dans laquelle son article a été publié afin de trouver ses coordonnées. Si vous n’arrivez pas à les repérer, communiquez avec nous à [email protected].
Questions? Contact the NRC Publications Archive team at
[email protected]. If you wish to email the authors directly, please see the first page of the publication for their contact information.
https://publications-cnrc.canada.ca/fra/droits
L’accès à ce site Web et l’utilisation de son contenu sont assujettis aux conditions présentées dans le site LISEZ CES CONDITIONS ATTENTIVEMENT AVANT D’UTILISER CE SITE WEB.
Eleventh International Conference on Language Resources and Evaluation, pp.
198-209, 2018-05-12
READ THESE TERMS AND CONDITIONS CAREFULLY BEFORE USING THIS WEBSITE. https://nrc-publications.canada.ca/eng/copyright
NRC Publications Archive Record / Notice des Archives des publications du CNRC :
https://nrc-publications.canada.ca/eng/view/object/?id=2c21fb84-2b97-44b0-a698-4f4e93d8ee93
https://publications-cnrc.canada.ca/fra/voir/objet/?id=2c21fb84-2b97-44b0-a698-4f4e93d8ee93
NRC Publications Archive
Archives des publications du CNRC
This publication could be one of several versions: author’s original, accepted manuscript or the publisher’s version. / La version de cette publication peut être l’une des suivantes : la version prépublication de l’auteur, la version acceptée du manuscrit ou la version de l’éditeur.
Access and use of this website and the material on it are subject to the Terms and Conditions set forth at
Understanding emotions: a dataset of tweets to study interactions
between affect categories
Understanding Emotions:
A Dataset of Tweets to Study Interactions between Affect Categories
Saif M. Mohammad and Svetlana Kiritchenko
National Research Council Canada{saif.mohammad,svetlana.kiritchenko}@nrc-cnrc.gc.ca Abstract
Human emotions are complex and nuanced. Yet, an overwhelming majority of the work in automatically detecting emotions from text has focused only on classifying text into positive, negative, and neutral classes, and a much smaller amount on classifying text into basic emotion categories such as joy, sadness, and fear. Our goal is to create a single textual dataset that is annotated for many emotion (or affect) dimensions (from both the basic emotion model and the VAD model). For each emotion dimension, we annotate the data for not just coarse classes (such as anger or no anger) but also for fine-grained real-valued scores indicating the intensity of emotion (anger, sadness, valence, etc.). We use Best–Worst Scaling (BWS) to address the limitations of traditional rating scale methods such as inter-and intra-annotator inconsistency by employing comparative annotations. We show that the fine-grained intensity scores thus obtained are reliable (repeat annotations lead to similar scores). We choose Twitter as the source of the textual data we annotate because tweets are self-contained, widely used, public posts, and tend to be rich in emotions. The new dataset is useful for training and testing supervised machine learning algorithms for multi-label emotion classification, emotion intensity regression, detecting valence, detecting ordinal class of intensity of emotion (slightly sad, very angry, etc.), and detecting ordinal class of valence (or sentiment). We make the data available for the recent SemEval-2018 Task 1: Affect in Tweets, which explores these five tasks. The dataset also sheds light on crucial research questions such as: which emotions often present together in tweets?; how do the intensities of the three negative emotions relate to each other?; and how do the intensities of the basic emotions relate to valence?
Keywords: emotion intensity, valence, arousal, dominance, basic emotions, crowdsourcing, sentiment analysis
1.
Introduction
Emotions are central to how we perceive the world, how we make sense of it, and how we make day-to-day de-cisions. Emotions are also complex and nuanced. Even though humans are known to perceive hundreds of differ-ent emotions, there is still little agreemdiffer-ent on how best to categorize and represent emotions. According to the basic emotion model (aka the categorical model) (Ekman, 1992; Plutchik, 1980; Parrot, 2001; Frijda, 1988), some emotions, such as joy, sadness, fear, etc., are more basic than others, and that these emotions are each to be treated as separate categories. Each of these emotions can be felt or expressed in varying intensities. Here, intensity refers to the degree or amount of an emotion such as anger or sadness.1As per the
valence–arousal–dominance (VAD) model (Russell, 2003), emotions are points in a three-dimensional space of valence (positiveness–negativeness), arousal (active–passive), and dominance (dominant–submissive).
Both the categorical model and the dimensional model of emotions have a large body of work supporting them, and offer different perspectives that help our understanding of emotions. However, there is very little work relating the two models of emotion with each other. Much of the past work on textual utterances such as sentences and tweets, is based on exactly one or the other model (not both).2 For example, corpora annotated for emotions are either anno-tated only for the basic emotions (Mohammad and Bravo-Marquez, 2017b; Strapparava and Mihalcea, 2007; Alm et al., 2005) or only for valence, arousal, and dominance (Yu et al., ; Mohammad et al., 2017; Nakov et al., 2016).
1
Intensity is different from arousal, which refers to the extent to which an emotion is calming or exciting.
2
There is some work on words that are annotated both for as-sociation to basic emotions as well as for valence, arousal, and dominance (Mohammad, 2018).
Within Natural Language Processing, an overwhelming majority of the work has focused on classifying text into positive, negative, and neutral classes (valence classifica-tion), and a much smaller amount on classifying text into basic emotion categories such as joy, sadness, and fear. A key obstacle in developing algorithms for other emotion-related tasks, especially those involving fine-grained inten-sity scores, is the lack of large reliably labeled datasets.
The goal of this work is to create, for the first time, a large single textual dataset annotated for many emotion (or affect) dimensions (from both the basic emotion model and the VAD model). Specifically, we annotate tweets for the emotions of people that posted the tweets—emotions that can be inferred solely from the text of the tweet. For each emotion dimension, we annotate the data for not just coarse classes (such as anger or no anger) but also for fine-grained real-valued scores indicating the intensity of emo-tion (anger, sadness, valence, etc.). The datasets can be used to train many different kinds of emotion analysis sys-tems. Further, as (Mohammad and Bravo-Marquez, 2017a) showed, correlations across emotions means that training data for one emotion can be used to supplement training data for another emotion. We choose Twitter as the source of the textual data we annotate because tweets are self-contained, widely used, public posts, and tend to be rich in emotions. However, other choices such as weblogs, fo-rum posts, and comments on newspaper articles are also suitable avenues for future work. Similarly, annotating for the emotions of the reader or emotions of those mentioned in the tweets are also suitable avenues for future work.
Mohammad and Bravo-Marquez (2017b) created the first datasets of tweets annotated for anger, fear, joy, and sadness intensities. Given a focus emotion, each tweet is annotated for intensity of the emotion felt by the speaker using a technique called Best–Worst Scaling (BWS).
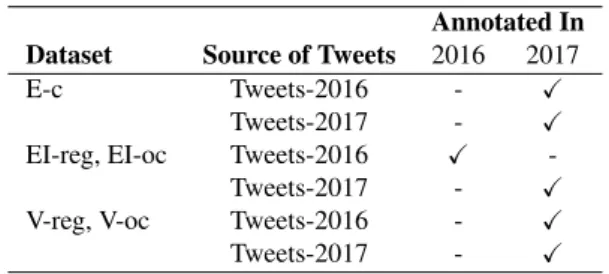
Annotated In Dataset Source of Tweets 2016 2017
E-c Tweets-2016 - X
Tweets-2017 - X
EI-reg, EI-oc Tweets-2016 X
-Tweets-2017 - X
V-reg, V-oc Tweets-2016 - X
Tweets-2017 - X
Table 1: The data and annotations in the AIT Dataset.
BWS is an annotation scheme that addresses the lim-itations of traditional rating scale methods, such as inter-and intra-annotator inconsistency, by employing compar-ative annotations (Louviere, 1991; Louviere et al., 2015; Kiritchenko and Mohammad, 2016; Kiritchenko and Mo-hammad, 2017). Annotators are given n items (an n-tuple, where n >1 and commonly n = 4). They are asked which item is the best (highest in terms of the property of inter-est) and which is the worst (lowest in terms of the property of interest). When working on4-tuples, best–worst annota-tions are particularly efficient because each best and worst annotation will reveal the order of five of the six item pairs. For example, for a 4-tuple with items A, B, C, and D, if A is the best, and D is the worst, then A > B, A > C, A > D, B >D, and C > D. Real-valued scores of association between the items and the property of interest can be calculated from the BWS annotations (Orme, 2009; Flynn and Marley, 2014). Mohammad and Bravo-Marquez (2017b) collected and annotated 7,100 tweets posted in 2016. We will refer to the tweets alone as Tweets-2016, and the tweets and annota-tions together as the Emotion Intensity Dataset (or, EmoInt
Dataset). This dataset was later used in the 2017 WASSA Shared Task on Emotion Intensity (EmoInt).3
We build on that earlier work by first compiling a new set of tweets posted in 2017 and annotating the new tweets for emotion intensity in a similar manner. We will refer to this new set of tweets as Tweets-2017. Similar to the work by Mohammad and Bravo-Marquez (2017b), we cre-ate four subsets annotcre-ated for intensity of fear, joy, sadness, and anger, respectively. However, unlike the earlier work, here a common dataset of tweets is annotated for all three negative emotions: fear, anger, and sadness. This allows one to study the relationship between the three basic nega-tive emotions. The full set of tweets along with their emo-tion intensity scores can be used for developing automatic systems that predict emotion intensity (emotion intensity
re-gression, or EI-reg, systems).
We also annotate tweets sampled from each of the four basic emotion subsets (of both 2016 and Tweets-2017) for degree of valence. This data can be used for de-veloping systems that predict sentiment intensity (valence
regression, or V-reg, systems). Annotations for degree of arousal and dominance are ongoing, and will be described in a subsequent paper. We leave the annotations for inten-sity of other basic emotions such as anticipation, disgust, and surprise for future work.
In addition to knowing a fine-grained score indicating degree of intensity, it is also useful to qualitatively ground
3http://saifmohammad.com/WebPages/EmoInt2017.html
the information on whether the intensity is high, medium, low, etc. Thus we manually identify ranges in intensity scores that correspond to these coarse classes. For each of the four emotions E, the 0 to 1 range is partitioned into the classes: no E can be inferred, low E can be inferred,
moderate E can be inferred, and high E can be inferred. This data can be used for developing systems that predict the ordinal class of emotion intensity (EI ordinal
classifica-tion, or EI-oc, systems). Since valence is a bi-polar scale, we partition the 0 to 1 range into: very negative, moderately
negative, slightly negative, neutral or mixed, slightly posi-tive, moderately posiposi-tive,and very positive mental state of
the tweeter can be inferred. This data can be used to de-velop systems that predict the ordinal class of valence
(va-lence ordinal classification, or V-oc, systems).4
Finally, the full Tweets-2016 and Tweets-2017 datasets are annotated for the presence of eleven emotions: anger, anticipation, disgust, fear, joy, love, optimism, pessimism, sadness, surprise, and trust. This data can be used for devel-oping multi-label emotion classification, or E-c, systems.
Table 1 shows the two stages in which the annota-tions were done: in 2016 as described in the work by Mo-hammad and Bravo-Marquez (2017b) and in 2017 as de-scribed in this paper. Together, we well refer to the joint set of tweets from Tweets-2016 and Tweets-2017 along with all the emotion-related annotations described above as the
SemEval-2018 Affect in Tweets Dataset(or AIT Dataset for short), since this data was used to create the training, de-velopment, and test sets in the SemEval-2018 shared task of the same name – SemEval-2018 Task 1: Affect in Tweets shared task (Mohammad et al., 2018).5 The shared task
evaluates automatic systems for EI-reg, EI-oc, V-reg, V-oc, and E-c in three languages: English, Arabic, and Spanish.
We show that the intensity annotations in the AIT dataset have a high split-half reliability (between 0.82 and 0.92), indicating a high quality of annotation. (Split half reliability measures the average correlation between scores produced by two halves of the annotations—higher correla-tions indicate stable and consistent outputs.) The annotator agreement on the multi-label emotion annotations (E-c) is also well above the random agreement.
We show that certain pairs of emotions often present together in tweets. For example, the presence of anger is strongly associated with the presence of disgust, the presence of optimism is strongly associated with the pres-ence of joy, etc. For some pairs of emotions (e.g., anger and disgust), this association is present in both directions, while for other pairs (e.g., love and joy), the association is markedly stronger in only one direction. We calculate the extent to which the intensities of affect dimensions corre-late. Amongst anger, fear, and sadness the correlations are close to zero. Finally, we identify the tweets for which two affect scores correlate and the tweets for which they do not.
4Note that valence ordinal classification is the traditional
sen-timent analysis task most commonly explored in NLP literature. The classes may vary from just three (positive, negative, and neu-tral) to five, seven, or nine finer classes.
5
2.
The Affect in Tweets Dataset
We now present how we created the Affect in Tweets Dataset. For simplicity, we will describe the procedure as if all the tweets were collected at the same time. However, as stated earlier in the introduction, some tweets were col-lected in 2016 (part of the EmoInt dataset).2.1.
Compiling Tweets
We first compiled tweets to be included in the four EI-reg datasets corresponding to the four basic emotions: anger, fear, joy, and sadness. The EI-oc datasets include the same tweets as in EI-reg, that is, the Anger EI-oc dataset has the same tweets as in the Anger EI-reg dataset, the Fear EI-oc dataset has the same tweets as in the Fear EI-reg dataset, and so on. However, the labels for EI-oc tweets are ordinal classes instead of real-valued intensity scores. The V-reg dataset includes a subset of tweets from each of the four EI-reg emotion datasets. The V-oc dataset has the same tweets as in the V-reg dataset. The E-c dataset includes all the tweets from the four EI-reg datasets. The total number of instances in the E-c, EI-reg, EI-oc, V-reg, and V-oc is shown in the last column of Table 5.
2.1.1. Basic Emotion Tweets
For each of the four basic emotions, our goal was to create a dataset of tweets such that:
• The tweets are associated with various intensities (or degrees) of emotion.
• Some tweets have words clearly indicative of the basic emotion and some tweets do not.
A random collection of tweets is likely to have a large pro-portion of tweets not associated with the focus emotion, and thus annotating all of them for intensity of emotion is sub-optimal. To create a dataset of tweets rich in a particular emotion, we used the following methodology. For each emotion X, we selected 50 to 100 terms that were asso-ciated with that emotion at different intensity levels. For example, for the anger dataset, we used the terms: angry,
mad, frustrated, annoyed, peeved, irritated, miffed, fury, antagonism, and so on. For the sadness dataset, we used the terms: sad, devastated, sullen, down, crying, dejected,
heartbroken, grief, weeping, and so on. We will refer to these terms as the query terms.
We identified the query terms for an emotion using many different ways to improve the overall diversity of the collected tweets:
• We looked up the Roget’s Thesaurus to find categories that had the focus emotion word (or a close synonym) as the head word.6 We chose all words listed within these
categories to be the query terms for the corresponding focus emotion.
• We looked up a table of commonly used emojis to iden-tify emojis associated with the four emotions.
6
The Roget’s Thesaurus groups words into about 1000 cate-gories. The head word is the word that best represents the mean-ing of the words within the category. The categories chosen were: 900 Resentment (for anger), 860 Fear (for fear), 836 Cheerfulness (for joy), and 837 Dejection (for sadness).
• We identified simple emoticons such as ’:)’, ’:(’, and ’:D’ that are indicative of happiness and sadness. • We identified synonyms of the four emotions in a
word-embeddings space created from 11 million tweets with emoticons and emotion-word hashtags using word2vec (Mikolov et al., 2013).
The full list of query terms is made available on the SemEval-2018 Task 1 website.
We polled the Twitter API, over the span of two months (June and July, 2017), for tweets that included the query terms. We collected more than sixty million tweets. We discarded re-tweets (tweets that start with RT) and tweets with URLs. We created a subset of the remaining tweets by: • selecting at most 50 tweets per query term;
• selecting at most one tweet for every tweeter–query term combination.
This resulted in tweet sets that are not heavily skewed to-wards any one tweeter or query term.
We randomly selected 1400 tweets from the joy set for annotation of intensity of joy. For the three negative emo-tions, we first randomly selected 200 tweets each from their corresponding tweet collections. These 600 tweets were annotated for all three negative emotions so that we could study the relationships between fear and anger, between anger and sadness, and between sadness and fear. For each of the negative emotions, we also chose 800 additional tweets, from their corresponding tweet sets, that were anno-tated only for the corresponding emotion. Thus, the number of tweets annotated for each of the negative emotions was also 1400 (600 common to the three negative emotions + 800 unique to the focus emotion). In 100 randomly chosen tweets from each emotion set (joy, anger, fear, and sadness), we removed the trailing query term (emotion-word hashtag, emoticon, or emoji) so that our dataset also includes some tweets with no clearly emotion-indicative terms.
Thus, the EI-reg dataset included 1400 new tweets for each of the four emotions. These were annotated for in-tensity of emotion. Note that the EmoInt dataset already included 1500 to 2300 tweets per emotion annotated for intensity. Those tweets were not re-annotated. The EmoInt EI-reg tweets as well as the new EI-reg tweets were both an-notated for ordinal classes of emotion (EI-oc) as described in Section 2.2.3.
The new EI-reg tweets formed the EI-reg development (dev) and test sets in the AIT task; the number of instances in each is shown in the third and fourth columns of Table 5. The EmoInt tweets formed the training set. Manual exam-ination of the new EI-reg tweets later revealed that it in-cluded some near-duplicate tweets. We kept only one copy of such pairs and discarded the other tweet. Thus the dev. and test set numbers add up to a little lower than 1400. 2.1.2. Valence, Arousal, and Dominance Tweets Our eventual goal is to study how valence, arousal, and dominance (VAD) are related to joy, fear, sadness, and anger intensity. Thus, we created a single common dataset to be annotated for valence, arousal, and dominance, such that it includes tweets from the EI-reg datasets as described below. Specifically, the VAD annotation dataset of 2600 tweets included:
• From the new EI-reg tweets:
– all 600 common negative emotion tweets, – 600 randomly chosen joy tweets,
• From EmoInt EI-reg tweets: – 600 randomly chosen joy tweets,
– 200 each, randomly chosen tweets, for anger, fear, and sadness.
To study valence in sarcastic tweets, we also included 200 tweets that had hashtags #sarcastic, #sarcasm, #irony, or #ironic (tweets that are likely to be sarcastic). Thus the V-reg set included 2,600 tweets in total. The V-oc set included the same tweets as in the V-reg set.
2.1.3. Multi-Label Emotion Classification Tweets We selected all of the 2016 and 2017 tweets in the four EI-reg datasets to form the E-c dataset, which is annotated for presence or absence of 11 emotions.
2.2.
Annotating Tweets
We annotated all of our data by crowdsourcing. The tweets and annotation questionnaires were uploaded on the crowd-sourcing platform, CrowdFlower.7 All annotators for our tasks had already consented to the CrowdFlower terms of agreement. They chose to do our task among the hundreds available, based on interest and compensation provided. Respondents were free to annotate as many questions as they wished to. All the annotation tasks described in this paper were approved by the National Research Council Canada’s Institutional Review Board, which reviewed the proposed methods to ensure that they were ethical.
About 5% of the tweets in each task were annotated internally beforehand (by the authors). These tweets are re-ferred to as gold tweets. The gold tweets were interspersed with other tweets. If a crowd-worker got a gold tweet ques-tion wrong, they were immediately notified of the error. If the worker’s accuracy on the gold tweet questions fell be-low 70%, they were refused further annotation, and all of their annotations were discarded. This served as a mecha-nism to avoid malicious annotations.
2.2.1. Multi-Label Emotion Annotation
We presented one tweet at a time to the annotators and asked two questions. The first was a single-answer multiple choice question:
Q1. Which of the following options best describes the emotional state of the tweeter?
– anger (also includes annoyance, rage) – anticipation (also includes interest, vigilance) – disgust (also includes disinterest, dislike, loathing) – fear (also includes apprehension, anxiety, terror) – joy (also includes serenity, ecstasy)
– love (also includes affection)
– optimism (also includes hopefulness, confidence) – pessimism (also includes cynicism, no confidence) – sadness (also includes pensiveness, grief) – surprise (also includes distraction, amazement) – trust (also includes acceptance, liking, admiration) – neutral or no emotion
7http://www.crowdflower.com
The second question was a checkbox question, where multiple options could be selected:
Q2. In addition to your response to Q1, which of the following options further describe the emotional state of the tweeter? Select all that apply.
This question included the same first eleven emotion choices, but instead of neutral, the twelfth option was ‘none of the above’. Example tweets were provided in advance with examples of suitable responses.
On the CrowdFlower task settings, we specified that we needed annotations from seven people for each tweet. However, because of the way the gold tweets were setup, they were annotated by more than seven people. The me-dian number of annotations was still seven. In all, 303 peo-ple annotated between 10 and 4,670 tweets each. A total of 87,178 pairs of responses (Q1 and Q2) were obtained (see Table 4).
Annotation Aggregation: We determined the primary emotion for a tweet by simply taking the majority vote from the annotators. In case of ties, all emotions with the ma-jority vote were considered the primary emotions for that tweet. We aggregated the responses from Q1 and Q2 to obtain the full set of labels for a tweet. We wanted to in-clude not just the primary emotion, but all others that apply, even if their presence was more subtle. One of the criti-cisms for several natural language annotation projects has been that they keep only the instances with high agreement, and discard instances that obtain low agreements. The high agreement instances tend to be simple instantiations of the classes of interest, and are easier to model by automatic systems. However, when deployed in the real world, nat-ural language systems have to recognize and process more complex and subtle instantiations of a natural language phe-nomenon. Thus, discarding all but the high agreement in-stances does not facilitate the development of systems that are able to handle the difficult instances appropriately.
Therefore, we chose a somewhat generous aggregation criteria: if more than 25% of the responses (two out of seven people) indicated that a certain emotion applies, then that label was chosen. We will refer to this aggregation as Ag2. If no emotion got at least 40% of the responses (three out of seven people) and more than 50% of the re-sponses indicated that the tweet was neutral, then the tweet was marked as neutral. In the vast majority of the cases, a tweet was labeled either as neutral or with one or more of the eleven emotion labels. 107 tweets did not receive sufficient votes to be labeled a particular emotion or to be labeled neutral. These very-low-agreement tweets were set aside. We will refer to the remaining dataset as E-c (Ag2), or simply E-c, data.
Since we used gold tweets interspersed with other tweets in our annotations, the amount of random or mali-cious annotations was small, identified, and discarded. Fur-ther, annotators had the option of choosing neutral if they did not see any emotion, and had no particular reason to choose an emotion at random. These factors allow us to use a 25% threshold for aggregation without compromis-ing the quality of the data. Manual random spot-checks of the 25%–40% agreement labels by the authors revealed
anger antic. disg. fear joy love optim. pessi. sadn. surp. trust neutral
% votes 23.2 9.8 20.0 11.6 27.8 7.7 16.9 8.2 19.1 5.0 4.8 10.9
Ag2: % tweets labeled 36.1 13.9 36.6 16.8 39.3 12.3 31.3 11.6 29.4 5.2 5.0 2.7
Ag3: % tweets labeled 29.0 4.1 25.4 12.3 33.7 6.5 18.0 3.7 19.7 1.6 0.8 2.9
Table 2: Applicable Emotion: Percentage of votes for each emotion as being applicable (Q1+Q2) and the percentage of tweets that were labeled with a given emotion (after aggregation of votes).
anger antic. disg. fear joy love optim. pessi. sadn. surp. trust neutral
% votes 20.0 5.4 5.7 9.6 24.9 1.6 5.6 1.6 12.1 1.6 1.0 10.9
% tweets labeled 23.8 2.7 3.5 10.5 28.8 0.8 4.8 0.6 12.8 1.1 0.2 10.2
Table 3: Primary Emotion: Percentage of votes for each emotion as being the primary emotion (Q1) and the percentage of tweets that were labeled as having a given primary emotion (after aggregation of votes).
that the annotations are reasonable. Nonetheless, in cer-tain applications, it is useful to train and test the systems on higher-agreement data. Thus, we are releasing a version of the E-c data with 40% as the cutoff (at least 3 out of 7 annotators must indicate that the emotion is present). We will refer to this aggregation as Ag3, and the corresponding dataset as E-c (Ag3). 1,133 tweets did not receive sufficient votes to be labeled a particular emotion or to be labeled neutral when using Ag3. Note that all further analysis in this paper, except that pertaining to Table 2, is on the E-c
(Ag2)data, which we will refer to simply as E-c.
Class Distribution: The first row of Table 2 shows the per-centage of times each emotion was selected (in Q1 or Q2) in the annotations. The second and third rows show the percentage of tweets that were labeled with a given emo-tion using Ag2 and Ag3 for aggregaemo-tion, respectively. The numbers in these rows sum up to more than 100% because a tweet may be labeled with more than one emotion. Ob-serve that joy, anger, disgust, sadness, and optimism get a high number of the votes. Trust and surprise are two of the lowest voted emotions. Also note that with Ag3 the per-centage of instances for many emotions drops below 5%.
The first row of Table 3 shows the percentage of times each emotion was selected as the primary emotion (in Q1). The second row shows the percentage of tweets that were labeled with having a given emotion as the primary emotion (after taking the majority vote). Observe that joy, anger, sadness, and fear are often the primary emotions. Even though optimism was often voted for as an emotion that applied (Table 2), Table 3 indicates that it is predominantly not the primary emotion.
2.2.2. Annotating Intensity with Best–Worst Scaling We followed the procedure described by Kiritchenko and Mohammad (2016) to obtain BWS annotations. For each affect category, the annotators were presented with four tweets at a time (4-tuples) and asked to identify the tweeters that are likely to be experiencing the highest amount of the corresponding affect category (most angry, highest valence, etc.) and the tweeters that are likely to be experiencing the lowest amount of the corresponding affect category (least angry, lowest valence, etc.). 2 × N (where N is the num-ber of tweets in the emotion set) distinct 4-tuples were ran-domly generated in such a manner that each item was seen in eight different 4-tuples, and no pair of items occurred in more than one 4-tuple. We will refer to this procedure
as random maximum-diversity selection (RMDS). RMDS maximizes the number of unique items that each item co-occurs with in the 4-tuples. After BWS annotations, this in turn leads to direct comparative ranking information for the maximum number of pairs of items.
It is desirable for an item to occur in sets of 4-tuples such that the maximum intensities in those 4-tuples are spread across the range from low intensity to high inten-sity, as then the proportion of times an item is chosen as the best is indicative of its intensity score. Similarly, it is desirable for an item to occur in sets of 4-tuples such that the minimum intensities are spread from low to high inten-sity. However, since the intensities of items are not known beforehand, RMDS is used.
Every 4-tuple was annotated by four independent anno-tators.8 The questionnaires were developed through
inter-nal discussions and pilot annotations. They are available on the SemEval-2018 AIT Task webpage.
Between 118 and 220 people residing in the United States annotated the 4-tuples for each of the four emotions and valence. In total, around 27K responses for each of the four emotions and around 50K responses for valence were obtained (see Table 4).9
Annotation Aggregation: The intensity scores were cal-culated from the BWS responses using a simple counting procedure (Orme, 2009; Flynn and Marley, 2014): For each item, the score is the proportion of times the item was cho-sen as having the most intensity minus the percentage of times the item was chosen as having the least intensity.10
We linearly transformed the scores to lie in the 0 (lowest intensity) to 1 (highest intensity) range.
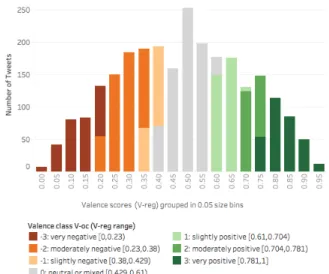
Distribution of Scores: Figure 1 shows the histogram of the V-reg tweets. The tweets are grouped into bins of scores 0–0.05, 0.05–0.1, and so on until 0.95–1. The colors for the bins correspond to their ordinal classes as determined from the manual annotation described in the next sub-section. The histograms for the four emotions are shown in Figure 3 in Appendix 6.1.
8
Kiritchenko and Mohammad (2016) showed that using just three annotations per 4-tuple produces highly reliable results. Note that since each tweet is seen in eight different 4-tuples, we obtain 8 × 4 = 32 judgments over each tweet.
9
Gold tweets were annotated more than four times.
10
Code for generating tuples from items using RMDS, as well as for generating scores from BWS annotations: http://saifmohammad.com/WebPages/BestWorst.html
Annotation Location of Annotation
Dataset Scheme Annotators Item #Items #Annotators MAI #Q/Item #Annotations
E-cTw16,Tw17
categorical World tweet 11,090 303 7 2 174,356
EI-regTw17
anger BWS USA 4-tuple of tweets 2,780 168 4 2 27,046
fear BWS USA 4-tuple of tweets 2,750 220 4 2 26,908
joy BWS USA 4-tuple of tweets 2,790 132 4 2 26,676
sadness BWS USA 4-tuple of tweets 2,744 118 4 2 26,260
V-regTw16,Tw17 BWS USA 4-tuple of tweets 5,134 175 4 2 49,856
Total 331,102
Table 4: Summary details of the current annotations done for the SemEval-2018 Affect in Tweets Dataset. These annota-tions were done on a set of 11,288 unique tweets. The superscript indicates the set of source tweets: Tw16 = Tweets-2016, Tw17 = Tweets-2017. MAI = Median Annotations per Item. Q = annotation questions. (This table does not include details for the EI-reg annotations done on the data from Tweets-2016 in earlier work (EI-regTw16).)
2.2.3. Identifying Ordinal Classes
For each of the EI-reg emotions, the two authors of this paper independently examined the ordered list of tweets to identify suitable boundaries that partitioned the 0–1 range into four ordinal classes: no emotion, low emotion,
moder-ate emotion,and high emotion. Similarly the V-reg tweets were examined and the 0–1 range was partitioned into seven classes: very negative, moderately negative, slightly
negative, neutral or mixed, slightly positive, moderately positive,and very positive mental state can be inferred.11
Annotation Aggregation: The two authors discussed their individual annotations to obtain consensus on the class in-tervals. The V-oc and EI-oc datasets were thus labeled. Class Distribution: The legend of Figure 1 shows the in-tervals of V-reg scores that make up the seven V-oc classes. The intervals of EI-reg scores that make up each of the four EI-oc classes are shown in Figure 3 in Appendix 6.1. Fig-ure 2 shows the distribution of the tweets with hashtags in-dicating sarcasm or irony in the seven V-oc classes. Ob-serve that a majority of these tweets are in the ‘neutral or mixed’ class. This aligns with the hypothesis that often sar-castic tweets indicate mixed emotions as on the one hand, the speaker may be unhappy about a negative event or out-come, but on the other hand, they choose to express them-selves through humor. Figure 2 also shows that many of the sarcastic tweets convey a negative valence, and that sar-castic tweets conveying positive valence of the speaker are fewer in number.
2.3.
Training, Development, and Test Sets
Table 4 summarizes key details of the current set of anno-tations done for the SemEval-2018 Affect in Tweets (AIT)
Dataset. AIT was partitioned into training, development, and test sets for machine learning experiments as described in Table 5. All of the tweets that came from Tweets-2016 were part of the training sets. All of the tweets that came from Tweets-2017 were split into development and test sets.12
11
Valence is a bi-polar scale; hence, more classes.
12
This split of Tweets-2017 was first done such that 20% of the tweets formed the dev. set and 80% formed the test set – indepen-dently for EI-reg, EI-oc, V-reg, V-oc, and E-c. Then we moved additional tweets from the test sets to the dev. sets such that a tweet in any dev. set would not occur in any test set.
Figure 1:Valence score (V-reg) and class (V-oc) distribution.
Figure 2:Valence class (V-oc) of tweets with sarcasm and irony indicating hashtags. Dataset trainTw16 devTw17 testTw17 Total E-c 6,838 886 3,259 10,983 EI-reg, EI-oc anger 1,701 388 1,002 3,091 fear 2,252 389 986 3,627 joy 1,616 290 1,105 3,011 sadness 1,533 397 975 2,905 V-reg, V-oc 1,181 449 937 2,567
Table 5: The number of tweets in the SemEval-2018 Af-fect in Tweets Dataset. The superscript indicates the set of source tweets: Tw16 = Tweets-2016, Tw17 = Tweets-2017.
Inter-Rater
Annotations Agreement Fleiss’ κ
Primary emotion (Q1)
random 8.33 0.00
E-c 41.53 0.32
All applicable emotions (Q1+Q2)
random 41.67 0.00
E-c: avg. for all 12 classes 83.38 0.21 E-c: avg. for 4 basic emotions 81.22 0.40
Table 6: Annotator agreement for the Multi-label Emotion Classification (E-c) Dataset.
3.
Agreement and Reliability of Annotations
It is challenging to obtain consistent annotations for affect due to a number of reasons, including: the subtle ways in which people can express affect, fuzzy boundaries of affect categories, and differences in human experience that im-pact how they perceive emotion in text. In the subsections below we analyze the AIT dataset to determine the extent of agreement and the reliability of the annotations.3.1.
E-c Annotations
Table 6 shows the inter-rater agreement and Fleiss’ κ for the multi-label emotion annotations. The inter-rater agreement is calculated as the percentage of times each pair of anno-tators agree. This measure does not take into account the fact that agreement can happen simply by chance. Fleiss’ κ, on the other hand, calculates the extent to which the ob-served agreement exceeds the one that would be expected by chance (Fleiss, 1971). It is debatable if there is a need to correct for chance agreement, therefore we present both measures.13E-cshows the scores for the labeling of the
pri-mary emotion. The numbers for all applicable emotions are calculated by taking the average of the agreement/Fleiss’ κ scores for each of the twelve labels individually. E-c: 4
basic emotion classesshows the averages for the four ba-sic emotions, which are also the most frequent in the E-c dataset. The individual scores for each of the twelve classes are shown in Appendix 6.3. For the sake of comparison, we also show the score obtained by randomly choosing the predominant emotion, and the score obtained by ran-domly choosing whether a particular emotion applies or not.14 Observe that the scores obtained through the actual annotations are markedly higher than the scores obtained by random guessing. Not surprisingly, the Fleiss’ κ scores (chance-corrected agreement) are higher when asked to se-lect only the primary emotion than when asked to identify all emotions that apply (since agreement on the more subtle emotion presence cases is expected to be low). The Fleiss’ κscores are also markedly higher on the frequently occur-ring four basic emotions, as compared to the full set.
3.2.
EI-reg and V-reg Annotations
For real-valued score annotations, a commonly used measure of quality is reproducibility of the end result—
13
http://www.john-uebersax.com/stat/kappa2.htm http://www.agreestat.com/book3/bookexcerpts/chapter2.pdf
14See Appendix 6.4. for details.
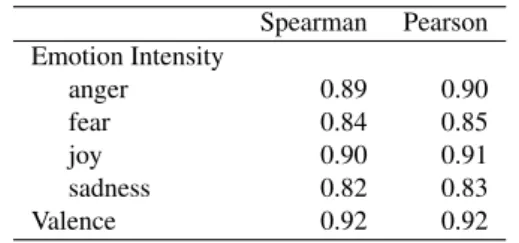
Spearman Pearson Emotion Intensity anger 0.89 0.90 fear 0.84 0.85 joy 0.90 0.91 sadness 0.82 0.83 Valence 0.92 0.92
Table 7: Split-half reliabilities in the AIT Dataset.
if repeated independent manual annotations from multi-ple respondents result in similar intensity rankings (and scores), then one can be confident that the scores capture the true emotion intensities. To assess this reproducibil-ity, we calculate average split-half reliability (SHR), a commonly used approach to determine consistency (Kuder and Richardson, 1937; Cronbach, 1946; Mohammad and Bravo-Marquez, 2017b). The intuition behind SHR is as follows. All annotations for an item (in our case, tuples) are randomly split into two halves. Two sets of scores are produced independently from the two halves. Then the cor-relation between the two sets of scores is calculated. The process is repeated 100 times, and the correlations are eraged. If the annotations are of good quality, then the av-erage correlation between the two halves will be high.
Table 7 shows the split-half reliabilities for the AIT data. Observe that correlations lie between 0.82 and 0.92, indicating a high degree of reproducibility. Past work has found the SHR for sentiment intensity annotations for words, with 6 to 8 annotations per tuple to be 0.95 to 0.98 (Mohammad, 2018; Kiritchenko and Mohammad, 2016). In contrast, here SHR is calculated from whole sentences, which is a more complex annotation task and thus the SHR is expected to be lower than 0.95.
4.
Associations Between Affect Dimensions
The AIT dataset allows us to study the relationships be-tween various affect dimensions.Co-occurrence of Emotions: Since we allow annotators to mark multiple emotions as being associated with a tweet in the E-c annotations, it is worth examining which emo-tions tend to frequently occur together. For every pair of emotions, i and j, we calculated the proportion of tweets labeled with both emotions i and j out of all the tweets an-notated with emotion i.15 (See Figure 5 in Appendix 6.5. for
the co-occurrence numbers.) The following pairs of emo-tions have scores greater than 0.5 indicating that when the first emotion is present, there is a greater than 50% chance that the second is also present: anger–disgust, disgust– anger, love–joy, love–optimism, joy–optimism, optimism– joy, pessimism–sadness, trust–joy, and trust–optimism. In case of some pairs such as anger and disgust, presence of either one is strongly associated with the presence of the other, whereas in case of other pairs such as love and joy, the association is markedly stronger only in one direction. As expected, highly contrasting emotions such as love and disgust have very low co-occurrence scores.
15
Note that the numbers are calculated from labels assigned af-ter annotator votes are aggregated (Ag2).
V-reg–EI-reg all data the emotion present
valence–joy 0.79 (607) 0.65 (496)
valence–anger -0.73 (598) -0.40 (282) valence–sadness -0.73 (603) -0.47 (313) valence–fear -0.60 (600) -0.09 (175)
Table 8: Pearson correlation r between valence and each of the four emotions on the subset of the Tweets-2017 that is annotated for both valence and a given emotion. The numbers in brackets indicate the number of instances.
Correlation of Valence and Emotion Intensity: The real-valued scores for V-reg and EI-reg allow us to calculate the correlations between valence and the intensities of the annotated emotions. Table 8 shows the results. For ev-ery valence–emotion pair, only those instances are consid-ered for which both valence and emotion intensity anno-tations are available. Observe that valence is found to be moderately correlated with joy intensities. The correlation is lower when we consider only those instances that have some amount of joy (EI-oc class is low, moderate, or high joy). Table 8 also shows that valence is inversely moder-ately correlated with anger, fear, and sadness. The correla-tion drops considerably for valence–fear, when examining only those data instances that have some amount of fear.
For any given tweet, we will refer to the ratio of one affect score to another affect score as affect–affect intensity
ratio, or AAIR. If two affect dimensions are correlated (at least to some degree), then the AAIRs and the differences from the average help identify the tweets for which the two affect scores correlate and the tweets for which they do not. For each affect dimension pair shown in Table 8, we calculate the AAIRs for the emotion-present tweets. Since valence (positiveness) is inversely correlated with each of the three negative emotions, for these emotions we calcu-late the AAIR with negativeness (1 − valence). We then examine those tweets for which the ratio is much greater than the average, as well as the tweets for which the ratio is much lower than the average. (Table 11 in Appendix 6.2. shows example tweets for both kinds.) For the valence– negative emotion tweet sets, the AAIR tends to be higher than the average AAIR when the tweet conveys a different negative emotion. For example, a tweet may have a high negativeness score (a low valence score) and a low fear score because it conveys a high amount of anger. Often the AAIR is lower than the average AAIR (low negative-ness and high negative emotion), when the tweet expresses optimism, confidence, or resolve, despite a negative situa-tion. Both of the above occur frequently in the valence– fear-present set of tweets, resulting in the particularly low correlation scores. Examination of the valence–joy tweets reveals that the AAIRs are higher than the average AAIR (i.e., high valence and low joy) when tweets convey posi-tive emotions other than joy such as optimism, satisfaction, and relief. (See examples in Table 11.)
Correlations of the Intensities of Pairs of Negative Emo-tions: As mentioned earlier, we chose to annotate a com-mon set of 600 tweets for intensity of anger, fear, and sadness. We can thus calculate the extent to which these scores are correlated. Table 9 shows the results. Observe that the scores are in the range from 0.5 to 0.65 for the full
EI-reg–EI-reg all data both emotions present fear–sadness 0.64 (668) 0.09 (174) anger–sadness 0.62 (616) 0.08 (224)
anger–fear 0.51 (599) -0.13 (124)
Table 9: Pearson correlation r between each pair of the negative emotions on the subset of the Tweets-17 that is annotated for both emotions. The numbers in brackets in-dicate the number of instances in each case.
set; however, the scores are much closer to 0, when con-sidering only those tweets where both emotions are present (have EI-oc labels of low, moderate, or high emotion). This suggests that when the emotions are present, the intensi-ties are largely not correlated with each other. Table 11 in Appendix 6.2. shows example tweets whose AAIRs were markedly higher or lower than the average—tweets whose scores were high for one emotion, but low for the other emotion. Table 9 results also imply that when a particu-lar emotion is not present, then the intensities correlated moderately. This is possibly because in the absence of the emotion, the BWS annotators ranked tweets as per valence. For example, a person who tweeted a happy thought will likely be marked least angry more often than the person who tweeted a neutral thought.
5.
Summary and Future Work
We created a new affectual tweets dataset of more than 11,000 tweets such that overlapping subsets are annotated for a number of emotion dimensions (from both the basic emotion model and the VAD model). For each emotion di-mension, we annotated the data not just for coarse classes (such as anger or no anger) but also for fine-grained real-valued scores indicating the intensity of emotion (anger, sadness, valence, etc.). We crowdsourced the data annota-tion through a number of carefully designed quesannota-tionnaires. We used Best–Worst Scaling to obtain fine-grained real-valued intensity scores (split-half reliability scores >0.8)). The new dataset is useful for training and testing super-vised machine learning algorithms for a number of emotion detection tasks. We made the dataset freely available via the website for SemEval-2018 Task 1: Affect in Tweets (Mo-hammad et al., 2018).16 Subsequently, Spanish and Arabic
tweet datasets were also created following the methodol-ogy described here (Mohammad et al., 2018). The SemEval task received submissions from 72 teams for five different tasks, each with datasets in English, Arabic, and Spanish.
The Affect in Tweets Dataset is also useful for shed-ding light on research questions about the relationships be-tween affect categories. We calculated the extent to which pairs of emotions co-occur in tweets. We showed the ex-tent to which the intensities of affect dimensions correlate. We also calculated affect–affect intensity ratios which help identify the tweets for which the two affect scores correlate and the tweets for which they do not.
We are currently annotating the dataset for arousal and dominance. With those additional annotations, we can ex-plore how valence, arousal, and dominance change across tweets with low to high anger/joy/sadness/fear intensity.
16
6.
Bibliographical References
Alm, C. O., Roth, D., and Sproat, R. (2005). Emotions from text: Machine learning for text-based emotion pre-diction. In Proceedings of the Joint Conference on HLT–
EMNLP, Vancouver, Canada.
Cronbach, L. (1946). A case study of the splithalf reli-ability coefficient. Journal of educational psychology, 37(8):473.
Ekman, P. (1992). An argument for basic emotions.
Cog-nition and Emotion, 6(3):169–200.
Fleiss, J. L. (1971). Measuring nominal scale agreement among many raters. Psychological Bulletin, 76(5):378– 382.
Flynn, T. N. and Marley, A. A. J. (2014). Best-worst scal-ing: theory and methods. In Stephane Hess et al., editors,
Handbook of Choice Modelling, pages 178–201. Edward Elgar Publishing.
Frijda, N. H. (1988). The laws of emotion. American
psy-chologist, 43(5):349.
Kiritchenko, S. and Mohammad, S. M. (2016). Capturing reliable fine-grained sentiment associations by crowd-sourcing and best–worst scaling. In Proceedings of The
15th Annual Conference of the North American Chapter of the Association for Computational Linguistics: Hu-man Language Technologies (NAACL), San Diego, Cali-fornia.
Kiritchenko, S. and Mohammad, S. M. (2017). Best-worst scaling more reliable than rating scales: A case study on sentiment intensity annotation. In Proceedings of The
Annual Meeting of the Association for Computational Linguistics (ACL), Vancouver, Canada.
Kuder, G. F. and Richardson, M. W. (1937). The the-ory of the estimation of test reliability. Psychometrika, 2(3):151–160.
Louviere, J. J., Flynn, T. N., and Marley, A. A. J. (2015).
Best-Worst Scaling: Theory, Methods and Applications. Cambridge University Press.
Louviere, J. J. (1991). Best-worst scaling: A model for the largest difference judgments. Working Paper.
Mikolov, T., Chen, K., Corrado, G., and Dean, J. (2013). Efficient estimation of word representations in vector space. In Proceedings of Workshop at ICLR.
Mohammad, S. M. and Bravo-Marquez, F. (2017a). Emo-tion intensities in tweets. In Proceedings of the sixth
joint conference on lexical and computational semantics (*Sem), Vancouver, Canada.
Mohammad, S. M. and Bravo-Marquez, F. (2017b). WASSA-2017 shared task on emotion intensity. In
Pro-ceedings of the Workshop on Computational Approaches to Subjectivity, Sentiment and Social Media Analysis (WASSA), Copenhagen, Denmark.
Mohammad, S. M., Sobhani, P., and Kiritchenko, S. (2017). Stance and sentiment in tweets. Special Section
of the ACM Transactions on Internet Technology on Ar-gumentation in Social Media, 17(3).
Mohammad, S. M., Bravo-Marquez, F., Salameh, M., and Kiritchenko, S. (2018). Semeval-2018 Task 1: Affect in tweets. In Proceedings of International Workshop on
Se-mantic Evaluation (SemEval-2018), New Orleans, LA, USA.
Mohammad, S. M. (2018). Word affect intensities. In
Pro-ceedings of the 11th Edition of the Language Resources and Evaluation Conference (LREC-2018), Miyazaki, Japan.
Nakov, P., Rosenthal, S., Kiritchenko, S., Mohammad, S. M., Kozareva, Z., Ritter, A., Stoyanov, V., and Zhu, X. (2016). Developing a successful semeval task in sen-timent analysis of twitter and other social media texts.
Language Resources and Evaluation, 50(1):35–65. Orme, B. (2009). Maxdiff analysis: Simple counting,
individual-level logit, and HB. Sawtooth Software, Inc. Parrot, W. (2001). Emotions in Social Psychology.
Psy-chology Press.
Plutchik, R. (1980). A general psychoevolutionary theory of emotion. Emotion: Theory, research, and experience, 1(3):3–33.
Russell, J. A. (2003). Core affect and the psycholog-ical construction of emotion. Psychological review, 110(1):145.
Strapparava, C. and Mihalcea, R. (2007). Semeval-2007 task 14: Affective text. In Proceedings of
SemEval-2007, pages 70–74, Prague, Czech Republic.
Yu, L.-C., Lee, L.-H., Hao, S., Wang, J., He, Y., Hu, J., Lai, K. R., and Zhang, X.-j. ). Building Chinese af-fective resources in valence-arousal dimensions. In
Pro-ceedings of The 15th Annual Conference of the North American Chapter of the Association for Computational Linguistics: Human Language Technologies (NAACL), San Diego, California.
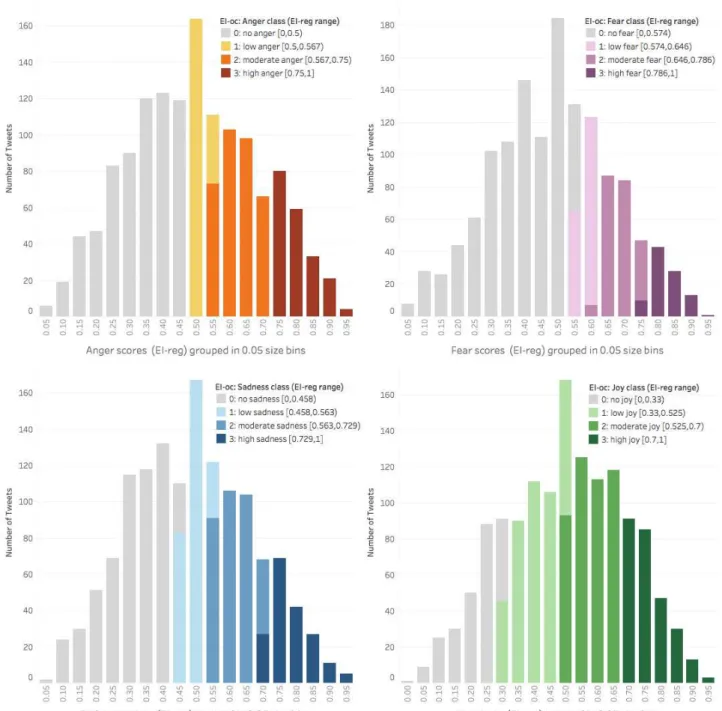
Figure 3:Emotion intensity score (EI-reg) and ordinal class (EI-oc) distributions for the four basic emotions in the SemEval-2018 AIT development and test sets combined. The distribution is similar for the training set, which was annotated in earlier work.
Appendix
6.1.
Distributions of the EI-reg Tweets
Figure 3 shows the histograms of the EI-reg tweets in the anger, joy, sadness, and fear datasets. The tweets are grouped into bins of scores 0–0.05, 0.05–0.1, and so on until 0.95–1. The colors for the bins correspond to their ordinal classes: no emotion, low emotion, moderate emo-tion, and high emotion. The ordinal classes were deter-mined from the EI-oc manual annotations.
6.2.
Relationships Between Affect Dimension
Pairs
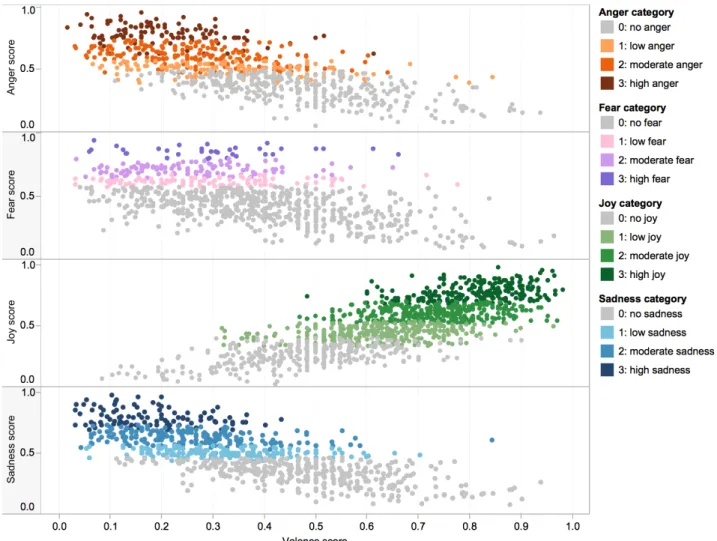
Figure 4 shows the valence of tweets in the EI-reg and EI-oc datasets. Observe that, as desired, using the chosen query terms led to the joy dataset consisting of a majority posi-tive tweets and the anger, fear, and sadness datasets con-sisting of a majority negative tweets. Table 11 shows pairs of example tweets whose AAIRs are markedly higher and lower from the average AAIR, respectively. Such tweets shed light on why the two affect dimensions are not per-fectly correlated (or perper-fectly inversely correlated).
Figure 4:Valence of tweets in the EI-reg and EI-oc datasets.
6.3.
Per-Emotion Annotator Agreement in the
E-c Annotations
Table 10 shows the per-emotion annotator agreement for the Multi-label Emotion Classification (E-c) Dataset. Ob-serve that the Fleiss’ κ scores are markedly higher for the frequently occurring four basic emotions (joy, sadness, fear, and anger), and lower for the less frequent emotions. (Fre-quencies for the emotions are shown in Table 2.) Also note, that the agreement is low for the neutral class. This is not surprising because the boundary between neutral (or no emotion) and slight emotion is fuzzy. This means that often at least one or two annotators indicate that the person is feeling some joy or some sadness, even if most others indicate that the person is not feeling any emotion.
6.4.
E-c: Random Guess Agreement Calculation
When randomly guessing whether an emotion applies or not, half of the annotators (n
2) are expected to choose the
emotion, and the other half are expected not to choose the emotion. So, there are n
4( n
2 − 1) pairs of the annotators
that agree that the emotion is present, and the same number of pairs that agree that the emotion does not apply. All the other pairs disagree. There are n
2(n − 1) total number of
the annotator pairs. So, the Inter-Rater Agreement, which is the percentage of the annotator pairs that agree, is n−2
2(n−1).
For n= 7, IRA is 41.67%.
Inter-Rater
Emotions Agreement Fleiss’ κ
anger 79.23 0.41 anticipation 83.05 0.04 disgust 74.68 0.20 fear 87.45 0.38 joy 78.91 0.47 love 88.83 0.21 optimism 77.15 0.18 pessimism 86.27 0.08 sadness 79.27 0.32 surprise 91.20 0.07 trust 91.17 0.04 neutral 83.33 0.14
Table 10: Applicable emotions (Q1+Q2): Per-emotion an-notator agreement for the annotations in the E-c data.
6.5.
Emotion–Emotion Co-occurrence
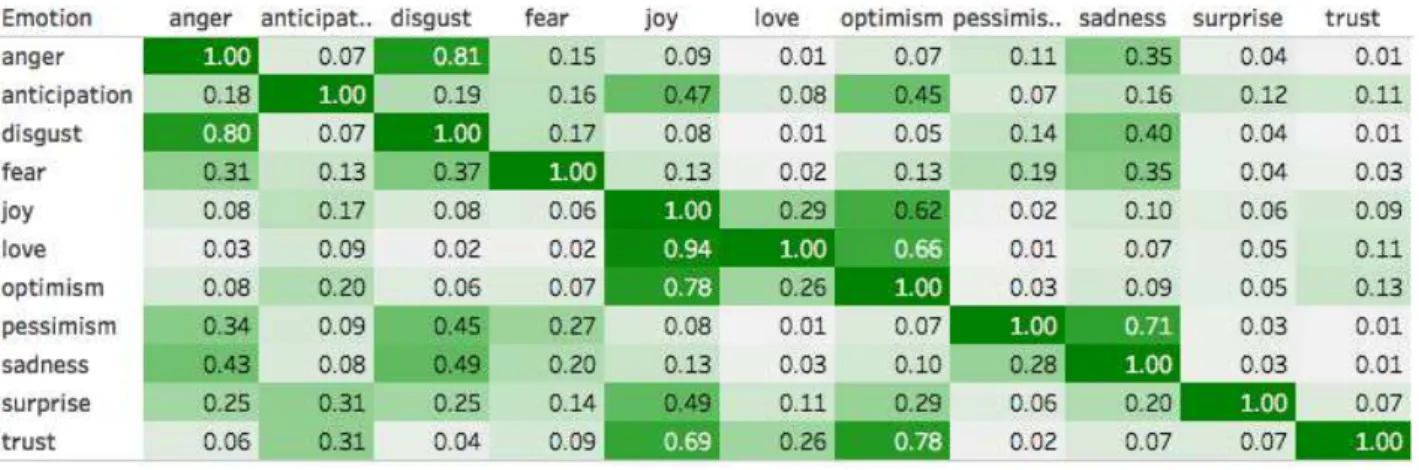
Figure 5 shows the proportion of tweets in the E-c dataset annotated with each pair of emotions. For a pair of emo-tions, say from row i and column j, the number in cell (i,j) shows the proportion of tweets labeled with both emotions
iand j out of all the tweets annotated with emotion i.17)
17
Note that the numbers are calculated from labels assigned af-ter annotator votes are aggregated (Ag2).
Figure 5:The proportion of tweets in the E-c dataset annotated with each pair of emotions.
Intensity of Intensity of
AD1–AD2 AD1 AD2 Example Tweet
Valence – Emotion
valence–anger V=↓ A=↓ Man I feel like crap today
V=↑ A=↑ Up early. Kicking ass and taking names. #offense.
valence–fear V=↓ F=↓ @altontowers Loves the rich!!! Fuck us ’working class folk’ and our kids! #fuming #joke #scandalous #disgusting
V=↑ F=↑ Heading to PNC to get the ball going for my MA! #goingforit #nervous #excited
valence–joy V=↓ J=↑ One of the greathorrible moments as a professor is seeing a wonderful student leaving your university to pursue his/her true passion.
V=↑ J=↓ Nothing is more #beautiful than a #smile that has struggled through tears. #optimism [muscles emoji]
valence–sadness V=↓ S=↓ It’s 2017 and there still isn’t an app to stop you from drunk texting #rage
V=↑ S=↑ @[masked] keep your head clear an focused. Do not let T intimidate you or use your children to silence you! Hate when a man does that! Negative Emotion – Negative Emotion
anger–fear A=↓ F=↑ Going to sleep was a bad idea i had a horrible nightmare abt what i hate the most in a nightmare but its fine im ok
A=↑ F=↓ Don’t fucking tag me in pictures as ’family first’ when you cut me out 5 years ago. You’re no one to me.
fear–sadness F=↓ S=↑ This kind of abuse is UNBELIEVABLE and an absolute disgrace. It makes me sad to see this #dismayed
F=↑ S=↓ I am having anxiety right now because I don’t know it’s gonna happen
sadness–anger S=↓ A=↑ I hate when stupid ass shit irritate me
S=↑ A=↓ Found out the peraon i liked wanted to that someone else #sadness
Table 11: Pairs of example tweets whose AAIRs are markedly higher and lower from the average AAIR, respectively, for various affect dimension (AD) pairs. Such tweets shed light on why the two affect dimensions are not perfectly correlated (or perfectly inversely correlated)