HAL Id: hal-01644884
https://hal.archives-ouvertes.fr/hal-01644884
Submitted on 21 Feb 2018
HAL is a multi-disciplinary open access
archive for the deposit and dissemination of
sci-entific research documents, whether they are
pub-lished or not. The documents may come from
teaching and research institutions in France or
abroad, or from public or private research centers.
L’archive ouverte pluridisciplinaire HAL, est
destinée au dépôt et à la diffusion de documents
scientifiques de niveau recherche, publiés ou non,
émanant des établissements d’enseignement et de
recherche français ou étrangers, des laboratoires
publics ou privés.
Non-contact Measurement of the Shrinkage and
Calculation of Porosity During the Drying of Banana
Jamel Madiouli, Jalila Sghaier, Jean-José Orteu, Laurent Robert, Didier
Lecomte, Habib Sammouda
To cite this version:
Jamel Madiouli, Jalila Sghaier, Jean-José Orteu, Laurent Robert, Didier Lecomte, et al.. Non-contact
Measurement of the Shrinkage and Calculation of Porosity During the Drying of Banana. Drying
Technology, Taylor & Francis, 2011, 29 (12), pp.358-1364. �10.1080/07373937.2011.561460�.
�hal-01644884�
Non-contact Measurement of the Shrinkage and Calculation
of Porosity During the Drying of Banana
Jamel Madiouli,
1,2Jalila Sghaier,
1,2Jean-Jose´ Orteu,
3Laurent Robert,
3Didier Lecomte,
3and Habib Sammouda
41
LETTM, De´partement de Physique, Faculte´ des Sciences de Tunis, Universite´ El Manar, Tunisia 2
D.G.E., Ecole Nationale d’Inge´nieurs de Monastir, Universite´ de Monastir, Monastir, Tunisia 3CROMeP, Ecole des Mines d’Albi-Carmaux, Campus Universitaire de Jarlard,
Albi CT Cedex 09, France 4
ESST-HSousse, Universite´ of Sousse, Hammam Souse, Tunisia
A novel non-intrusive technique (stereo-correlation) was used to determine the apparent volume of a banana in convective drying condition. The volume was calculated using the 3D Digital Image Correlation method (3D-DIC), which provides the 3D shape of the banana during drying. The combination of this technique and mass measurement allows the calculation of the porosity using the model of Katekawa and Silva[1]and the graphical interpretation pre-sented by Madiouli et al.[2]The banana shows an ideal shrinkage at the beginning of drying but stops shrinking at low moisture content, thus increasing the porosity up to 30–35%. The comparison of the experimental shrinkage and the calculated porosity with the experi-ments deduced from the literature enables us to conclude the effec-tiveness of the 3D-DIC technique as well as the porosity calculation model.
Keywords 3D-DIC; Banana; Digital image correlation; Drying; Experimental shrinkage; Porosity; Stereovision
INTRODUCTION
Drying is an important process in industry. In the chemical and pharmaceutical industries, the final product quality is important for determining its commercial value. In the food industry domain, the decrease of water activity to reach the hygroscopic equilibrium allows us to store and prevent the product from microbial attack. The majority of foodstuffs, such as fruit and vegetables, exhibit an impor-tant change in structure during drying. Often, these modi-fications of structures have a consequence on the drying performances or on the product qualities. The experimental measurement of the physical properties during drying was the subject of several research works in the literature in order to analyze the various mechanisms governing the thermal process.
Lozano et al.,[3,4] Madamba et al.,[5] Ratti,[6] Zogzas et al.,[7] and Krokida and Maroulis[8] measured the apparent density variation, the true density, the shrinkage and the porosity of many food products (apple, banana, carrot, garlic, pear, potato, and sweet potato). Most of the works showed a difference between the particular apparent density and the apparent density because of porosity devel-opment during drying. Krokida and Maroulis[8]studied the influence of the drying mode (convective drying, osmotic dehydration, and freeze drying) on the physical properties of four products (apple, banana, potato, carrot). Ochoa et al.[9]were the first to study the shrinkage of whole rose hip fruits during convective drying. In a related paper,[10] they studied volume and surface shrinkage of whole sour cherry fruits during dehydration. They showed that the change of volume and surface is related only to the moist-ure content of the product and not to the drying con-ditions. Eventually,[11] for convective drying of whole sweet cherry fruits (prunus avium), they confirmed that the important shrinkage observed was independent of the operating conditions and related only to the moisture con-tent of the fruit. Madamba et al.[12]studied the shrinkage, density, and porosity change of bamboo shoots during hot air drying and showed that internal porosity is non-linearly related to the moisture content. Guine et al.[13] studied shrinkage and porosity change of pears during drying. They observed that porosity increases from 2% (fresh product) to 12% at the end of drying. The particular and apparent den-sity increased during drying and reached their maxima at the end of the drying process.
The shrinkage or the change of apparent volume during drying is described by fundamental models[1,2,4,14–18] and empirical correlations.[3,6,7,18,19] The model presented by Katekawa and Silva[1]gives a very general expression with a limited number of properties (the initial density of the moist product, the true density of the solid phase, and
the true density of the liquid phase). This model, used by Madiouli et al.,[2]has a graphical interpretation to visualize the changes of porosity by comparing the experimental shrinkage curve with an ideal one.
In the recent literature, many works for monitoring characteristics of fruits, such as volume, shrinkage, and porosity, during different modes of drying were presented. Witrowa-Rajchert and Rzaca[20] studied the effect the internal structure of apples dried under different modes (i.e., convection, microwave-convection, and infrared-convection) on the volume, density, porosity, and shrinkage. They measured volume of dried apple slices by the displacement method using toluene. The apparent density was calculated by the measurement of the mass of the samples. They concluded that apples exhibit the smallest volume and porosity, the highest density, and the greatest shrinkage when dried by convection. Shulyak and Izotova[21] studied the shrinkage kinetics during con-vective drying of selected berries. They calculated the vol-ume and the surface areas using photos taken during drying and digitalization. At the end of the drying process, they found that blackcurrants shrink more than redcur-rants and gooseberries. Mayor et al.[22] have studied shrinkage, density, and porosity during different drying modes (osmotic dehydradation, air drying) of pumpkin (cucurbita pepo L.) fruits. They calculated the apparent volume from the resultant buoyant force of the sample when immersed in n-heptane and they obtained the particle volume with a gas pycnometer. Yan et al.[23] proposed seven methods (liquid pycnometry, liquid displacement and Archimedes principle, with two organic solvents (tolu-ene and n-heptane), and displacement with glass beads) to measure apparent volume, shrinkage, and porosity of banana, pineapple, and mango during drying.
For the measurement of apparent volume, non-intrusive techniques were developed recently. Among these, the method of Laser Scanning[24]was used to monitor the dry-ing of food products (apple, avocado, potato, and carrot). The X-ray microtomography method combined with image processing[25]was applied for the measurement of a volume of sludge during drying under atmospheric conditions. The ESEM (Environmental Scanning Electron Microscope) used with image processing[26]reveals local information on the material behavior (cracks, for example). Martynenko[27] used one single camera to determine the surface shrinkage and the color change of the product. In a related work, he used two cameras to estimate volumetric shrinkage of apple slices in convective drying.[28]One camera was placed for the visualization of the base and the other one for visualizing the cylinder height in order to determine the volume. These techniques allow the continuous measure-ment of volume change but they are based on the assump-tion of the conservaassump-tion of the sample regular shape (cylindrical) during the drying process.
The behavior of banana during drying has been exten-sively studied in the literature.[29–34] In the present work, the stereo-correlation method (3D-DIC),[35–38]used in the literature to determine the shape or the 3D displacement= strain fields on any 3D object, has been used to determine the variation of the banana apparent volume, thus an object having an irregular form, during drying. This method, combined with the measurement of the mass, determines the variation of several properties (volume, apparent density, water content, etc.) during drying. Using the method presented by Madiouli et al.[2]and the model of Katekawa and Silva,[1] the simultaneous measurement of the apparent volume and the mass allows one to calculate the porosity of a food product (banana) during drying, using only measured properties at the beginning and the end of the drying process.
THEORY
The porosity calculation was developed based on the Katekawa and Silva[1] model and the graphical method presented by Madiouli et al.,[2]written in the form:
1! e ð Þ 1! e0 ð Þ V V0¼ X0b 1þ bX0 X X0þ 1 1þ bX0 ð1Þ whereb ¼ qS=qL.
This equation shows the variation of the apparent vol-ume V with the moisture content X. Four properties mea-sured at the beginning and at the end of the experiment (solid densityqS, liquid densityqL, initial porositye0, and initial water content X0) are necessary for the full descrip-tion of the model. The simultaneous measurement of the volume and the mass allows indirect determination of the bulk porosity. In the general case, when shrinkage is not ideal and initial porosity is not equal to zero, porosity is
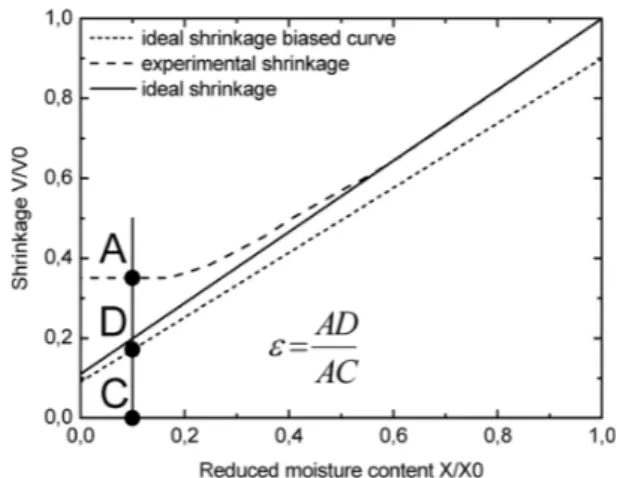
FIG. 1. Determination of porosity using visual interpretation of the shrinkage curve.
obtained by the following expression: e ¼ V V0! 1 ! e0ð Þ X0b 1þbX0 X X0þ 1 1þbX0 ! " h i V V0 ð2Þ The graphical interpretation is shown in Figure 1 where porosity is equal to the segment AC to segment AD ratio. Equation (2) shows that the porosity depends on the experimental values of shrinkage and a set of properties (initial moisture content, solid density, initial bulk density, and liquid density). The error on the porosity calculation is thus derived from the experimental errors made during the determination of the shrinkage curves and from the errors on the properties used in the model. Error calculations are presented in a recent work.[39]
THE STEREO-CORRELATION TECHNIQUE
The stereo-correlation technique[35–38] is a stereovision technique that uses two cameras to measure the shape of any 3D object observed from two different viewpoints. In the present work, this technique is used to determine the volume of a banana during convective drying. The banana is placed in the view field of both cameras. From a pair of images, it is possible to compute the 3D coordinates of a physical 3D point by triangulation assuming that: (1) the geometry of the stereo rig (i.e., the relative position and orien-tation of the two cameras) is known, a problem solved by an off-line camera calibration procedure; (2) the image points corresponding to the same physical 3D point are matched in the images. This is called the stereo-matching problem. Calibration
Calibrating a stereovision sensor made up of two cam-eras involves determining the intrinsic parameters of each camera and the relative position and orientation between both cameras. These calibration data are required to compute, by triangulation, the 3D coordinates of a point
corresponding to matched pixels on the two images. From a practical point of view, the calibration procedure only requires the cameras to observe a (planar) calibration pattern (Figure 2) shown at a few different orientations (typically between ten and twenty).[40]
Stereo-matching
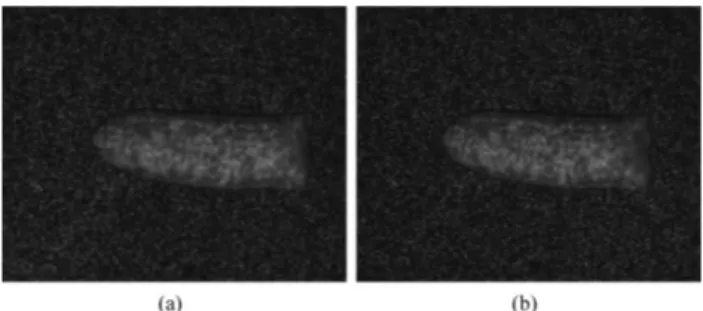
The main difficulty in stereovision is to establish corre-spondences between pairs of images (Figure 3). In the stereo-correlation technique, the stereo-matching problem is solved using the well-known Digital Image Correlation (DIC) technique.[37]The DIC algorithm attempts to correlate the grey levels of image patches in the views being considered, assuming that they present some similarity. The DIC tech-nique requires that the object surface be relatively textured. When an object does not present a suitable random, con-trasted texture, one may apply a thin coating of high-contrast particles such as from spray painting, toner powder, ink, lithography, etc., or may project a speckle-pattern onto the object using a video-projector, for instance.
3D Reconstruction
Using the calibration parameters, a classical triangulation method is used to compute the 3D position of a scene point corresponding to a stereo pair of image points. By repeating this operation for a large number of stereo matched pairs, the 3D shape of an object can be obtained. The accuracy of 3D reconstruction depends on many factors: (1) the qual-ity of the cameras and their resolution; (2) the configuration of both cameras (distance between them, angle between their optical axis, etc.), which governs the triangulation accuracy; (3) the accuracy of the stereovision sensor calibration; and (4) the accuracy of the matched features in the images. EXPERIMENTS
The experimental part consists of combining the 3D-DIC technique to a high sensitivity balance during the drying of the product. The banana is cut along its length in two halves, one of them being placed (approx. length 7 cm) on a high accuracy (10!4g) weigh scale FIG. 2. Calibration target used to calibrate the stereovision rig with
VIC-3D1.
FIG. 3. Pair of images taken at the same time by the stereovision rig used in our experiment: (a) right camera; (b) left camera.
(SARTORIUS). The slice is dried on a bench in a temperature-controlled chamber (26,7& 0,4'C). A speckle-pattern printed on a slide is projected onto the banana, using a slide projector, in order to give to the sur-face of the banana a suitable random, contrasted texture (see Figure 3) required by the DIC technique. The stereovi-sion rig is made up of two HAMAMATSU C4742-95 cooled CCD cameras, with a 1280( 1024 pixels resolution, equipped with 50 mm lenses. Both cameras are fixed on a frame and directed towards the banana during the whole drying (Figure 4). The distance between the cameras is about 338 mm (this distance is called the baseline) and the angle between them is about 26'. These data are
provided by the off-line calibration step that is performed prior to performing the drying experiment. The calibration target, with approximately the same dimension of the banana, used for the calibration of the stereovision rig, is shown in Figure 2. The off-line preliminary calibration step and the processing of the image pairs taken at different time intervals are performed using VIC-3D1 software.[41] The software provides the 3D shape of the banana at each acquisition time. Using the 3D shape of the banana, the volume is calculated using a homemade code.
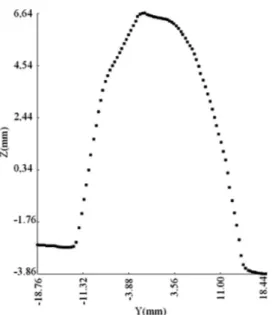
The data processing allowed us to obtain the 3D shape (Figures 5 and 6) as well as transverse sections of banana with a good precision (Figure 7). Using these data, the cal-culation of the volume of banana and the determination of the shrinkage ratioV
V0was made possible with simultaneous
recording of the mass loss.
After drying, the banana was kept inside an oven with a temperature of 105'C for 24 hours to obtain the dry mass and thus derive the initial moisture content. Helium pycno-metry (Accupyc 1330 Micromeritics, Particle & Surface Sciences Pty. Limited, Australia) allowed us to determine the solid (intrinsic) volume of banana. This was achieved by using Archimede’s principle of fluid displacement and Boyle’s law with the use of helium as displacement fluid. Knowing the mass, the measurement of the true banana density with an accuracy of 0,001 g=mL was obtained (1250 kg=m3).
RESULTS AND DISCUSSION
The convective drying of banana lasted five days for a low drying temperature and high air relative moisture. FIG. 4. The experimental test bench.
FIG. 5. 2D shape of the banana before drying (the bar gives the height).
FIG. 6. 2D shape of the banana after complete convective drying (4647 min.).
For the measurement of apparent volume, several techni-ques are available in the literature.[20,28]The non-intrusive techniques[24,25,28]need the use of a regular form of sam-ples. In the present work, the 3D reconstruction of the irregular form of the sample of banana (Figures 5 and 6) allows the measurement of the apparent volume change (shrinkage) (Figure 8). The sample had lost half of its mass during the first day and thus the images from both cameras were collected essentially in one day. The measurement of the mass loss of banana during drying (Figure 9) coupled with the stereo-correlation technique allows us to calculate porosity during drying (Figure 10). The banana exhibits an ideal shrinkage at the beginning of drying, then stops
contracting, which is attributed to case-hardening of the surface.[23,42] At the end of drying, the banana volume reaches approximately 30% of initial volume.
The shrinkage curve for banana has the same form as for sweet potato, garlic, and pear.[8,35] Figure 10 shows the porosity change as a function of the reduced moisture content using the data from stereo-correlation measure-ment (Figure 8) and the model of calculation of porosity (Figure 1). For the major part of the drying process, porosity remains almost constant (5%), but when the value of the reduced moisture content X
X0 is smaller than 0.3,
porosity increases. The banana calculated porosity curve shows the same form as banana experimental porosity of many works in the literature[1,8,23,39] (Figure 10). We observe that at the end of drying, the calculated porosity obtained from the proposed model is slightly different compared to the measured porosity from the litera-ture.[1,8,23]This difference may be due to the microstructure
FIG. 8. Shrinkage of banana (1): stereo-correlation measurement (26.5'C, 45%HR); (2) and (3): Katekawa and Silva (30'C, 45%HR) and
(50'C, 15%HR); (4): Yan et al.
FIG. 7. Vertical section of banana at the beginning of drying.
FIG. 9. Drying rate of banana from experimental mass determination.
FIG. 10. Porosity of banana: (1) calculated porosity; (2) and (3): Katekawa and Silva (30'C, 45%HR) and (50'C, 15%HR); (4) Yan et al.;
of the sample and measurement errors. The comparison of the obtained results with the experiments of Katekawa and Silva,[1]Yan et al.,[23]and Krokida and Maroulis[8]allows us to draw conclusions on the effectiveness of the stereo-correlation and the model of calculation of porosity (Figures 8 and 10).
CONCLUSION
The main objective of this study was to measure the apparent volume of a banana during convective drying using the so-called stereo-correlation (3D-DIC) technique. The apparent volume of the irregular form banana was determined. The effectiveness of the stereo-correlation tech-nique was demonstrated. The use of the model developed by Madiouli et al.[2]allowed calculating porosity with the mere knowledge of properties measured at the beginning and at the end of experiment (apparent density, mass, volume of the solid phase, and liquid). The banana shrinkage appears ideal at the beginning of drying and decreases with the reduced moisture content decreasing. The porosity increases to reach its maximum value at the end of the ther-mal process. Unlike intrusive methods, which need to stop and resume the experiments or use different samples, the proposed technique allows online measurement of the bulk porosity and may be applied to irregular-shaped solids.
In the present preliminary work, one half of the banana was placed on a flat surface. As both cameras can only measure the visible part of the banana, the proposed experiment cannot give any information on surface changes between the flat carrier and the banana slice (for instance, possible void spaces could appear). To obtain the full 3D shape of the banana, a multiple-camera device using more than two stereo-correlation techniques could be used. Such a technique is currently being developed in our laboratories.[43,44] The banana could be surrounded by a four-camera system, for instance, and this would provide the complete 3D shape of the banana and its evolution dur-ing the drydur-ing process. The only limitations would be when the product twists or bends over itself, creating void spaces and causing some regions to be invisible (inaccessible to a vision system).
NOMENCLATURE
V Volume of material (m3) V0 Initial volume of material (m3)
X Moisture content (kg of water=kg of dry solid) X0 Initial moisture content (kg of water=kg of dry solid) Greek Letters
e Porosity e0 Initial porosity
q0 Initial apparent density (kg=m3) qL Density of solvent (kg=m3) qS Density of solid (kg=m3)
REFERENCES
1. Katekawa, M.E.; Silva, M.A. 2004. Study of porosity behavior in con-vective drying of bananas. In Proceedings of the 14th International Drying Symposium (IDS 2004), Sao-Paulo, Brazil, August 22–25, 2004; B, 1427–1434.
2. Madiouli, J.; Lecomte, D.; Nganya, T.; Chavez, S.; Sghaier, J.; Sammouda, H. A method for determination of porosity change from shrinkage curves of deformable materials. Drying Technology 2007, 25(4), 621–628.
3. Lozano, J.E.; Rotstein, E.; Urbicain, M.J. Total porosity and open-pore porosity in the drying of fruits. Journal of Food Science 1980, 45, 1403–1407.
4. Lozano, J.E.; Rotstein, E.; Urbicain, M.J. Shrinkage, porosity and bulk density of foodstuffs at changing moisture contents. Journal of Food Science 1983, 48, 1497–1502.
5. Madamba, P.S.; Driscoll, R.H.; Buckle, K.A. Shrinkage, density and porosity of garlic during drying. Journal of Food Engineering 1994, 23(3), 309–319.
6. Ratti, C. Shrinkage during drying of foodstuffs. Journal of Food Engineering 1994, 23(1), 91–105.
7. Zogzas, N.P.; Maroulis, Z.B.; Marinos-Kouris, D. Densities, shrink-age and porosity of some vegetables during air drying. Drying Technology 1994, 12(7), 1653–1666.
8. Krokida, M.K.; Maroulis, Z.B. Effect of drying method on shrinkage and porosity. Drying Technology 1997, 15(10), 2441–2458. 9. Ochoa, M.R.; Kesseler, A.G.; Pirone, B.N.; Marquez, C.A.; De
Michelis, A. Shrinkage during convective drying of whole rose hip (Rosa rubiginosa L.). Fruits Lebensm.-Wiss. u.-Technol. 2002, 35, 400–406.
10. Ochoa, M.R.; Kesseler, A.G.; Pirone, B.N.; Marquez, C.A.; De Michelis, A. Volume and area shrinkage of whole sour cherry fruits (prunus cerasus) during dehydration. Drying Technology 2002, 20(1), 147–156.
11. Ochoa, M.R.; Kesseler, A.G.; Pirone, B.N.; Marquez, C.A.; De Michelis, A. Analysis of shrinkage phenomenon of whole sweet cherry fruits (Prunus avium) during convective dehydration with very simple models. Journal of Food Engineering 2007, 79, 657–661.
12. Madamba, P.S. Physical changes in bamboo (Bambusa phyllostachys) shoot during hot air drying: Shrinkage, density, and porosity. Drying Technology 2003, 21(3), 555–568.
13. Guine, R.P.F.; Ramos, M.A.; Figueiredo, M. Shrinkage characteris-tics and porosity of pears during drying. Drying Technology 2006, 24, 1525–1530.
14. Vacarezza, L. Cinetica y Mecanismo de Transporte de Agua Durante la Deshidrataci_on de la Remolacha Azucarera; Ph.D. Thesis, Universi-dad de Buenos Aires, 1975.
15. Suzuki, K.; Kubota, K.; Hasegawa, T.; Hosaka, H. Shrinkage in dehydratation of root vegetables. Journal of Food Science 1976, 41, 1189–1193.
16. Perez, M.G.; Calvelo, A. Modeling the thermal conductivity of cooked meat. Journal of Food Science 1984, 49, 152–156.
17. Rahman, M.S.; Perera, C.O.; Chen, X.D.; Driscoll, R.H.; Potluri, P.L. Density, shrinkage and porosity of calamari mantle meat during air drying in a cabinet dryer as a function of water content. Journal of Food Engineering 1996, 30, 135–145.
18. Mayor, L.; Sereno, A.M. Modelling shrinkage during convective drying of food material: A review. Journal of Food Engineering 2004, 61, 373–386.
19. Azzouz, S.; Jomaa, W.; Belghith, A. Drying kinetic equation of single layer of grapes. In Proceedings of the 11th International Drying Sym-posium (IDS ’98), Halkidiki, Greece, August 19–22, 1998; B, 988–997. 20. Witrowa-Rajchert, D.; Rza˛ca, M. Effect of drying method on the microstructure and physical properties of dried apples. Drying Tech-nology 2009, 27(7), 903–909.
21. Shulyak, V.A.; Izotova, L.A. Shrinkage kinetics during convect-ive drying of selected berries. Drying Technology 2009, 27(3), 495– 501.
22. Mayor, L.; Moreira, R.; Sereno, A.M. Shrinkage, density, porosity and shape changes during dehydration of pumpkin (Cucurbita pepo L.) fruits. Journal of Food Engineering 2011, 103, 29–37.
23. Yan, Z.; Sousa-Gallagher, M.J.; Oliveira, F.A.R. Shrinkage and porosity of banana, pineapple and mango slices during air-drying. Journal of Food Engineering 2008, 84, 430–440.
24. May, B.K.; Perre´, P. The importance of considering exchange surface area reduction to exhibit a constant drying flux period in foodstuffs. Journal of Food Engineering 2002, 54, 271–282.
25. Leonard, A.; Blancher, S.; Pirard, R.; Marchot, P.; Pirard, J.P.; Crine, M. Multiscale texture characterization of wastewater sludges dried in a convective rig. Drying Technology 2003, 21(8), 1507–1526.
26. Levi, G.; Karel, M. Volumetric shrinkage (collapse) in freeze-dried carbohydrates above their glass transition temperature. Food Research International 1995, 28(2), 145–151.
27. Martynenko, A. Computer-vision system for control of drying processes. Drying Technology 2006, 24, 879–888.
28. Martynenko, A. Three-dimensional imaging for density and porosity evaluation. In 8th World Congress of Chemical Engineering, Montre´al, August 23–27, 2009.
29. Kiranoudis, C.T.; Tsami, E.; Maroulis, Z.B.; Marinos-Kouris, D. Drying kinetics of some fruits. Drying Technology 1997, 15(5), 1399–1418.
30. May, B.K.; Sinclair, A.J.; Halmos, A.L.; Tran, V.N. Quantitative analysis of drying behaviour of fruits and vegetables. Drying Technology 1999, 17(7), 1441–1448.
31. Mousa, N.; Farid, M. Microwave vacuum drying of banana slices. Drying Technology 2002, 20(10), 2055–2066.
32. Jannot, Y.; Talla, A.; Nganhou, J.; Puiggali, J.-R. Modeling of banana convective drying by the drying characteristic curve (DCC) method. Drying Technology 2004, 22(8), 1949–1968.
33. Katekawa, M.E.; Silva, M.A. On the influence of glass transition on shrinkage in convective drying of fruits: A case study of banana drying. Drying Technology 2007, 25(10), 1659–1666.
34. Thuwapanichayanan, R.; Prachayawarakorn, S.; Soponronnarit, S. Modeling of diffusion with shrinkage and quality investigation of banana foam mat drying. Drying Technology 2008, 26(11), 1326– 1333.
35. Sutton, M.A.; McNeill, S.R.; Helm, J.D.; Schreier, H.W. Computer vision applied to shape and deformation measurement. In Trends in Optical Nondestructive Testing and Inspection; Rastogi, P.K.; Inaudi, D., Eds.; Elsevier Science: Amsterdam, 2000.
36. Orteu, J.-J. 3D computer vision in experimental mechanics. Optics and Lasers in Engineering 2009, 47(3–4), 282–291.
37. Sutton, M.A.; Orteu, J.-J.; Schreier, H.W. Image Correlation for Shape, Motion and Deformation Measurements: Basic Concepts, Theory and Applications; Springer: New York, 2009.
38. Robert, L.; Nazaret, F.; Cutard, T.; Orteu, J.-J. Use of 3D digital image correlation to characterize the mechanical behavior of a fiber reinforced refractory castable. Experimental Mechanics 2007, 47(6), 761–773.
39. Madiouli, J.; Sghaier, J.; Lecomte, D.; Sammouda, H. Determination of porosity change from shrinkage curves during drying of food material. Food and Bioproducts Processing 2010, doi:10.1016= j.fbp.2010.12.002, in press.
40. Garcia, D.; Orteu, J.-J.; Devy, M. Accurate calibration of a stereovi-sion sensor: Comparison of different approaches. In Vistereovi-sion, Modeling, and Visualization 2000, Saarbru¨cken, Germany, November 22–24, 2000.
41. VIC-3D1software. Correlated Solutions Inc., Columbia, SC, http://
www. correlatedsolutions.com=.
42. Khraisheh, M.A.M.; Mcminn, W.A.M.; Magee, T.R.A. Quality and structural changes in starchy foods during microwave and convective drying. Food Research International 2004, 37, 497–503.
43. Harvent, J.; Bugarin, F.; Orteu, J.-J.; Devy, M.; Barbeau, P.; Marin, G. Inspection of aeronautics parts for shape defect detection using a multi-camera system. In SEM XI International Congress on Experi-mental and Applied Mechanics, Orlando, FL, June 2–5, 2008. 44. Orteu, J.-J.; Bugarin, F.; Harvent, J.; Robert, L.; Velay, V.
Multiple-camera instrumentation of a single point incremental forming process pilot for shape and 3d displacement measurements: Methodology and results. Experimental Mechanics (in press).