HAL Id: hal-02403483
https://hal.archives-ouvertes.fr/hal-02403483
Submitted on 10 Dec 2019HAL is a multi-disciplinary open access archive for the deposit and dissemination of sci-entific research documents, whether they are pub-lished or not. The documents may come from teaching and research institutions in France or abroad, or from public or private research centers.
L’archive ouverte pluridisciplinaire HAL, est destinée au dépôt et à la diffusion de documents scientifiques de niveau recherche, publiés ou non, émanant des établissements d’enseignement et de recherche français ou étrangers, des laboratoires publics ou privés.
Distributed under a Creative Commons Attribution - NonCommercial - NoDerivatives| 4.0 International License
Graphs and tables on French CSPs Inventory
Jean-Jacques Chitrit
To cite this version:
Jean-Jacques Chitrit. Graphs and tables on French CSPs Inventory. [Technical Report] European Union. 1997, 17 p. �hal-02403483�
t
t
RESEARCH PROIECT
IN
THEFRAMEWORK
OFTHE
EU-FAIR PROGRAMME
MARKET
EFFECTS OF COUNTRYSIDE STES/ARDSHIP POLICIES(FArR1-CT9s-070e)
GRAPIIS
AND TABLES
ON F.RENCH
CSPs
INVENTORY
Jean-Jacques
Chitrit,
Chantal GuerrierINRA-ESR Rennes, Environment
Policy
and RiskUnit
December 1997 I
I
r
Il"
tr' I { !I
l tï
I AbstractThis report presents the results of task 2 of the
project,
"inventory and classificationof
Countryside Stewardship
Policies
" (CSPs).It
is based on some graphics and tablesdrawing
up on the
dffirentfieldname
of the survey qaestionnaire :c
Policy
details (tables 2, 31 4, 5, 6, 7 and 8)o Responsible
Authorities
(table 9)o
Financial
aspects (table 10)o Extend
of andertaking
(table 11)o
Markets
(tables 12 and 14)o Technical aspects (tables 13
and
15) o Gent matrixes(table
16).For
eachof
them, measures under 2078/92 regulation aredffirentiated from
otherspolicies.
Graphics show the increasing of CSPs surveyed during the three last programm-years
1993/1996: extend
of undertakingfor
2078/92 measures (graphs 1 to 3) and others crossingdffirent
classification keys aspolicy
objectives, target areas andpolicy
tools (legal
nature,policy
measures)with
quantitative informations: areas andfunds assigned (graphs 4to
6).r'
I T l1I-[,
2
lt-
r-l r=r'
-
r-L f- i-I L I t t ! t[;
rt"
L-r I f-i I Summary 2- graphic 1-: Extend of undertaking , the case of Grassland premium... ...4
- graphic 2: Extend of undertaking , the case of Zonal
measures
...4- graphic 3: Extend of undertaking , the case of Local programms ...4
- graphic 4: areas and funds assigned to voluntary CSPs per main objective... 5
- graphic 5: areas and funds assigned to voluntary CSPs per target area...5
- graphic
6:
areaunder mandatory CSPs per mainobjective
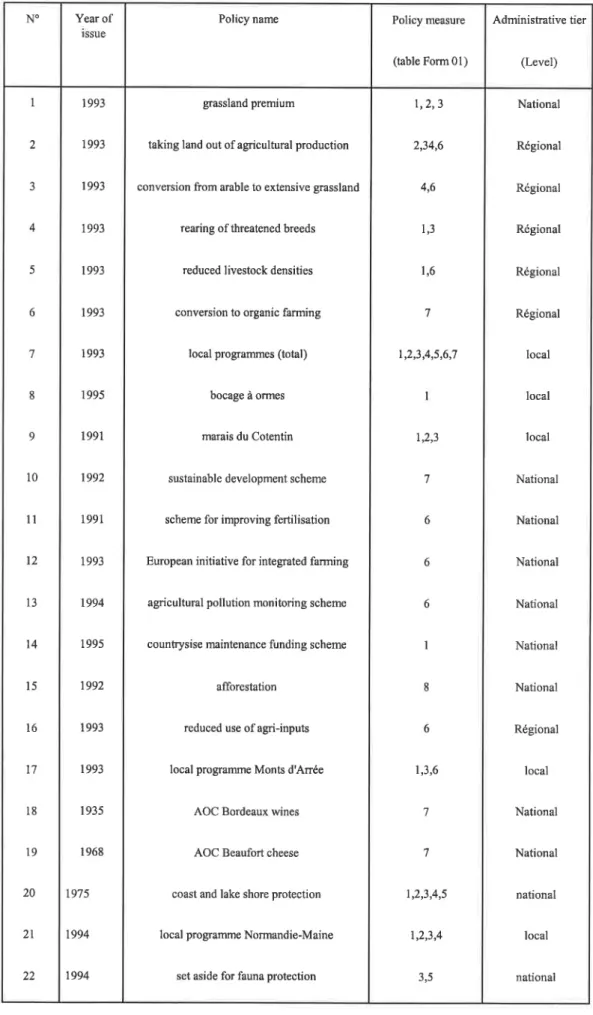
... 5- table 1:
List
of policies surveyed 6 - table 2: Policies by administrative tier... - table 3:Links
with
specific programmes... - table 4: Number of CSPswith
more than one objective... ...7..,...7
...8
- table 5: Frequency of objectives in the policies surveyed 8 - table 6: Frequency of the main objective in the CSPs surveyed... - table
7:Target
areas of the surveyed CSPs... - tables 8: Legal nature (tabtes 8a, 8b), Measures of the policy(tables 8c to 8e ) - table 9 : Authorities involved... ....,9...9
...10-11 ...12
- table 10: Funds sources... - table
11:Uptake....
- table 12:Agnatltural
markets affectedby
CSPs... ... 13... 13
I4
- table 13: Technical aspects of the CSmeasures...
... 15- table 14:
Marketability
of Environmental Goods Services (EGS) produced... 15- table 15: Relationship between EGS and agricultural products
l6
- tables 16:Gent matrix for CSPs' analysis and
classification
...1,7f-'
Graph I - Extend ofudertaking for 2078/92 Fr€nch measures : Case ofGrassland premium
ha æ6 6.0m.000 5.8m.000 5.600.000 5_4m_m0 5.2m.000 5.0m.mo 1993/94 t995 t996
Graph 2 - Exiend of undertakin e fot 2078/92 French measures : Case of Zonal measures
(cumulated daa) ha ecLs 120.000 20.000.000 240.000.000 220.000.000 200.000.000 180.000.000 160.000.000 140.m0.000 120.000.000 1m.000.000 N ecus Bl ha 100.m0 80.m0 60.000 40.000 20.000 15.000.0m 10.000.000 5.000.000 30.000.000 25.000.000 20.000.000 15.000.000 1993194 t995
Graph 3 - Exiend ofurderAking for 2078/92 French measures : Local programs
(cumulaæd <lata) ha cc6 1996 450.000 400.000 350.000 300.0m 250000 200.0m 150.000 100.000 4 N æus Eha
t
N accuha 1993/94 1995 19% 10.000.0mr
IT'
raph 4 - Funds assigned and area under volontary CSPs per main objective
ha æN 6.000.m0 250.0m.m0 5.ofr).0m 2000m.m0 4.m.m0 150.m.m0 3.000.000 100.000.m0 2.000.000 1.000.000 50.000000
l@dæN av@ wildcons rærqtion reduct qurlity conv6
Graph 5 - Fund assigned and area under voluntary CSPS per target areas
6.000.000 250.0m.000 5,000.000 200.000.000 4.000.000 150.000,000 3_m0.000 100.000.000 2.000.m0 L000.000 50.000.000
wholecomty sprrificôdminisf. sp@iicledûse spoific gægraphic specific d6igût
Graph 6 - Area under mandatory CSPs per main objective and target area
ha r c
r
i t Nl ecus tha N ecus Eha f,t I L I t-I T-F t t r I t 5f'
L
I ft,
L
L
IL
L
L
4tm0 20000 m.000 80.000 60.000 4t000 20m0 spæiflc gægmph sil pml4lionspæific lald use quâlity label
t {
r
Ir
i tr I i t_i I t f"' i r-IF
r-tt-
! I r If-L
I {,-I It,
I t l-It.
![,
( L.L
I [-IL
f {L-Table
I
-List
of policies surveyed (databasefile
Questio.mdb) :National Régional Régional Régional Régional Régional local local local National National National National National National Régional local National National national local national 1,2,3 2,34,6 4,6 1,3 1,6 7 t,2,3,4,5,6,7 1,,2,3 7 6 6 6 I 8 6 1,3,6 7 7 t,2,3,4,5 1,2,3,4 3,5 gtassland premium
taking land out ofagricultural production
conversion from arable to extensive grassland
rearing of threatened breeds
reduced livestock densities
conversion to organic farming
local programmes (total)
bocage à ormes
marais du Cotentin
sustainable development scheme
scheme for improving fertilisation
European initiative for integrated farming
agricultural pollution monitoring scheme
countrysise maintenance funding scheme
afforestation
reduced use of agri-inputs
local programme Monts d'Arrée
AOC Bordeaux wines
AOC Beaufort cheese
coast and lake shore protection
local programme Normandie-Maine
set aside for fauna protection 1993 1993 1993 t993 I 993 1993 I 993 1995 1991 1992 1991 1993 1994 I 995 1992 1993 1993 1935 1968 l97s 1994 t994 1 J 3 4 5 6 7 8 9 10 1t 12 13 t4 15 t6 l7 18 19 20 2l 22 Administrative tier (Level) Policy measure (table Form 01) Policy name Year of lssue NO 6
r-li
.
Policy
detailsTable 2 - Policies
by
administrativetier
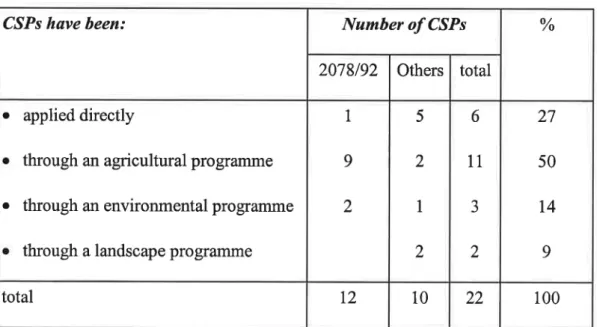
Table 3 -
Links
with
specific programms ( I ! t. r-t t l' ( II
Ii,
r t-i t f["
I j I-r i-100 22 10t2
total4t
4t
18 9 9 4 8 2I
7 4o
Nationalo
Regionalo
Local % total Others P.2078192Administrative
tier
Numberof
CSPs100 22 10
t2
total 27 50l4
9 6 11 J 2 5 2I
2I
9 2.
applieddirectly
o
through an agricultural programme.
through an environmental programmeo
through a landscape programmeo//o
total
Others 2078/92
C^SPs have been:
Number
of
CSPsr
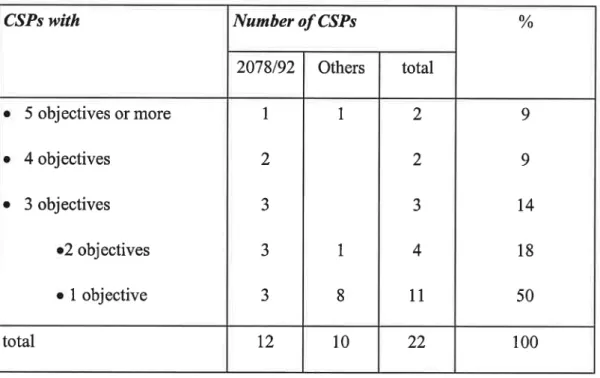
llTable 4 - Number
of
CSPswith
more than one objectiveTable 5 - Frequency
of
objectives in the policies surveyedr/
li N lr* I Ir'
Ir.
I I t-I t It"
t If'
f iL
I Il
It.
IL
fL
I x 1 100 22 10t2
total
9 9l4
18 50 2 2 J 4 11 1 1 8I
2 J J J a 5 objectives or moreo
4 objectivesr
3 objectives o2 objectives o 1 objective % total Others 2078192 CSPswith
Numberof
CSPs 45 274t
23t4
4l
23 5 10 6 9 5 J 9 5I
a J 2 2 1 2 a J J 1 7 4 7 4I
6 2o
Landscape conservationo
Environment conservationo'Wildlifeconservation
o
Soil conservationo
Recreationo
Reduction of negative impactso
Quality labelso
Conversion of agricultural land7o of surveyed CSPs
total
Others 2078192
Objectives
Number
of casesr
lI
r
ln
I t I rn at [-Ifr-lr
(-tIr
{1 F I T til
fL
t,,L
fL
t-,.L
{;
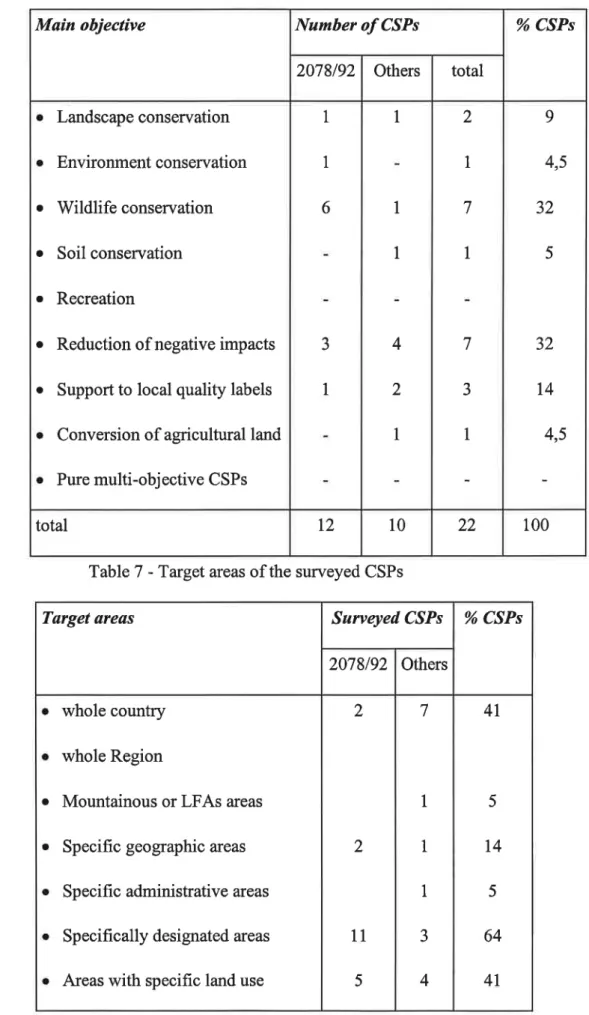
L-100 22 10 T2 total 9 4,5 32 5 32t4
4,5 2 1 7 1 7 J 1 1I
I
4 2 1I
1 6 J 1o
Landscapeconservationo
Environmentconservationo
Wildlife
conservationo
Soil conservationo
Recreationo
Reduction of negative impactso
Support to local quality labelso
Conversionof
agricultural lando
Pure multi-objective CSPs%
CSPstotal
Others 2078192
Main
objectiveNumber
of
CSPsTable 6 - Frequency of the main objective in the CSPs surveyed
Table
7
-Target areas of the surveyed CSPs4l
5t4
5 644t
7 1 1 1 J 4 2 2 11 5o
whole countryo
whole Regiono
Mountainous orLFAs
areasa Specific geographic areas
o
Specific administrative areaso
Specifically designated areaso
Areaswith
specific land use% CSPs
Others 2078/92
Target areus Suweyed CSPs
r
l["
t { iI
I r1 II
rr
t ir-l tr'
r t r-FIr
f t I h, It
t t[,
I It
L
I L; IL
L
Table 8a. - Legal nature
of
surveyed CSPsTable 8b - Regulation and definition/assignement of property rights
100 22 10
t2
totâl 86,5 64 13,5 9t9
t4
J 2 7 2 J 2t2
t2
Volontary o Financial measurcs o Market measures a Persuasion measutes 13,5 J 3 2 1 Mandatoryo Regulalion and def/ass, ofproperty rights
o Land purchase by public bodies
o Land management by public bodies
o Land purchase by wildlive proteclion lunds/lrusts
c Land management by wildlive proleclionfunds/tru.
%
CSPstotal
Others 2078192
Policy
tool
Numberof
CSPs27 32
4t
J 2 5 J 5 4o
Land use contrainto
Environmental standartso
Technical standarts/code ofpracticeso
Authorisations/concessionso
Physical planning by local authorities% CSPs
Others 2078192
Surveyed CSPs
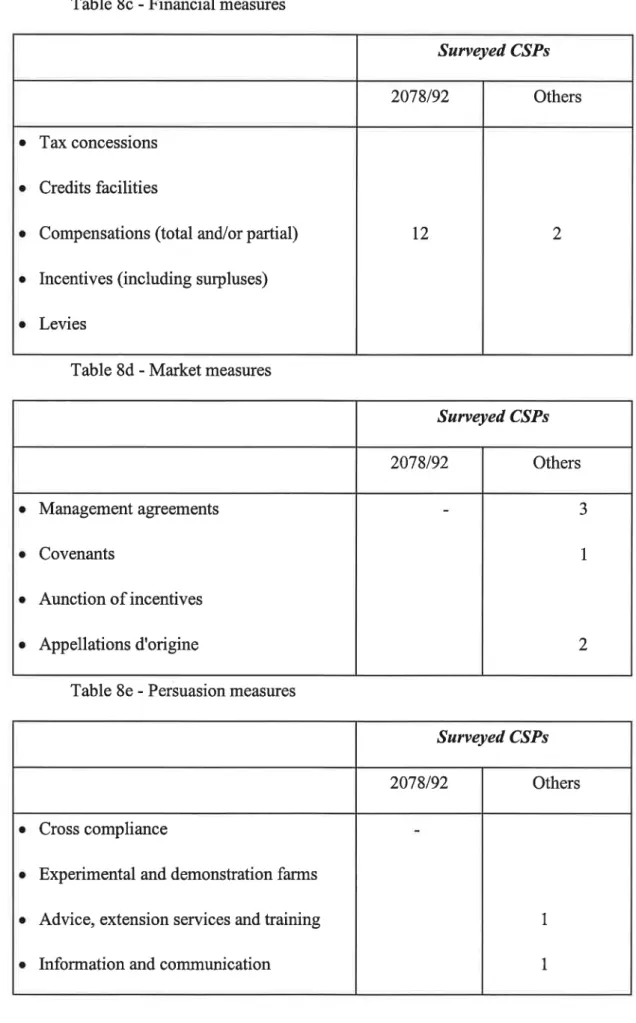
Table 8c - Financial measures
Table 8d - Market measures
Table 8e - Persuasion measures
r
Ir
Ir
l I tr
It-i
l-t L I I L IL
r'
i. r-I L] lr r-, I ( ["r t I rt.
lr
[., Ii
IL
L
I IL
L
2t2
o
Tax concessionso
Creditsfacilities
.
Compensations (total and/or partial)o
Incentives(including
surpluses)o
Levies Others 2078192 Surveyed C^SPs JI
2o
Managementagreementso
Covenantso
Aunction of incentives.
Appellationsd'origine
Others 2078192 Suweyed C,SPsI
1o
Cross complianceo
Experimental and demonstration farmso
Advice, extension services and trainingo
Information and communicationOthers 2078192
Sarveyed CSPs
fft t- L
-Tl
it-
T---': a I ti- r* r- r:
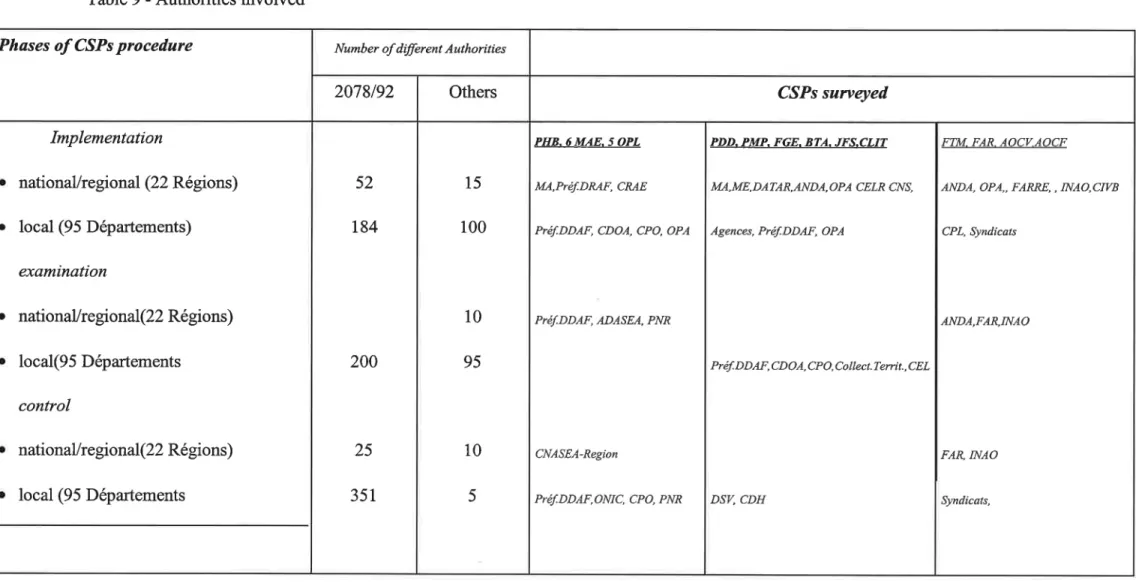
o Responsible
Authorities
Table 9 - Authorities
involved
Implementation
o
nationaVregional (22 Régions)o
local (95 Départements) examinationo
nationaVre glonaIQ2 Régions)o
1ocal(95 Departementscontrol
o
nationaUre gional(22 Régions)o
local (95 Départements Phasesof
CSPs procedure 52r84
200 25 351 2078192Number of diferent Authorities
15 100 10 95 10 5 Others PHB,6 MAE.5 OPL MA,Prëf.DMF, CME
Préf.DDAF, CDOA, CPO, OPA
Préf.DDAF, ADASEA, PNR
CNASEA-Region
Préf. DDAF,ONIC, CPO, PNR
C,SPs survEled
PDD. PMP. FGE. BTA. JFS.CLIT
MA,ME, DATAR,ANDA,OPA CELR CNS,
Agences, P réf. DDAF, O PA
Préf. DDAF, CD OA, C P O, C o llect. Territ., CEL
DSV, CDH
FTM. FAR. AOCV.AOCF
ANDA, OPA,, FARRE, ,INAO,CIT/B
CPL, Syndicats
ANDA,FAR,INAO
FAR, NAO
Syndicats,
r* rT rî rT r:: n-
cT
!TN
-=
T-ï
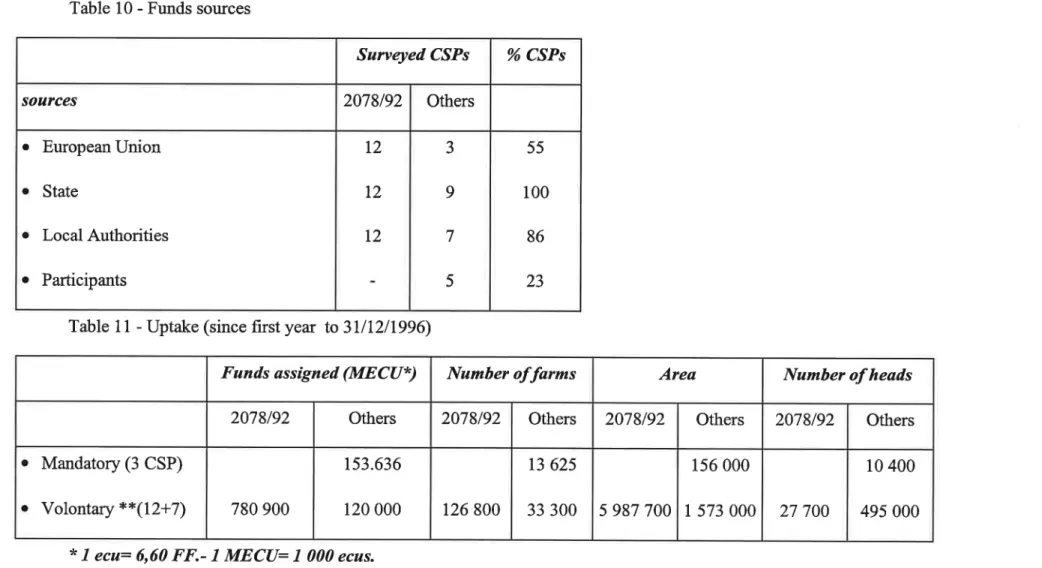
I AoFinancial
aspects and extentof undertaking:
Table 10 - Funds sources
Table 11 - Uptake (since
first year to
3111211996)* 7 ecu= 6,60
FF.-
1MECU:1
000 ecus.r
EuropeanUnion
o
Stateo
Local Authorities a Participants soarces T2t2
T2 2078192 Surveyed C,SPs J 9 7 5 Others 55 100 86 23%
CSPso
Mandatory (3 CSP)o
Volontary **(12+7)
780 900 2078/92Funds
assigned(MECU*)
1s3.636 120 000 Others 126 800 2078192
Namber
offarms
13 62s 33 300 Others s 987 700 2078192Area
156 000I
573 000 Others 27 700 2078192Namber
of heads 10 400 495 000 Others**
included total localprogramm
but not thefour
examplesfor
theseprogramm.
f- r- t- r- r* rT f:*
r
.
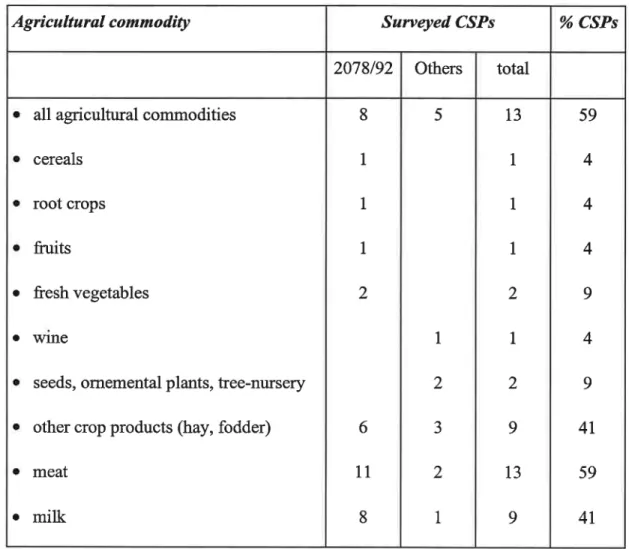
Market
andMarketability
of EGSlinked
to stewardshippractices:
Table 12 -
Agricultural
markets affectedby
CSPsI
-t
t
T
I-*:j
---1
:-o
all agricultural commoditieso
cerealse
root cropso
fruitso
fresh vegetables.
wlne.
seeds, ornemental plants, tree-nurseryo
other crop products (hay, fodder)o
meato
milk
Agricultural
commodity
8 1 1 1 2 6 11 8 2078192 Suweyed C,SPs 5 1 2 J 2 1 Others 13 1 1
I
2 1 2 9 13 9total
59 4 4 4 9 4 9 4L 59 4T % CSPs T4i:: rT t- r
rî r:t rT r:
t-n
î::')
*1--t1
-':
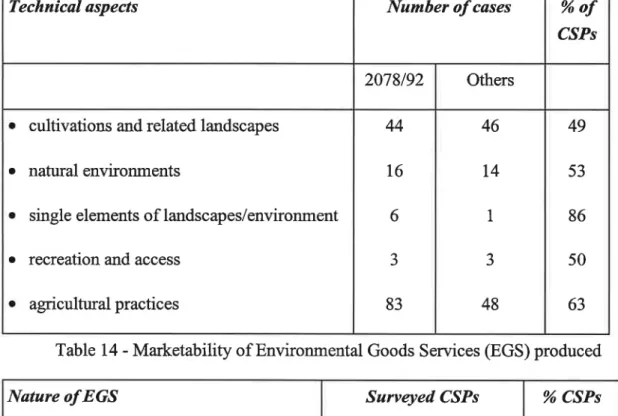
Table 13 - Technical aspects of the CS measures
Table 14 -
Marketability
of Environmental Goods Services (EGS) producedo
cultivations and related landscapeso
natural environments.
single elementsof
landscapes/environmento
recreation and accesso
agnculturalpractices Technical aspects 44 T6 6 J 83 2078/92Number
of cases 46 T4 1 J 48 Others 49 53 86 s0 63%of
CSPs.
already marketedo
potentially marketableo
not marketableNature
of EGS 2 0 10 2078/92 Sarveyed C,SPs J a J 4 Others 5 J 14 total 23t4
63 % CSPs 15i:_ -- r- t- rî r--
r*:
f-:-ï-l
..JT-*1
--1 --j
:-t
I
o Jointness between
Environmental
Goods and Services and Cuontryside Stewardship Table 15 - Relationship between EGS and agricultural productsNon
competitive:r
CS and related EGS as a production factoro
CS and related EGS as incidental by-product Competitiveo
CS and related EGS as intentional product.
CS and related EGS as the main producto
CS and related EGS as the only product Answer not possibleTotal
Nature
ofEGS
5 4I
6 J J 1t2
2078/92 Sumelted C,SPs 5 2 J 5 JI
I
10 Others 10 6 4 11 6 1 4I
22 total 45 27 18 50 27 5 18 5 100 %%
CSPsI6
L
-l]
lTable 16 - Gent
matrix
for analysis and classificationof
CSPs - area (ha)or livestock
(LID
per legal nature and objectivePOLICY
MAIN
OBJECTIVE
o
Regulation/assignement of property rights.
Land purchase/management by public bodieso
Land purchase/management bywildlife
trustso
Compensationso
Others financial measures (tax concessions,...)o
Managementagreementso
Others markets measures (Covenants,...) oPersuasionLEGAL
NATURE
167 200 70 831 Quality labels 1<.-
market ase-value 5 550 Convers. ofagric. land 2 27 000 Soil protect. J 24 200 Recreat. 4 495 000 LU 82 400 ha, 17 500 LU 1 s06 500 Reductionof
impacts 5non market non use-valae----)
252 000 Landscape conservation 6 41 800 ha,4 500 000 LU 5 427 000 Environment conservation 7 281 000 Wildlife conser 8 T7