B A
S E Biotechnol. Agron. Soc. Environ. 2010 14(2), 321-340
Cambodian peasant’s contribution to rural development: a
perspective from Kampong Thom Province
Jean-Christophe Diepart
Univ. Liege - Gembloux Agro-Bio Tech. Economy and rural Development Unit. Passage des Déportés, 2. B-5030 Gembloux (Belgium) – German Development Service. PO Box 628. Phnom Penh (Cambodia). E-mail: jc_diepart@online.com.kh. Received on 9 August 2008; accepted on 4 December 2009. The paper aims to identify the rationality of peasant communities and their contribution to rural development in Kampong Thom province. To do so, an interdisciplinary analytical framework addresses the dynamics of land use and land tenure, the strategies of labor force allocation as well as the determinants of land and labor agricultural productivities amongst peasant communities. It rests on details field surveys in two communes located in very distinct agro-ecological settings of Kampong Thom province. A land use change analysis based on time-series aerial photos is conducted with participatory inventories of natural resources. It shows that endogenous management of forest and fisheries resources generate significant incomes and, at the same time, contribute to maintaining biodiversity. The paper analyses how this contribution is challenged by the non-peasant actors involved in massive State land privatization. Aiming to full employment, peasant households enjoy a great flexibility in the way they allocate labor force, especially in line with the age of active labor and the fluctuation of labor opportunity costs. Principally due to an unequal land holding distribution, agricultural income is unfairly distributed but this inequality is actually balanced by the access to common-pool resources of crucial importance for the poorest and by the recourse to non farming activities, which is an important factor of socio-economic differentiation amongst households. The main economic indicators of rice production confirm that peasant households always try to maximize their income in step with the production factor they have in relatively less amount. A land market simulation stresses that, contrarily to theoretical assumptions, land access through sale (and purchase) does not result in a fairer land distribution. Nevertheless, land leases amongst peasant households seem more promising to ensure equitable access to land as they are embedded in collective security mechanisms activated by peasantry. The paper argues that peasant communities in the studied area constitute a solid basis for rural development as they offer a very good articulation between economic efficiency, social justice and environmental sustainability. Finally, recommendations are formulated to properly address peasant contribution to rural development in the new national agrarian policies.Keywords. Agricultural economics and policies, decision rules, farming systems and practices, geographic information system and remote sensing, land tenure, rural development, sustainable natural resources management, rural livelihoods, rural sociology, Cambodia.
La contribution des paysans cambodgiens au développement rural : une perspective à partir de la province de Kampong Thom. L’article vise à identifier la rationalité de la paysannerie et sa contribution au développement rural dans la province de Kampong Thom. Pour ce faire, un cadre analytique interdisciplinaire appréhende les dynamiques d’occupation du sol et des régimes fonciers, les stratégies d’allocation de la main-d’œuvre et les déterminants de la productivité de la terre et du travail agricole. Il se base sur l’étude approfondie de deux communes localisées dans des environnements agro-écologiques bien distincts. Une analyse de changement de l’occupation du sol à partir d’images aériennes chronologiques est couplée à des inventaires participatifs de ressources forestières et halieutiques. Elle montre que les modes de gestion endogène de ces ressources génèrent des revenus importants tout en étant soucieux du maintien de la biodiversité. L’article analyse également comment ils sont menacés par l’intervention d’acteurs non paysans impliqués dans la privatisation massive des terres d’État. À la recherche du plein emploi, les ménages paysans jouissent d’une très grande flexibilité dans l’allocation de leur main-d’œuvre, en particulier en fonction de l’âge des actifs et de la fluctuation du cout d’opportunité du travail. La variable « revenu agricole » est fortement concentrée en raison de la répartition inégale de la terre. Cette inégalité est atténuée d’une part par l’accès aux ressources communes qui est crucial pour les plus pauvres et le recours aux activités non agricoles qui constitue un véritable moteur de différenciation socio-économique. Les indicateurs économiques clés de la production rizicole confirment que les ménages cherchent toujours à maximiser leur revenu agricole en fonction du facteur de production dont ils disposent en relativement petite quantité. Une simulation des transactions foncières montre que, contrairement aux suppositions théoriques,
Biotechnol. Agron. Soc. Environ. 2010 1. INTRODUCTION In the last 30 years relations between the State, peasantry, and the markets have undergone dramatic changes in Cambodia. The recent historical context of agricultural development is a succession of transformations, each of them determined by a complete restructuring of the institutional, socio-economic, cultural and technical dimensions of agrarian systems.
Between 1975 and 1979, the attempt to modernize agriculture by the Khmer Rouge regime was not done in cooperation with the peasantry, but was imposed on them by the State. The political, ideological and technical means used during the Democratic Kampuchea (DK) period to force the peasantry to a primitive accumulation in the agricultural sector led, ex nihilo, to major inconsistencies between the State and the peasantries, resulting in the stagnation of the agricultural sector as a whole (Vickery, 1984; Thion, 1993). In the post DK era, the transition from war to peace was achieved mainly through the modernization of the agricultural sector on the basis of more flexible production units, the Krom Samaki groups1, carried mainly by a relatively strong peasantry if compared to the role of the State and the markets (Grunewald, 1987). Later, in the mid-eighties, the dismantling of cooperative groups and the re-emergence of a free market economy has further modified the conditions of the modernization of the peasantry through the implementation of liberal policies, legitimated in the belief that property rights reform, price liberalization and the gradual privatization of enterprises would result in improved agricultural productivity and, consequently, the well-being of the rural population (Watts, 1998). Nowadays, the State is progressively withdrawing from its function of regulator and investor, while the market and the private sector have become the main driving forces for rural development.
The current market-based agrarian transition processes are accompanied by a number of institutional shifts materialized in a set of new legal and policy documents. The cornerstone of these documents is the new land law, which defines different land property domains (MLMUPC, 2001; East-West Management Institute, 2003). In line with the land law, different land tenure regimes are envisioned and captured in relevant land or natural resources management policies. The State domain is where appropriation, management and control of land and natural resources are carried out through the State agencies (Kirk, 2000). The State private land consists of land that the State can use as a private asset and sell or lease to the private sector (national or international companies) as concessions. The State public land consists of land that serves public purposes and cannot be sold to the private sector as such. In rural areas, this land consists mainly of forestry and fisheries resources and its management is intricately linked to the reforms in these sectors. Indeed, with the recognition of failure of natural resources management through the forestry and fisheries large private concessions system in the late 1990s, and in accordance with the overall governance policy of promoting de-concentration and decentralization, the State has been promoting certain forms of devolved natural resources co-management with rural communities, namely Community Fisheries and Community Forestry organizations. While these community-based organizations are granted certain rights and prerogatives for the management of forestry and fisheries resources, they remain dependent on State agencies for their own decision-making processes (Van Acker, 2003; Mak et al., 2005). The private domain of land encompasses land where peasant families can claim ownership title on the land they farm or live on. The land law promotes the titling of private land to grant security of tenure and stimulate the investment and the access to agricultural inputs markets to boost agricultural productivity. The land markets (purchase, sale and lease) are also promoted in order to facilitate land transfer amongst rural households and to guarantee the equity of land access for the poorest peasants (CLP, 2002; Deiniger et al., 2002). The challenge at stake is the definition of the place and role of peasantry in the new institutional settings. At les achats et ventes de terre ne mènent pas à une distribution plus équitable des terres. Les modes de faire-valoir indirects semblent cependant beaucoup plus prometteurs dans la perspective d’un accès plus juste à la terre car ils se fondent sur des mécanismes de sécurisation collective activés par les paysans. L’article montre que les communautés paysannes dans les régions étudiées constituent une base solide pour le développement rural puisqu’elle offre une très bonne articulation entre l’efficacité économique, la justice sociale et la durabilité environnementale. Enfin, des recommandations sont formulées pour valoriser au mieux la contribution de la paysannerie dans les nouvelles politiques agraires nationales. Mots-clés. Économie et politique agricoles, système d’information géographique et télédétection, gestion durable des ressources naturelles, régime foncier, pratiques culturales et systèmes de production agricole, moyens d’existence des populations rurales, développement rural, sociologie rurale, règles de décisions, Cambodge. 1 Krom Samaki is the Khmer translation for Solidarity Group. The system of Krom Samaki was that a group of 10 to 15 families worked cooperatively and share their production.
times subordinate to markets and at times subordinate to State, Cambodian peasants are not, at this stage, clearly identified as key actors in rural development in Cambodia. The objective of the article is to identify the peasant’s rationality and participation in the development of the agrarian systems in Kampong Thom province. In the context of agrarian transition, key messages with policy implications will be formulated. The central hypothesis underlying the paper is that peasant modes of development in rural areas offer greater potential for rural development in terms of economic efficiency, social justice and environmental sustainability. 2. METHODOLOGY 2.1. Study areas Kampong Thom province is one of the five provinces connected to the Tonle Sap Lake. Its area dramatically increases in the rainy season due to the reversal of the Mekong river water flow that seasonally becomes a tributary river of the Tonle Sap river basin. Figure 1 (p 326) shows an agro-ecological zoning of the province. It stretches from the flat Tonle Sap flood plain (consisting of a sequence of flooded forest, shrub and grassland) to the agricultural zone where the villages are located, to the slightly undulating dry shrub land and then to the forest area (a mosaic of dry, semi and evergreen Dipterocarpacea forest). The research process started with a description of agrarian systems at provincial level. This allowed the differentiation of communes for more fine-tuned field investigations and surveys. Srayov and Trapeang Russei communes were eventually selected because: – they capture the agro-ecological diversity observed at the provincial level;
– they are located not too far from Kampong Thom city to tackle rural-urban linkages;
– because a forest cover change analysis detected recent land cover changes.
2.2. Scope and methods
The research took place in three distinct phases, each focusing on specific dimensions of peasant’s dynamics.
The first phase deals with the dynamics of land use and land tenure on both State and private land. It has been initiated on the basis of time series aerial photos from 1992 (aerial photos from the eighties were not available) and 2004. The digitization and interpretation of aerial photos (at a scale of 1/5,000) have generated two land use layers that were topologically intersected in a geographic information system to generate a land use change layer. Land use information from 2004 was updated for the 2006 situation though detailed GPS surveys. After preliminary data processing, consultative workshops (2 days per commune) were organized with all local authorities at village and commune levels in order to interpret the land use changes identified. The discussions are conducted by using qualitative and quantitative questionnaires and by asking the participants to comment the land use changes maps printed on A0 size paper. They are facilitated by the researcher and a group of students from the Royal University of Agriculture. Then, participatory forest inventory and vegetation surveys are conducted with villagers to understand their management of forest and fisheries resources. The forest inventory is conducted in Trapeang Russei on 11 sample plots identified in different forest type areas (sampled area represent 1% of the total forest area size) with participation of local community’s representatives who identify timber and non-timber species, specify their use and comment their availability trend. In Srayov, vegetation surveys are conducted along two main transect walks that cross the flooded area from North to South and from East to West. Wet land resources are inventoried with participation of local fishermen, who describe the flood patterns, identify the key fish species and detail the land use change in the area encircling each main fishing ground. Finally, household investigations using semi-structured questionnaires are conducted with a household sample selected in locations where land use changes were detected during the spatial analysis (6 villages, 103 households) (Table 1). Key informants and local key stakeholders were also interviewed using a semi-structured questionnaire (62 people, 34 in Srayov and 28 in Trapeang Russei).
The second phase focuses on the organization of family-based labor in farming, off-farm and non-farm activities. This part of the research is exclusively based on household investigations (Table 1) using a structured
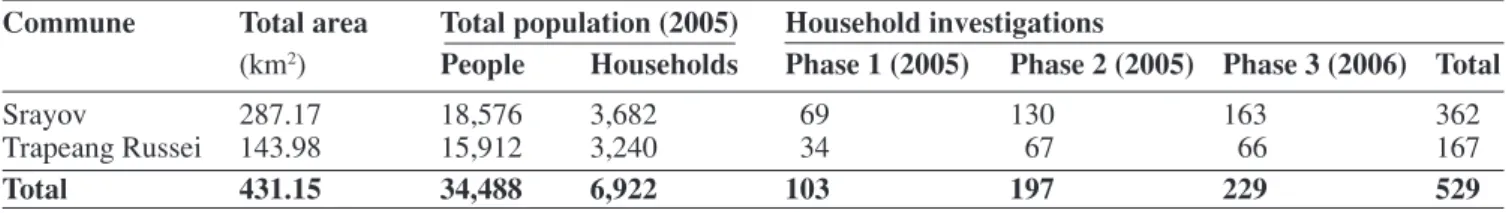
Table 1. Household surveys design — Dispositif des enquêtes ménage.
Commune Total area Total population (2005) Household investigations
(km2) People Households Phase 1 (2005) Phase 2 (2005) Phase 3 (2006) Total
Srayov 287.17 18,576 3,682 69 130 163 362
Trapeang Russei 143.98 15,912 3,240 34 67 66 167
Biotechnol. Agron. Soc. Environ. 2010
questionnaire. A stratified random sampling method was used to select a group of household’s representative of the whole commune (6 villages, 197 households). The investigation is conducted by the researcher and a group of 4 students from the Royal University of Agriculture. In order to assess the existing differences in labor allocation strategies, primary occupations were detailed through quantitative investigations for all active members of households (n = 1,818 people). A person was regarded as active in any given activity if he/she was active for at least seven days in the month and is counted as 1 man.month. For the calculation of household incomes, the family-based labor costs were not taken into account.
The third phase apprehends the determinants of land and labor productivities for the rain-fed rice production. They are addressed in line with the structure and functioning of land markets. This phase is also exclusively based on household investigations, using a structured questionnaire and conducted by the researcher and a group of 6 students from the Royal University of Agriculture. The surveys take place in two villages selected according to their distance from the national road: one village along the national road No 6 and one further in the flood plain in Srayov or in the upland in Trapeang Russei (Table 1). The sample was constituted by selecting a highly representative group of households in each village (4 villages, 229 households). The database allows the structure and functioning of the land market to be quantified in line with the land-labor endowment ratio. Different modalities of entry in the land markets are envisioned: land sale, land purchase, land clearance and land rental. The database details, for each transaction, the land area size, the year and reason of sale and the agreed price. A land-labor simulation model was then built to reconstruct the land trajectories of the households at the moment when they enter the land market. The land/labor ratio is determined by the total land size area divided by a household’s weighted active labor. One person aged between 8 and 17 counts as 0.5 labor unit; one person aged between 17 and 60 counts as 1 full unit of labor; and people aged older than 60 are counted as 0.5 labor unit.
3. RESEARCH FINDINGS AND RESULTS 3.1. Dynamics of land use and tenure
The use of substantial areas has changed between 1992 and 2004 in both communes: 15% and 7% in Srayov and Trapeang Russei communes, respectively. As illustrated in figures 2 and 3 (p 327), these changes mark a huge print in the landscapes. This is regarded as evidence of changes in local agro-systems and in land
governance. Types of land use change were further analyzed according to four main driving forces: – the demographic pressure increasing demand for rice;
– the modalities of State withdrawal from its direct support to peasantry;
– the endogenous management of common-pool resources by rural communities;
– the increasing influence of non-peasant actors in rural areas.
State support to peasantry. In the context of the dramatic population growth that occurred in the early eighties after the Khmer Rouge regime, the main challenge for peasantry has been to increase food availability and family incomes. This means that total agricultural production needs to increase at a pace at least consistent with the population growth rate. In the studied area, this key challenge was combined with the different forms of State intervention and, later, with different modalities of State withdrawal.
In Srayov, the population grew at an average annual rate of 1.57% between 1992 and 2005 (NIS, 2007). The need to produce more rice to feed this growing population is associated with State withdrawal from its direct and indirect support to farmers. In the eighties, the State put considerable effort into supporting the farmers to cultivate deep water rice, a photo-periodic variety of late-maturing paddy well adapted to high water depth and not very demanding in terms of labor and capital input. The State largely subsidized the production (soil preparation and harvest) as well as guaranteed paddy prices at the farm gate (Pel et al., 2002). This direct support was done through the Krom Samaki production units. These were particularly active in Kampong Thom (in Srayov in particular) due the large flooded areas and contributed a significant amount of rice for consumption inside the province. The production surplus was transferred through the Krom Samaki system to non self-sufficient rice areas. Since the official disbandment of the Krom Samaki production units and its direct support to farmers, the peasant household had become the core unit of agricultural development. Quickly, they decided to abandon the deep-water rice production and relocated their rice-production effort to the rice plains of the commune in medium rice (Figure 2) due to security reasons and the long time spent in accessing plot sometimes located 30 km from where they lived.
Household investigations focusing on their evolution during these mutations revealed that the families reduced areas under cultivation, but while the distance from plot to their habitation has decreased, they could significantly increase their land productivity by intensifying their labor (number of hours per worker) and their cropping systems. The total production of
paddy per household showed an overall decrease but remained sufficient to provide food for the population. An average of 1,146 kg per family ensures rice security for one year for a family of six people (500 g rice per day per person) (Table 2). In Trapeang Russei, the situation is different as the armed conflicts between the Khmer Rouge resistance and the national army ended very late in the area. With the real ceasefire proclaimed in 1998, people and especially the Kouy ethnic minority group were allowed to re-settle their communities in the areas they had to leave as a result of armed conflicts with the Khmer Rouge army. This had become shrub land in the meantime. These migration flows occurred inside and outside the commune and have led to a considerable redistribution of the population across the whole area of the commune. Coupled with a natural increase of the population, the total demographic increase has been 0.77% per year on average between 1992 and 2006 (14,249 to 15,912 people). Besides the much-awaited socio-political stability, the ceasefire had serious consequences for the development of the cropping system in the area. The water dam that kept large agricultural areas flooded to prevent KR rebellion from accessing Kampong Thom city was destroyed and, within one season large areas were made available again for agriculture (Figure 3). Peasant families have spontaneously extended their rice-based cropping system in these new lands.
Endogenous management of Common-Pool Resources. Another driving force that has contributed to shaping the rural landscapes in the studied areas is the endogenous management practices of common-pool resources by peasant communities. The Tonle Sap floodplain in Srayov (south of the commune) and the mosaic of forest patches in Trapeang Russei (north of the commune) constitute these common-pool resources that should be considered as Public State land under the new land law. In both communes, the common-pool resources, though under government authority if referring to the new land law, were mainly under the management of peasant communities. This is due to the fact that the government usually lacks both financial and human resources to monitor these resources effectively (Ostrom, 1990). In Srayov, the southern plain is characterized by a mosaic of patches in which both increased density and degradation of shrub and grasslands can be observed (Figure 2). Further investigations at the household level and transect walks organized with farmers have provided detailed information on how peasants are actually managing this seasonally flooded area. The plain is characterized by continually changing land use patterns ranging from rice cultivation (at the edge of the plain), grassland used for grazing cattle, and shrub land where a variety of non-timber forest products can be collected (Evans et al., 2005; Diepart, 2007a). This diversity of land use is maintained through a variety of practices such as fire, plowing, allowing lying fallow, or grazing with the objective of ensuring a flexible and diverse supply of natural products of crucial importance to the local livelihoods, while maintaining the fertility of the overall agro-ecosystem (Diepart, 2007a; 2007b). The system is rational. The different rice cropping systems are adapted for different water depths and encompass very important aquatic biodiversity (Balzer et al., 2002). The grass is crucial as fodder for the cattle that generate significant part in the farming income portfolio, and the shrubs are also important for the energy supply of households (i.e. firewood). Fishing in the ponds of the receding flood plain is part and parcel of this management, aiming at maintaining multi-functional agro-ecosystems. Tragedy of the common, in the sense of Hardin (1968) is avoided due to low population pressure on land (64 people per km2 in Srayov), which enables the reproduction of land fertility and reduces the risk of conflicts between resources appropriators.
In Trapeang Russei, the main feature was the diminution/increase of forest cover in the northern part of the commune (Figure 3). A forest-based slash and burn system was the norm in the area until the start of the sixties but started to decline afterwards. The decreasing fertility of the overall system is the result of increasing population density and reduction of the fallow period has prevented the reconstitution of the biomass (Mazoyer et al., 2002). The system was progressively converted into a permanent rice-based and forested system in which an extensive rice cropping system (i.e. one harvest a year) co-exists with forest Table 2. Changes in rice cropping patterns between 1992 and 2005 in Srayov — Changement des itinéraires culturaux rizicoles entre 1992 et 2005 à Srayov.
Total commune (wet season rice) For sample from investigation (wet season rice)
Population Total rice area Cultivated area Distance to Yield Total production per HH (number of people) cultivated (ha) (kg per HH) habitation (km) (kg.ha-1) (kg per HH)
1992 14,768 14,965 3.2 10.2 595.3 1,898.5
2005 18,576 9,532 1.2 3.1 955.6 1,146.7
HH: household — ménage.
Biotechnol. Agron. Soc. Environ. 2010
Figure 1. Location of Kampong Thom province and study areas — Localisation de la province de Kampong Thom et des communes étudiées.
Sources: Ministry of Land Management, Urban Planning and Construction, 2003; Japanese International Cooperation Agency, 2002; Ministry of Agriculture, Forestry and Fischeries, 2003. patches used for the collection of a variety of timber and non-timber forest products. Very much driven by the role of forests in rural livelihoods, rural communities have progressively identified specific forest blocks where protection and sustainable management measures were initiated by them. These efforts were well in train when the community forestry sub-decree was released in 2003. This later piece of legislation was instrumental in formalizing the recognition of the protected area as a community forest. A participatory forest inventory conducted with local dwellers (Diepart, 2007a) was conducted in 2006 to assess the diversity and productivity of the forest cover under these different forest management systems. Combined with time series aerial photos, the result of the forest inventory shows that contrary to the open access area, in the forest blocks that were entirely controlled and managed by the community both diversity and volume
of timber as well as non-timber forest products have increased over time (Figure 3). The survey, including time-series inventories that GTZ-Rural Development Program (Natural Resources Management component) conducted to assess the impact of community-based natural resources management in the 2000-2007 period, shows similar results for community forest located in a similar agro-ecological and institutional environment (Degens et al., 20072 cited by Diepart, 2007a). The forest area is also used as grazing land for cattle that has gradually become a key component of local production systems for cash income, for traction in rice cultivation, for savings and for production of manure that is paddy-field organic amendments.
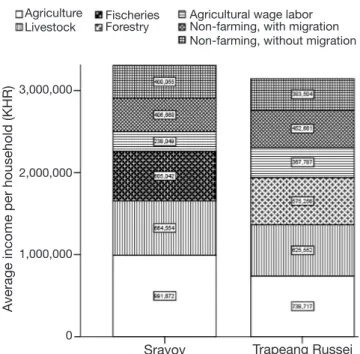
Though there are contrasts in the types of common-pool resources in both communes, the management of common-pool resources by peasantry is detailed in diversification patterns and risk coping mechanisms that enable them to make sustainable use of limited resources and to reduce risk associated with their reliance on a limited number of products in their livelihood. The management of these common-pool resources by peasant communities is thus a positive contribution to the maintenance of biodiversity. In this sense, peasant communities have a truly environmental function in their landscape. Figure 4 illustrates the share of income generated from the common-pool resources combined with the other income sources. On average, the share of fisheries and forestry activities in the total added value is quite important (18% for fisheries in Srayov and 15% for forestry in Trapeang Russei). These results stress that the integration of agro-fisheries or agro-forestry activities, in addition of being environmentally sound, generates significant value adding in the livelihoods of rural communities. Influence of non peasant actors in agrarian development. The magnitude of new medium-scale agro-industrial perimeters underlines the prevailing importance of the economic environment in shaping rural landscapes (Figures 2 and 3). In both communes, non-peasant actors exerted a strong influence in these new land developments. In Srayov, for example, they are the driving forces of new water resources management strategies in the Tonle Sap flood plain. As an illustration of this, in the late nineties, one local private entrepreneur started to build irrigation schemes consisting of one water reservoir and one dry season rice perimeter each. Its principle is simple. The floodwater is stocked in the upper reservoirs in the rainy season and flows by gravity from the reservoirs 2 Degens P. & Choun D., 2007. Impact assessment of the NRM component. Phnom Penh: GTZ-Rural Development Program Kampot/Kampong Thom, Internal Paper.
0 12.5 25 50 km N Tonle Sap Trapeang Russei commune Srayov commune Kampóng Chhnang Kampóng Thom Kampóng Cham Provincial centre Main road Provincial boundary Trapeang Russei boundary Srayov boundary Perennial river or lake Flooded zone Mainly agricultural zone Mainly shrub zone Mainly forest zone Urban zone Legend
Village land Paddy field Shrub land
Grassland Water body Flooded shrub land
Irrigated dry-season rice perimeter
Flooded land Flooded grassland Land use changes in Srayov (1992-2006)
1992 2006
Land use in 2006 (ha)
Village Water Flood Paddy Irrigated Shrub Grassland Total land body land field perimeter land
Village land 479.0 1.6 0.0 0.0 0.0 0.0 0.0 480.5 Water body 1.6 805.5 0.0 5.9 1.4 2.7 20.7 837.7 Flood land 0.0 8.8 46.1 0.0 0.0 0.0 18.0 72.9 Paddy field 0.0 34.1 3.4 8,663.4 268.3 642.1 5,359.0 14,970.2 Shrub land 0.0 0.6 0.0 16.7 0.9 640.8 456.7 1,115.7 Grassland 0.0 15.7 24.3 845.6 513.2 558.1 9,283.6 11,240.6 Total 480.6 866.3 73.8 9,531.6 783.8 1,843.7 15,138.0 28,717.6
Land use changes types Dismantlement of rice field Increase shrub cover associated with decrease grass cover Decrease shrub cover associated with increase grass cover
Creation of dry season rice irrigated perimeter Grassland converted into paddy field
Other change No change
Figure 2. Land use and land use changes maps in Srayov commune — Cartes d’occupation du sol et de changement d’occupation
du sol dans la commune de Srayov (1992-2006). The table quantifies the land use changes that have intervened between 1992 and 2006 — Le tableau quantifie les changements d’occupation intervenus entre 1992 et 2006.
Figure 3. Land use and land use changes maps in Trapeang Russei commune — Cartes d’occupation du sol et de changement
d’occupation du sol dans la commune Trapeang Russei (1992-2006). The table quantifies the land use changes that have intervened between 1992 and 2006 — Le tableau quantifie les changements d’occupation intervenus entre 1992 et 2006.
Land use in 1992 (ha) Water body Paddy field Forest (high density) Village land Perennial crop Forest (low density) Airfield
Rice and perennial crop Forest and
perennial crop Land use changes in Trapeang Russei (1992-2006)
1992 2006
Land use changes types Conversion of forest into perennial crop plantation (total)
Conversion of forest into perennial crop plantation (partial)
Conversion of forest into paddy field
Conversion of water bod into paddy field
Densification forest cover Degradation forest cover Other change
No change
Land use in 2006 (ha)
Water Village Infra- Paddy Perennial Flooded Forest Forest Forest cover Total resources land structure field crop forest covera coverb + perennial
crop Water 587.4 1.3 0.0 175.7 0.1 9.2 0.0 0.0 0.0 773.76 resources Village land 2.2 684.7 0.0 7.6 2.1 0.0 0.0 0.0 0.0 696.56 Infrastructure 0.0 0.0 28.8 0.0 0.0 0.0 0.0 0.0 0.0 28.80 Paddy field 11.2 82.6 0.0 6,573.5 32.5 0.7 2.8 12.5 0.8 6,716.63 Perennial crop 0.0 7.1 0.0 12.6 42.5 0.0 0.6 3.3 0.0 66.13 Flooded forest 68.6 0.0 0.0 0.0 0.0 25.6 0.0 0.0 0.0 94.21 Forest cover 1.2 24.2 0.0 137.5 313.3 0.0 2,115.6 477.2 324.2 3,393.14 Forest cover 0.5 5.5 0.0 156.5 153.8 0.0 125.8 2,159.5 27.6 2,629.22 Total 671.1 805.5 28.8 7,063.3 544.4 35.5 2,244.8 2,652.5 352.6 14,398.45
a high density — haute densité; b low density — basse densité.
Land use in 1992
Biotechnol. Agron. Soc. Environ. 2010
to the lower irrigated dry season rice perimeters. The idea is to create new opportunities to develop what is commonly named “under-developed” land. In Trapeang Russei, one pioneer investor attached to a Vietnam-driven cashew nut commodity chain acquired a large area of degraded forest and converted it into a large cashew plantation. In both communes, these pioneer agricultural investors were integrated in the peasant communities following agreed principles. Peasant communities contributed in the time-consuming task of patrolling as wage laborer. Overall, they were well integrated in its daily management. Nevertheless, the intervention of these pioneer entrepreneurs has been followed by less scrupulous investors who initiated large movement of uncontrolled State land acquisition for speculation purposes. Kampong Thom’s urban elites are key actors in these markets (Diepart, 2007a).
The integration of these schemes in the commune landscape is double edged. On the one hand, they represent new options for the development of the region as well as new employment opportunities during the dry season (as for 86% and 83% of the households interviewed respectively in Srayov and in Trapeang Russei). On the other hand, they also upset the multi-functional and integrated land use patterns of peasants’ agrarian systems. The presence of the agro-industrial structure means a decrease in the availability of non-timber forest products (33% in Srayov and 85% in Trapeang Russei). Access to grazing areas, fishing
ponds or forestland is more difficult because of the mere existence of the massive perimeters within the same territory (46% in Srayov and 57% in Trapeang Russei). In Srayov in particular, all the respondents (n = 69) acknowledge that a significant number of fish fingerlings are even being caught inside the reservoirs, resulting in a decrease of their total fish catch, especially in the recession ponds located in the vicinity of the reservoirs.
These agro-ecological impacts on agrarian and production systems are the visible expression of deeper issues related to the State land tenure context. In both communes, the appropriation rules of the common-pool resources are simply depending on the use of those resources as the demographic pressure on land is not high. These institutional arrangements are legitimized and approved by all under the scrutiny of village and commune chiefs. Nevertheless, these collective rules are being challenged by the new possibility of land ownership offered by the jurisdiction of State control (State public and State private). State-controlled concessions overlap with the collective rules of peasant communities, which create confusion on the appropriation of land and its resources. The concerned agencies and government officials derive material benefits from this legal limbo surrounding the management of common-pool resources. Depending on the land area involved, the provincial, district or communal administration gives authorization to each individual investor for the construction of a perimeter or a plantation. This usually requires payment of a commission (Diepart, 2007a). The registration of those lands as private State land and the delivery of an economic land concession should be the legal procedure for the retention basins or plantations, but the documents, including agreements available to support these transactions, do not mention on what legal basis these agreements are made (Provincial Hall of Kampong Thom, 2005). Qualitative investigations with various local stakeholders have shown that the rights to own State land as private property are given by local administration (commune, district, and province) along norms that are well structured along elite appropriation norms that largely exclude the peasant communities. These dynamics, which mark the re-emergence of capitalism in the agrarian system, are either strongly affiliated to the ruling party or strongly linked with commune and district authorities through informal and personalized networks. In rural Cambodia, social relations are traditionally based on a form of trust linked to the moral obligations between a patron and a client. These norms constitute key social bonds in rural communities (Ledgerwood et al., 2002). Even though based on dominance, the action of a patron is required from a peasant perspective. It provides certain form of social and physical security. Figure 4. Average income per household in the study
areas (by source of income) — Revenu moyen par ménage dans les communes étudiées (ventilé par source de revenu).
1 USD = 4.100 KHR, as of 2006.
Trapeang Russei Srayov
A
verage income per household (KHR)
3,000,000
2,000,000
1,000,000
0 Agriculture
Livestock FischeriesForestry Agricultural wage laborNon-farming, with migration Non-farming, without migration
Nevertheless, these traditional patronage networks are being challenged and transformed under the pressure of political power and the liberalization of economy, resulting in very weak linkages and trust between the communities and the public institutions which collude with private investors. In both Srayov and Trapeang Russei, tensions and conflicts that have arisen from the appropriation of State public land by investors were, at some stage, always negotiated and resolved through the mediation of community facilitators associated with the pagoda committee and entrusted by fellow villagers. An important feature that characterized collective action in the studied communities is indeed the re-activation, after the turmoil of repeated wars, of the associations created and structured around pagodas. These social networks develop slowly and decisions are taken by consensus. Nevertheless, they have the ability, resources and competence to gather the stakeholders and entrust dialogue for collective action (Pellini, 2007; Diepart, 2007a). These associations are fragile because easily deviated by political or economic influences but
their actions are constructive in mediation and conflict management. They definitively represent a form of peasant historic governance that ensures collective security.
3.2. Organization of family-based labor and income formation
The recent evolution towards increased liberalization of agricultural input and output has induced growing disparities between regions and within the peasant communities in each region. This evolution creates a tendency to redistribute the conditions of access to resources (land, water, equipments, etc.) as well as the labor allocation and income formation strategies between different categories of producers (Lipton, 2002; Peemans, 2002; Diepart et al., 2005; 2007a).
The monthly labor intensities (in men.month) are computed for all people involved in each activity and presented on a seasonal calendar (Table 3). It shows first the total labor per household, which can be best compared with the average active labor force per Table 3. Monthly allocation of family-based labor per household (combined and for each activity) — Allocation mensuelle de la main-d’œuvre familiale par ménage (combinée et pour chaque activité).
Srayov Households Labor intensities (in men.month per household) involved (%) Dry season Rainy season
Jan. Feb. March April May June July Aug. Sept. Oct. Nov. Dec. Average Total 100 1.16 1.20 1.16 1.00 2.98 3.07 3.08 3.16 3.21 3.24 3.22 2.69 2.43 Agriculture/ 95 0.18 0.20 0.23 0.21 2.47 2.53 2.53 2.53 2.53 2.53 2.37 1.84 1.68 livestock Fisheries 34 0.89 0.96 0.80 0.46 0.30 0.37 0.50 0.70 0.78 0.78 0.93 0.87 0.70 Agricultural 3 0.50 0.50 0.50 1.00 0.50 0.50 0.50 0.50 0.50 0.50 1.00 1.00 0.63 wage labor Non farm with 18 1.39 1.39 1.35 1.30 1.22 1.22 1.22 1.22 1.22 1.17 1.30 1.30 1.28 migration Non farm without 34 1.02 1.02 1.02 0.93 0.75 0.77 0.70 0.73 0.77 0.86 0.95 0.93 0.87 migration
Trapeang Russei Households Labor intensities (in men.month per household) involved (%) Dry season Rainy season
Jan. Feb. March April May June July Aug. Sept. Oct. Nov. Dec. Average Total 100 1.68 1.58 1.62 1.61 2.01 2.61 2.83 2.83 2.80 2.50 2.28 2.00 2.20 Agriculture/ 88 0.28 0.17 0.21 0.21 1.07 1.98 2.28 2.28 2.16 1.48 1.16 0.81 1.17 livestock Fisheries 4 1.00 1.00 1.00 1.00 1.00 0.33 0.33 0.33 0.33 0.67 0.67 1.00 0.72 Forestry 15 1.40 1.20 1.20 1.30 0.30 0.20 0.20 0.20 0.60 1.10 1.20 1.10 0.83 Agricultural 15 1.40 1.50 1.50 1.40 1.30 1.50 1.50 1.50 1.50 1.60 1.30 1.40 1.45 wage labor Non-farm with 40 1.19 1.22 1.22 1.19 0.96 0.74 0.70 0.70 0.74 0.96 1.04 1.00 0.97 migration Non-farm without 40 1.19 1.19 1.19 1.19 0.96 0.74 0.70 0.70 0.70 0.93 1.07 1.11 0.97 migration
Biotechnol. Agron. Soc. Environ. 2010
household, which is 3.7 active labor/household in Sravoy and 3.8 active labor/household in Trapeang Russei. Table 3 also presents the average occupation of the labor force for each and every activity, including the cases where only the households are involved in each specific activity.
Rain-fed rice production is the pivotal activity of nearly all the production systems in terms of both labor requirements and number of families involved. Rice production is an intensive activity in terms of labor requirements during the crop cycles that are covering a total period of eight months due to specific agro-ecological contexts. During this period, rice cultivation employs almost all the active labor force of the families. Nevertheless, in both communes, farming occupations do not completely occupy labor throughout the year. This is principally due to the inexistence or deficiency of hydraulic infrastructure that does not guarantee the control of water and therefore limits the intensification or diversification opportunities for dry season agriculture.
In the dry season, households face a problem of labor surplus and underemployment, and the rice-based production systems in the studied area are engaged in diversification patterns. The need to diversify farming activities is made even more acute as the risks associated with low harvests are high due to climate irregularities (pronounced flood and drought). The factor governing the diversification of activity depends on the local agro-ecological context, the age structure of the household (i.e. dependency ratio), the opportunities offered by the local or regional labor market as well as the capacity for peasant to grasp these opportunities through notably their integration in ad hoc social networks. Due to weak labor productivity, very low levels of mechanization and the self-subsistent character of rice production, the diversification options that households can grasp depend largely on their demographic structure and potential. The reference to the demographic differentiation of Chayanov is then crucial to distinguish the production system in the studied area. Household labor capacity and the ability to diversify labor vary along the peasant life cycle as shown in figure 5. It increases until the households heads are aged 50-55 years old and decreases logically afterwards, when the children establish their own households. While rice production remains overall crucial for all, the households with greater labor capacity (aged 45-65 years old) are logically better positioned on the life cycle to capture non-farming employment opportunities.
In Srayov, two equally important activities of these diversification patterns are fishing (principally fishing activities in the so-called recession-ponds constituted after the flood water recedes) and self-employed non-farming activities within the commune (e.g. construction, handicraft, transport, small business, etc.).
The proximity to both the flood plain and to Kampong Thom urban centre is a key factor that explains the interests and choice of households for extra-farming activities. Agricultural wage labor in the irrigated perimeters has a rather limited impact in terms of labor occupation for the households investigated. For 18% of the households, diversification takes the form of non-farming activities such as migration to Phnom Penh to work in garment factories or to Thailand to work in factories or plantations. Computation of bi-variate correlations shows an actual negative association between household farming incomes and household income generated from non-farming activities (correlation coefficient r2 = - 0.174**, highly significant). While the correlation between the farming income is logically highly correlated with the land area (r2 = 0.809**), this negative association is viewed as an income substitution effect of farming and non-farming activities, non-farming income compensating the weakness of the farming income. The recourse to non-farming activity concerns mainly young male or female labor of each family and is less seasonally-dependent than farming sensu stricto. It consists of an investment strategy that engages households in more than simple reproduction. The importance of rural-urban migrations suggests that migrants from peasant communities are key bridges between rural and urban Figure 5. Family-based labor allocation per household and per class of household chiefs’ age (by activity types) — Allocation de la main-d’œuvre familiale par ménage et par classe d’âge de chefs de ménages (ventilé par type d’activité).
Age classes of household
chief (years) Age classes of household chief (years)
A
verage amount of labor (men
. month per
year per household)
40 30 20 10 0 < 25[25-35] [45-55][35-45] [55-65][65->] Farming/ livestock Fisheries Forestry Agricultural wage labor Non-farming, with migration Non-farming, without migration < 25[25-35] [45-55][35-45] [55-65][65->]
territories. On the other hand, there is no significant link between farming and fisheries incomes (r2 = -0.061). Fisheries need to be understood as a seasonal tactic to grasp the specific seasonal opportunities offered by the natural resources and to allow utilizing family labor. These activities provide more a complementary source of income rather than a substitute for weak farming income. Access to fisheries grounds depends on a quite robust labor force due to important displacement (11 km per household on average).
In Trapeang Russei, the diversification patterns are slightly different due to larger agricultural wage labor opportunities in the cashew plantation. The recourse to non-farming activities is also more important due to more difficult cultivation environment. The soils are much more weathered (Acrisols) and not annually enriched with alluviums as in Srayov. A similar income substitution effect is highlighted between farming and non-farming activities. The bi-variate correlation coefficient between the farming and non-farming income is (r2 = - 0.208**, highly significant). As with fisheries activities in Srayov, the income from forest resources (open-access and common property) is not associated with farming income (r2 = - 0.05), which suggests that access to forests is also more a seasonal tactic. These activities do not necessitate such a robust labor force as for fisheries, and child labor is significant in this sector.
An analysis of income concentration using Lorenz curves and Gini indexes shed other lights on the diversification of productive activities. The first observation is the very strong concentration of cash income from agriculture (Gini coefficient of 0.51 in Srayov and 0.50 in Trapeang Russei), which is due to the concentration of agricultural land in the first place. The income generated from the common-pool resources and non-farming activities in both communes shows higher levels of concentration (Figure 6) due to the fact that a smaller proportion of households actually practice these activities, which result in more significant concentration. But, interestingly, the concentration of the total income presents a lower level of concentration (Gini coefficient of 0.41 and 0.43 in Srayov and Trapeang Russei respectively). The modalities of distribution of the added value within the peasant communities results in a reduction to the disparities in farming income.
This balancing effect of farming income disparities results from a combined effect of two different dynamics whose nature is similar in both communes. Firstly, though the access to common-pool resources mainly depends on the household demographic structure, the share of fisheries and forestry income is most important for the poorest households. The Gini Index of farming and common-pool resources incomes are respectively 0.48 and 0.47 in Srayov
and Trapeang Russei. This suggests that the poorest households actually compensate the weakness of their total income by accessing the common-pool resources and the value-added from the integration of farming and natural resources management activities resulting in a more even income distribution than from farming income alone. Secondly, the access to non-farming activities is conditioned by the age structure of the households but also depends on the availability of up-front capital to invest in non-farming activities as well as the access to information existing in specific social networks. The later is key when considering the imperfect labor market situation. Results show that non-farming income distribution follows a different trend, as the non-farming incomes represent an increasingly important share of the income as the total income rises (the higher the total income, the higher the non-farm income). The non-farming income also compensates the weakness of the sole farming income but it goes beyond this income balancing effect. Access to non-farming is a long-term strategy for peasant households and is a driving force of socio-economic differentiation.
3.3. Determinants of land and labor productivities in rain-fed rice production
Land access and land holdings differences. The third phase of the surveys was conducted with a large sample of households with land holdings (n = 229). Amongst those, the agricultural land area is unevenly distributed in both Srayov and Trapeang Russei (in Srayov: mean = 1.66 ha, standard deviation: 1.35 and Gini Index: 0.41 and in Trapeang Russei: mean = 1.25 ha, standard deviation: 1.03 and Gini Index: 0.41). The database allows differentiating, for different classes of total agricultural land area, of the relative importance of the different modes of acquisition (Figure 7). Figure 6. Concentration – Gini indexes – of household incomes (by source of income) — Concentration – indices de Gini – des revenus par ménage (ventilés par source de revenu).
Non-farming in Srayov: 0.72
Non-farming in Trapeang Russei: 0.65
Total non-farming activities income (including wage labor) Income derived from Common-Pool resources Fisheries in Srayov: 0.63
Forestry in Trapeang Russei: 0.71 Agriculture/livestock income Srayov: 0.51 Trapeang Russei: 0.50 Total income Srayov: 0.41 Trapeang Russei: 0.43
Biotechnol. Agron. Soc. Environ. 2010
The acquisition of land by the State distribution (from Krom Samaki) and by inheritance are the most important ones. They are negatively correlated with each other as they are associated with the demographic cycle of the households. This phenomenon is visible in both Srayov and Trapeang Russei. The progressive disbandment of the Krom Samaki system in the mid eighties has resulted in the formal distribution of land to the households. This distribution consisted of redistributing the land to households according to the number of active laborers in family. Equitable in its principle 20 years ago, the distribution has initiated differences in land holdings that are visible today. Households with larger land holdings mainly got their land through State redistribution. The bi-variate correlations between the age of the household leader, the total land area and active labor are significant. It is noteworthy that the distribution of agricultural equipment and draught animals followed logically the same patterns as most farming capital was redistributed to the households together with the land. The correlation between the value of the agricultural capital and the agricultural land area are highly significant for both communes. Conversely, households with smaller land holdings are young and acquired their land mainly through inheritance (negatively correlated with land
area received by Krom Samaki). The double age-biased phenomenon of land concentration and atomization is observable in Srayov and Trapeang Russei and confirmed studies conducted in similar agro-ecological environments (Ballard et al., 2004).
Nevertheless, if these relationships are robust statistically, the levels of correlation are weak, which suggests that other patterns of land differentiation are at stake, such as the capacity of households to acquire land by forest clearance (in Trapeang Russei) and land purchase. Immediately after the war, forest areas were actually allocated in lots to families who were able to clear it progressively according to their labor capacity. Even though this rule enabled families to acquire large land holdings, it has been abandoned since 2000 in the name of improved forest management. Permission from local authorities is now needed to get additional land, which involves financial contribution (virtually a land purchase) and strong connections with commune and/or district authorities. Intense land speculation by companies or individuals on State land, as described earlier, has made access to additional land through clearing more difficult.
Agricultural productivities and profitability of rice production. The cropping systems in the studied areas consist mainly of rain-fed rice. The crop diversification index is very low (0.096 in Srayov and 0.058 in Trapeang Russei) meaning that rice is largely dominant. A total of 2% of the total cultivated by peasant households consists of dry-season recession rice, and benefits from a natural irrigation system with the recession of Tonle Sap floodwater. The absence of ad hoc irrigation equipment/drainage accessible to peasants limits the possibility of rice production to one cropping season. The rice intensification index is 1, meaning that one plot bears one and only one crop a year. For these reasons, only rain-fed rice production indicators were computed and presented in table 4. The very weak control of water flowing in and out from May to October causes rice production to fluctuate largely with climatic conditions. Due to a much-diversified agro-ecological landscape, the impact of climate can be very different from one household to the other. Risk-coping mechanisms are part and parcel of productive tactics of the peasant household. Though production indicators are highly variable due to theses erratic conditions, trend analysis is still possible.
First of all, the results for both communes confirm the well-known inverse relationship between land size and yield (Binswanger et al., 1990). Households with a smaller land holding produce more per hectare than ones with larger land holdings. Though they enjoy higher land productivity, households with smaller land holdings produce relatively less rice and sometimes acknowledge food shortages. This issue concerns 45% Figure 7. Distribution of agricultural land size by mode of
land acquisition for different classes of total agricultural land size — Distribution de la taille des superficies de terre agricole pour différents modes d’acquisition et par classe de superficie agricole totale.
Classes of total
agricultural land size (ha) agricultural land size (ha)Classes of total
Land ar
ea in per
cent of total land size
100 80 60 40 20 0 [0-0.5][0.5-1][1-2] [2-3] [3-<]
Srayov Trapeang Russei
[0-0.5][0.5-1][1-2] [2-3] [3-<]
Acquired by inheritance Acquired by State distribution (Krom Samaki) Acquired by purchase
Acquired by forest clearance Acquired by lease
of households in Srayov and 65% in Trapeang Russei. The higher yield observed for the smaller land holding household is explained by a combination of two intensification factors: the use of labor and the use of agricultural inputs.
The intensity of labor is largely dependent on the household’s land-labor ratio. Households with relatively smaller land holdings are less limited by the labor they can provide on their crop than by their land size, which is in this case the dominant productive constraint. These labor-abundant households are then in a position to use the productive factor they possess in relatively greater quantity. As the land area increases, the balance of the land-labor ratio shifts and labor becomes the limiting factor. The land-abundant households will have a tendency then to use relatively less labor per hectare as a larger area provides food security for the family.
The trend of labor intensification with the decrease of land area is similarly observed for family labor and for external labor. Furthermore, the database allows differentiation of two kinds of external labor: cash-paid external labor and external labor that is part of the traditional exchange group between groups of families (“Provas Day”) (Figure 8). Access to wage cash labor is preponderant for households with smaller land holdings, while external labor as part of a traditionally exchange group is more important for larger land holdings. Their logic will be to finalize, as fast as possible, the rice cultivation work without having to provide labor services to other people’s land. The freed labor can be allocated to other activities. Here again, this logic will be followed by those peasants who actually have the opportunity to allocate their labor to other activity.
For households with larger land holdings, food security is more easily ensured due to higher levels of production. The higher use of “Provas Day” is justified to limit monetary expenditure in the form of cash. On the basis of purely theoretical reasoning aiming
to project on a temporal scale what is observed in a spatial scale, a possible consequence of demographic pressure and lack of access to additional land will be the tendency towards decreasing areas of cultivated land accompanied by the reinforcing of the emergence of wage laborer pool. Recent research on reciprocity and social interactions underlines this trend (Kim, 2001).
The second factor of intensification that explains the higher yield for smaller land holding is a more important use of agricultural inputs (Table 4). These agricultural inputs consist mainly of equipment rental, purchase of seeds, fertilizers and pesticides. On Table 4. Productivity, efficiency and profitability of wet season rice production by class of cultivated areas in Srayov — Productivité, efficience et rentabilité de la production de riz pluvial par classe de superficies cultivées à Srayov.
Land Frequency Total Total Production Productivity Efficiency Profitability Class* of households production labor** costs*** Land Labor Cost price Gross margin
(ha) (%) (kg) (men.days (KHR.ha-1) (kg.ha-1) (kg per (KHR.kg-1) (KHR) (KHR.ha-1) (KHR per
per ha) men.days) men.days)
[0-0.5] 18.8 447 141 368,123 1,207 9 305 178,743 482,958 3,425
[0.5-1] 26.2 708 68 102,462 966 14 106 283,036 386,428 5,683
[1-2] 32.9 1,404 65 101,724 994 15 102 561,420 397,444 6,115
[2-3] 12.1 1,578 44 65,688 690 16 95 631,200 275,990 6,272
[3- >] 10.1 3,180 31 82,672 798 26 104 1,272,000 319,166 10,296
* harvested land — superficie récoltée; **family + external labor — travail familial + travail extérieur; ***cash costs do not include
family labor — les couts de production ne comptabilisent pas les couts de main-d’œuvre familiale.
Distribution of exter nal labor (as per cent of men.days) 100 80 60 40 20 0
Classes of cultivated areas (ha) [0-0.5] [0.5-1] [1-2] [2-3] [3->] Cash paid external labor per ha
Exchanged external labor as «Provas Day» per ha
Figure 8. Distribution of external labor modalities for rain-fed rice production (by class of cultivated areas for all villages) — Distribution des modalités de travail extérieur pour la culture de riz pluvial (par classe de superficies cultivées pour tous les villages).
Biotechnol. Agron. Soc. Environ. 2010
average, they will agree to higher costs per hectare because:
– they are themselves endowed with less agricultural capital, and so need to hire equipment due to an age biased land/equipment endowment;
– for tactical reasons aiming to reduce the amount of farming work that cannot guarantee food security anyway and to allocate the labor force to non-farming activities during a longer part of the year. This intensification in agricultural inputs represents an additional cost for households and this expenditure is useful only for the households who have the opportunity to allocate their labor to non-farming activities. Costs price for rain-fed rice cultivation, which gives a combined effect of the yield and production costs, is a reliable indicator of rice production efficiency (Table 4). The differential between the sale price at farm gate (435 KHR.kg-1 in Srayov and 407 KHR. kg-1 in Trapeang Russei) is always positive, which emphasizes that rice production is always efficient. Costs price values always show the highest score for land-scarce households. For households with smaller land holdings, the double intensification in labor and agricultural input does not make rice production more efficient even though yields are higher. Over-expenses are critical in explaining the weak competitiveness of rice production in these households. For land abundant households, the efficiency of production is better, though the results show important variability within each class identified. Overall, more regular and quality-driven extension services in agricultural support to farmers is genuinely needed.
In order to maximize their benefit, the peasants follow different production logic, in step with the means of production that they have in relatively less amount. The gross margin that gives the combined effect of differential of sale price and cost price and yield enable to distinguish these logics (Table 4). The rice production rationality of land-scarce households will be to maximize their rice income in step with their land area (KHR.ha-1). They will do so by use of relatively abundant labor and agricultural inputs if they have the means to do so. In turn, households with larger land holdings will look to maximize their income in step with labor (KHR per men.days). They will be more sensitive to labor productivity than to land productivity.
The land reform assisted by market as envisioned in Cambodia is legitimized by the assumptions that: – land titling will increase land security to households who will use land as collateral to borrow money in order to improve land productivity; – the land market will ensure the reallocation of land to those who are the most efficient in cultivating it, supposedly the household with the smaller land- holding. These are the foundations of the so
called “growth with equity” development paradigm. Nevertheless, it must be made very clear which kind of efficiency is considered. Efficiency must be addressed in step with the limiting factors of the households.
3.4. Influence of land and credit markets
Theoretical assumptions of land markets. Cambodia is an industrializing economy. Although the industrialization is still mainly focused on foundation industries such as the garment and tourism industries, the job opportunities offered to the rural population outside the purely farm sector are increasing (Chan et al., 2002). The labor markets outside agriculture are still very much imperfect in rural areas and this imperfection has different effects on rural households. For land-scarce and labor-selling households, imperfect labor markets mean underemployment and a marginal value of labor below the market wage in the farming sector or outside agriculture. In turn, for land-abundant and labor-buying households, imperfect labor markets mean that the marginal costs of labor are above the market wage. Land-abundant households find themselves cultivating their land with relatively expensive labor. And given the excess value of land to land-scarce households, it is expected that the creation of land markets would lead land-abundant households to sell or rent out land to land-scarce households, if access to technology and other factors of production were equal between these two groups of households. Land-scarce households would find themselves acquiring land through the market and land-abundant households would find themselves providing land on the markets. The land markets would thus have two impacts: an aggregate productivity effect that would result as land was transferred from lower valued to higher valued uses and an income distribution effect resulting from the improved livelihood and the incomes of landscarce households (Carter, 2002). Land trajectories simulation. The land trajectories simulation has been developed to test the validity of the theoretical assumptions that land markets will lead to a fairer land distribution amongst households. The simulation allows visualizing the land transactions so that they can be understood according to the household land-labor ratio at the moment of the transaction and then be compared with theoretical assumptions.
Figure 9 shows that land purchase cases are actually more important for landscarce households. This reflects the necessity for land-scarce households to increase their land holdings for livelihood purposes. Even though this observation seems in line with the suggestion of the theoretical assumptions, it should be emphasized that the possibility of acquiring land