Testing of primers for the study of cyanobacterial molecular
diversity by DGGE
C. Boutte*, S. Grubisic, P. Balthasart, A. Wilmotte
Center for Protein Engineering, Institute of Chemistry B6, University of Lie`ge, B-4000, Lie`ge, BelgiumReceived 9 August 2005; received in revised form 27 September 2005; accepted 27 September 2005 Available online 14 November 2005
Abstract
Denaturing Gradient Gel electrophoresis (DGGE) is a PCR-based technique which is widely used in the study of microbial communities. Here, the use of the three specific 16S rRNA cyanobacterial specific primers CYA359F, CYA781R(a) and CYA781R(b) on the assessment of the molecular diversity of cyanobacterial communities is examined. Assignments of the reverse primers CYA781R(a) and CYA781R(b) with cyanobacterial strain sequences showed that the former preferentially targets filamentous cyanobacteria whereas the latter targets unicellular cyanobacteria. The influence of the GC clamp position on the forward or on reverse primer and the use of the two reverse primers separately or in equimolar mixture were investigated. Three environmental samples were subjected to amplification with 6 combinations of primers. The 6 banding patterns as well as the sequences of the bands extracted were analysed and compared. In addition, to assess the effect of the position of the GC clamp, the melting profiles of the sequences of Aphanizomenon flos-aquae PMC9707 and Synechococcus sp. MH305 were determined, with the GC clamp in the 3V or 5V position. Results showed that the use of two separate amplifications allowed a more complete study of the molecular diversity of the cyanobacterial community investigated. Furthermore, similar richness and identical phylogenetic assignments of extracted bands were obtained irrespective of the positioning of the GC clamp.
D 2005 Elsevier B.V. All rights reserved.
Keywords: 16S ribosomal RNA; Denaturating gradient gel electrophoresis; Cyanobacteria; Molecular diversity
1. Introduction
16S rRNA PCR-DGGE (Polymerase Chain Reac-tion-Denaturing Gradient Gel Electrophoresis) is one of the most frequently used technique to assess the genetic diversity of microbial communities (Muyzer, 1999; Ercolini, 2004). This method allows the separation of small DNA fragments (maximum size of 1000 bp) of the same length but of different sequence according to their melting properties (Nollau and Wagener, 1997).
Indeed, fragments with only one single base substitu-tion can be separated with this technique (Myers et al., 1985). Typically, so as to prevent a complete denatur-ation of the double-stranded fragments, a GC clamp is added to the 5V end of the forward primer (Myers et al., 1985; Sheffield et al., 1989; Casamayor et al., 2000; Sekiguchi et al., 2001; Lyautey et al., 2005). However, the effect of the position of this GC clamp on the forward or reverse primer on the quality of the patterns obtained has not previously been investigated.
The numbers, positions and intensities of the DGGE bands obtained can be used to determine the diversity of natural samples (Muyzer, 1999; Garcia-Pichel et al., 2003; Lyautey et al., 2005). Several biases which may 0167-7012/$ - see front matterD 2005 Elsevier B.V. All rights reserved.
doi:10.1016/j.mimet.2005.09.017
* Corresponding author. Tel.: +32 4 366 33 10; fax: +32 4 366 33 64.
cause pitfalls in the interpretation of the DGGE patterns have been reported, like heteroduplex formation, am-plification errors, the presence of multiple copies of 16S rRNA operons (Speksnijder et al., 2001; Wintzingerode et al., 1997), co-migration of different DNA fragments (Sekiguchi et al., 2001) and the presence of several melting domains in a DNA fragment (Kisand and Wikner, 2003). Nevertheless, some of these problems can be solved by the excision of the bands followed by reamplification and sequencing, as the identity of the organisms can be ascertained if the DNA fragment analysed is polymorphic.
Nu¨bel et al. (1997) have designed the cyanobacter-ial primers CYA359F (forward), CYA781R(a) and CYA781R(b) (reverse) for specific amplification of a 379 bp 16S rRNA gene sequence. CYA781R(a) and CYA781R(b) differ by two polymorphic bases situated at positions 7 and 23 (5V to 3V). These primers have the advantage of giving a PCR product which corre-sponds to variable regions V3 and V4, and contains significant information for phylogenetic assignments (Yu and Morrison, 2004). Indeed, they have been used unmodified (e.g. Casamayor et al., 2000; Gar-cia-Pichel et al., 2001; Abed et al., 2002; Geiß et al., 2004) or slightly adapted (Zwart et al., 2005) for numerous DGGE studies investigating cyanobacterial diversity in environmental samples.
In the present study, we aim to determine (1) the variation in the banding profiles caused by the position of the GC clamp on the forward or reverse primer, and (2) the combination of the primers designed by
Nu¨bel et al. (1997) which allows an optimum investi-gation of the diversity of the cyanobacterial com-munity. To achieve this, we analysed and compared the DGGE fingerprints obtained with the six pairs of primers CYA781R(a), CYA359FGC-CYA781R(b), CYA359FGC-CYA781R(a + b), CYA359-F-CYA781RGC(a), CYA359F-CYA781RGC(b), CYA359F-CYA781RGC(a+b), where GC means the GC clamp. In addition, as many as possible DGGE bands were sequenced to assess the diversity of the sequences obtained.
2. Materials and methods
2.1. In silico match of the reverse primers CYA781R(a) and CYA781R(b)
Using the Probe Search tool of the software package ARB (Ludwig et al., 2004) with an alignment of 1124 cyanobacterial strain sequences, the theoretical matches of the reverse primers CYA781R(a) and CYA781R(b) were investigated.
2.2. Sampling and DNA extraction
Environmental samples were collected at the Esch-sur-Suˆre reservoir in North Luxembourg. The typical genera detected microscopically in this site during spring and summer were Anabaena, Aphanizomenon and Planktothrix. In August, populations of Limno-thrix and Snowella have been reported. Woronichinia have been detected in autumn whereas no cyanobac-teria have been observed during winter (Willame et al., MS in prep.).
Samples were collected by filtration of 500 ml water on 0.2 Am-pore-size filters (Supor, Pall Life Science, USA). The filters were stored in 2 ml lysis buffer (40 mM EDTA, 400 mM NaCl, 0.75 M sucrose, 50 mM Tris HCl pH 8.3) (Giovannoni et al., 1990) and immediately frozen at 20 8C. Three environmental samples were collected for the comparison of the primer pairs, 0ES27 (04/07/2000), 0ES32 (08/08/2000) and 0ES39 (26/09/ 2000). DNA was extracted from the filters as de-scribed by Wilmotte et al. (2002) with modifications as follows. For the enzymatic lysis step, a volume of 30 Al of proteinase K (20 mg ml 1, MBI Fermentas, Lithuania) was used. Two milliliters of hot phenol (Sigma, USA)/chloroform/isoamylalcohol (Merck, Ger-many) (25:24:1) was added and incubated for 10 min at 56 8C. During the precipitation step, nucleic acids were precipitated from the supernatant (divided in several Eppendorf tubes) by addition of two volumes of ethanol and incubated for two hours at 20 8C. The tubes were centrifuged for 20 min at 16,000 g and after extraction, DNA was subjected to a purification step using the Prep-A-Gene DNA Purification Kit (Biorad, USA).
2.3. PCR reactions
As a direct amplification of the DNA with the Nu¨bel primers gave a weak signal (data not shown), a semi-nested PCR reaction was performed so as to increase the sensitivity of the DGGE analysis. The 16S rRNA frag-ments were first amplified using the primers CYA359F and 23S30R (Taton et al., 2003). The second PCR reac-tion was performed with CYA359F and CYA781R(a) and/or (b), with the GC clamp on the forward or reverse primer. All the primers used are listed inTable 1and were synthetized and purified by Gel PAGE (Polyacrylamide Gel Electrophoresis) at Eurogentec (Belgium). For the first PCR, 0.5 Al of the isolated DNA was added to 49.5 Al of the amplification mixture, giving rise to final con-centrations of 1 X Super Taq Plus buffer, 1 mg ml 1 BSA (bovine serum albumin), 200 AM dNTP mix, 0.5 AM of each of the forward and reverse primers and
0.8 U/Al of Super Taq Plus (HT Technology, UK) in a final volume of 50 Al. The amplification was performed using an Icycler (Bio-Rad, USA). The PCR program included 1 cycle of initial denaturation at 94 8C for 5 min, followed by 10 cycles with a denaturing step of 45 s at 94 8C, an annealing step of 45 s at 54 8C, and an elongation step of 2 min at 68 8C. The final elongation was done during 7 min at 68 8C. 0.5 Al of the first PCR product was then added to 49.5 Al of the second PCR master mix (same composition as above, except for the primers used). This was per-formed with a combination of the forward primer CYA359F and the reverse primers CYA781R(a) and (b), separately or mixed. The GC clamp was positioned on the forward or reverse primers. We used the same PCR reagents as in the first reaction and the cycling conditions used where as described byNu¨bel et al. (1997), with the exception of the elongation temperature, specific of the Super Taq Plus (68 8C instead of 72 8C). Reference marker prepared by PCR amplifications of DNA frag-ments of Cylindrospermum PCC7417, Calothrix 328, Aphanizomenon 202a and Nostoc 152 with the primers CYA359F and CYA781RGC(a) and with CYA359F-CYA781RGC(b) amplifications of DNA fragments from Microcystis 130 and Synechococcus GL150636 was added in three lanes of each DGGE gel.
2.4. DGGE
The products of the second PCR reaction were analysed by DGGE. This was performed using a DCode System (Bio-Rad Laboratories, USA) with a 6% acrylamide gel (acrylamide/bis 37.5/1) (w/v) and a denaturating gradient from 45% to 55%. The 100% denaturating solution was composed of 7 M urea and 40% formamide (v/v). The samples were prepared by adding 4 Al of loading dye solution (0.09% bromophe-nol blue, 0.09% xylen cyabromophe-nol, 60% glycerol, 60 mM EDTA) to 20 Al of the PCR product. The electropho-resis conditions were chosen on the basis of a perpen-dicular gel and a time-travel experiment (data not
shown). DGGE were performed at 60 8C during 999 min at a constant voltage of 45 V. The gel was stained with 2 Al Gelstar dye (BioWhittaker Molecular Appli-cations, USA) mixed with 15 ml of water (milli-Q). Bands were visualised under UV light and the central part of these was excised with a scalpel washed with pure ethanol. The excised acrylamide gel portion was stored in an Eppendorf tube containing 100 Al of ster-ilized water at room temperature for 1 hour and then the tubes were stored at 20 8C. 0.5 to 1 Al of supernatant was used for the reamplification reaction with CYA359F-CYA784R. The PCR products were se-quenced commercially (Genome Express, France) using the CYA784R primer. The sequences of approx-imatively 360 bp were submitted to a BLAST analysis, and the results are shown inTable 3. The 36 sequences obtained have been deposited in Genbank database under the accession numbers AY646773 to AY646808. 2.5. Analysis of the banding patterns
Scanning of the gel was performed with a Fluor-S Max MultiImager (Bio-Rad, USA). The bands were localised using the manufacturer’s software (Quantity One Software Package) on the basis of the peaks pres-ent in the densitometric curves calculated for each lane. The number of OTUs (Operational Taxonomic Units) was defined as the number of DGGE bands (Diez et al., 2001). The banding profiles were analysed using the GelCompar II Software 2.5 (Applied Maths, Belgium) after alignment with the reference marker.
2.6. Determination of melting profiles
The theoretical effect of the presence of the GC clamp on the forward or reverse primer was analysed using the Poland algorithm with the MELT94 software following the author’s instructions (Lerman and Silver-stein, 1987). This software performs the calculation of the melting profile of a known sequence, and allows the Table 1
Sequences of the PCR primers used (*: 16S E. coli position,#: 23S E. coli position)
Primer names Position 3V end Sequence (5V-3V) References
CYA359F 359* ggggaattttccgcaatggg Nu¨bel et al., 1997
CYA359FGC 359* cgcccgccgcgccccgcgcccgtcccgccgcccccgcccgggggaattttccgcaatggg Nu¨bel et al., 1997
CYA784R 784* gactacaggggtatctaatccc derived fromNu¨bel et al., 1997
CYA781R(a) 781* gactactggggtatctaatcccatt Nu¨bel et al., 1997
CYA781RGC(a) 781* cgcccgccgcgccccgcgcccgtcccgccgcccccgcccgactactggggtatctaatcccatt Nu¨bel et al., 1997
CYA781R(b) 781* gactacaggggtatctaatcccttt Nu¨bel et al., 1997
CYA781RGC(b) 781* cgcccgccgcgccccgcgcccgtcccgccgcccccgcccgactacaggggtatctaatcccttt Nu¨bel et al., 1997
23S30R 30 # cttcgcctctgtgtgcctaggt Taton et al., 2003
addition of a GC clamp of 29 bp in 5V or 3V position. The 378–781 positions (based on the E. coli sequence) of the 16S rRNA of Aphanizomenon flos-aquae PMC9707 and Synechococcus sp. MH305 were used as template, to which CYA359F, CYA781R(a) or (b) primers and a GC clamp were added at the 3V or 5V end. These sequences correspond to the most frequent BLAST affiliations found among our sequences (six for Aphanizomenon and three for Synechococcus). 3. Results and discussion
3.1. In silico match of the reverse primers CYA781R(a) and CYA781R(b)
Of 397 heterocystous cyanobacterial sequences, 95.2% matched with the primer CYA781R(a) including 73% of the sequences of the genus Chroococcidiopsis, this being a sister group of the heterocystous cyano-bacteria (Fewer et al., 2002) (Table 2). Concerning the non-heterocystous filamentous strains, 69.3% of the sequences matched with CYA781RGC(a). Of
381 sequences from unicellular strains, 92.6% match-ed with the primer CYA781R(b), 5.0% matchmatch-ed with CYA781R(a) and 2.4% did not match. Of the 46 se-quences which did not match with either CYA781R(a) or (b), 11 sequences contain ambiguities, 3 contain gaps, and 32 are due to mismatches. A list of all the se-quences used and their matches is available at http:// www.cip.ulg.ac.be/appendix.htm. Thus, because the polymorphism at position 23 is situated in the region critical for the specificity of annealing during PCR, the reverse primer (a) amplifies preferentially the filamen-tous cyanobacteria, whereas the reverse primer (b) tar-gets mainly the unicellular cyanobacteria.
3.2. Comparison of data when the GC clamp is on the forward or reverse primer
For the three environmental samples 0ES27, 0ES32 and 0ES39, different DGGE patterns were obtained for the six primer combinations used, CYA781R(a), CYA781R(b) CYA359FGC-CYA781R(a+b), CYA781RGC(a), CYA359F-Table 2
Matches for CYA781R(a) and CYA781R(b) primers with 1124 16S rRNA sequences of cyanobacterial strains examined using the Probe Search tool of the software package ARB (Ludwig et al., 2004)
Heterocystous CYA 781R(a) CYA 781R(b) No match Filamentous non-heterocystous CYA 781R(a) CYA 781R(b) No match Unicellular sensu stricto CYA 781R(a) CYA 781R(b) No match
Anabaena sp 82 0 0 Arthrospira sp 4 1 0 Acaryochloris 0 3 0
Anabaenopsis sp 4 0 0 Geitlerinema sp 6 1 0 Aphanocapsa sp 0 1 1
Aphanizomenon sp 31 0 2 Halospirulina sp 4 0 0 Aphanothece sp 0 2 0
Capsosira sp 1 0 0 Leptolyngbya sp 0 20 3 Chamaesiphon sp 0 1 1
Calothrix sp 8 0 2 Limnothrix sp 2 3 0 Cyanobium sp 0 4 0
Chlorogloeopsis sp 3 0 0 Lyngbya sp 9 0 3 Cyanothece sp 0 8 0
Chroococcidopsis sp 16 3 3 Microcoleus sp 45 0 7 Dactylococcopsis sp 0 1 0
Coleodesmium sp 1 0 2 Oscillatoria sp 24 36 6 Dermocarpa sp 0 13 0
Cylindrospermopsis sp 51 0 0 Phormidium sp 19 19 2 Dermocarpella sp 0 2 0
Cyanospira sp 0 0 1 Planktothricoides sp 6 0 0 Euhalothece sp 0 4 0
Cylindrospermum sp 4 0 0 Planktothrix sp 85 1 0 Gloeocapsa sp 0 2 0
Fischerella sp 9 0 0 Plectonema sp 0 2 0 Gloeothece sp 0 4 0
Gloeobacter sp 3 0 0 Pseudanabaena sp 10 1 0 Halothece sp 0 1 0
Hapalosiphon sp 4 0 0 Spirulina sp 6 1 0 Merismopedia sp 0 1 0
Mastigocladopsis sp 1 0 0 Symploca sp 5 0 0 Microcystis sp 0 70 3
Mastigocladus sp 2 0 0 Trichodesmium sp 8 0 0 Myxosarcina sp 0 2 0
Nodularia sp 41 0 0 Tychonema sp 7 0 0 Pleurocapsa sp 0 6 0
Nostoc sp 94 0 4 Total 240 85 21 Prochlorococcus sp 0 26 0
Nostochopsis sp 2 0 0 Percentage 69.3 24.6 6.1 Prochloron sp 0 2 0
Scytonema sp 4 0 2 Prochlorothrix sp 0 5 0 Spirestris sp 3 0 0 Staniera sp 0 3 0 Stigonema sp 2 0 0 Synechococcus sp 18 184 3 Symphyonema sp 2 0 0 Synechocystis sp 1 6 1 Symphyonemopsis sp 1 0 0 Xenococcus sp 0 2 0 Tolypothrix sp 3 0 0 Total 19 353 9 Westiellopsis sp 6 0 0 Percentage 5.0 92.6 2.4 Total 378 3 16 Percentage 95.2 0.8 4.0
CYA781RGC(b) and CYA359F-CYA781RGC(a + b). The numbers of bands obtained for each primer pair varied (Fig. 1) and the average number of bands deter-mined for the patterns obtained with CYA781R(a), CYA781R(b) and CYA359F-CYA781R(a+b) were similar whether the GC clamp was on the forward or reverse primer (6.6 and 5.0; 8.0 and 9.3; 7.3 and 6.0 respectively, Fig. 1). Con-cerning the reamplification of the DGGE bands, a sequence could not be obtained for all band excised. Moreover, identical sequences were obtained from dif-ferent bands in the same lane. This is in agreement with the observation ofNikolausz et al. (2005)that dominant amplicons could be distributed at different positions in the same pattern. If several domains have similar melt-ing properties, stochastic effects might cause one to denaturate before the other in a fraction of the amplicon population and could also explain the presence of dif-ferent bands with the same sequence in one lane. BLAST analyses of the sequences obtained with the GC clamp on the forward and reverse primers gave the same closest relatives for samples 0ES27
(A. flos-aquae PMC9707 and PCC7905 and Synecho-coccus MH305), 0ES32 (A. flos-aquae PMC9707, Synechocystis PCC6803 and Synechococcus MH301) and 0ES39 (Limnothrix redekii CCAP1443/1 and Syne-chocystis PCC6803) (Table 3).
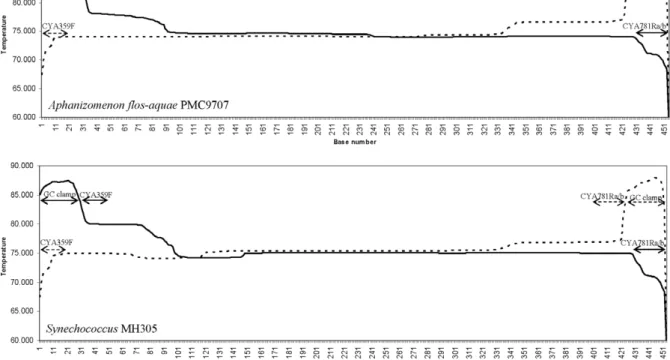
The differences in the banding profiles obtained with the GC clamp on the forward or reverse primer can be explained by the melting properties of the amplicons. The melting profiles obtained for the same sequence with the GC clamp on the forward or reverse primer were different whereas there was no effect with the primers CYA781R(a) and (b) even though these differ from each other by two nucleotides (Fig. 2). The modification of the melting properties could be explained by the GC content of the forward and reverse primers, 55% and 44%, respectively. Thus the reverse primers had a lower melt-ing temperature and this can be observed inFig. 2where the melting temperature of the DNA segment at the 3Vend is lower than that at the 5V end, irrespective of the presence of the GC clamp. When the GC clamp is situated at the 5V end, the lower melting temperature of the reverse primer CYA781R has a more pronounced
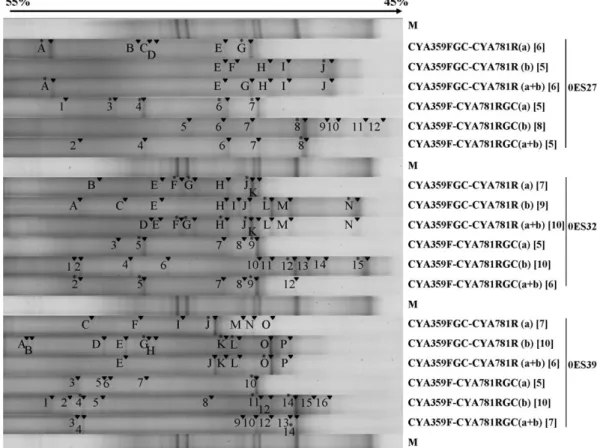
Fig. 1. DGGE patterns and designations of the bands obtained with the 6 primer pairs for samples 0ES27, 0ES32 and 0ES39. Visible bands are indicated by an arrow and bands at the same positions were given the same designation. A star indicates the bands for which a sequence was obtained. The numbers between brackets indicate the number of bands obtained for the lane.
effect, and the double-stranded DNA will melt at a lower temperature. This can also explain why the patterns produced with the GC clamp on the forward primer gave bands situated closer to the top of the DGGE gel. Moreover, several melting domains are observed for the two sequences, irrespective of the position of the GC clamp. Ideal melting profiles are flat, and the presence of several melting domains typically results in extended (fuzzy) bands in the migration direction (Kisand and Wikner, 2003). Such fuzzy bands can be observed for the bands with sequences closely related to
A. flos-aquae PMC9707 and Synechococcus sp.
MH305 (0ES27: bands G, J, 4, 7, 8; 0ES32: bands H, J, 5, 9 in Fig. 1). Furthermore, the polymorphisms in high melting domains might be undetected, because the dissociation of low melting domains, which occurs
earlier, strongly slows down the migration of the frag-ments (Fischer and Lerman, 1983; Wu et al., 1998). 3.3. Comparison of the use of the reverse primers CYA781R(a) and CYA781R(b) used separately or together
The lowest average number of bands observed for the DGGE patterns was obtained when using CYA781R(a) alone (5.8: Fig. 1). The primer pair CYA359F-CYA781R(b) gave the highest average number of bands, irrespective of the GC clamp position (8.6) whereas the mixture of reverse primers gave an interme-diate score (6.6). The diversity of bands obtained was lower when both reverse primers were used together than the sum of the bands obtained separately with the primers Table 3
Results of the BLAST analysis of the sequences obtained from the sequenced DGGE
Sample Primer pair Band
designation
Accession number
Most similar sequence BLAST
Similarity (%) 0ES27 CYA359FGC-CYA781R(a) G AY646774 Aphanizomenon flos-aquae PMC9707 (AJ293130) 100
CYA359FGC-CYA781R(a) A AY646775 Aphanizomenon flos-aquae PCC7905 (AY038035) 99 CYA359FGC-CYA781R(b) J AY646776 Synechococcus sp. MH305 (AY224198) 99 CYA359FGC-CYA781R(a+b) A AY646777 Aphanizomenon flos-aquae PCC7905 99 CYA359F-CYA781RGC(a) 3 AY646778 Aphanizomenon flos-aquae PMC9707 100
4 AY646780
7 AY646781
CYA359F-CYA781RGC(a) 6 AY646779 Aphanizomenon flos-aquae PCC7905 99
CYA359F-CYA781RGC(b) 8 AY646782 Synechococcus sp. MH305 99
CYA359F-CYA781RGC(a+b) 8 AY646783 Synechococcus sp. MH305 99
0ES32 CYA359FGC-CYA781R(a) F AY646784 Aphanizomenon flos-aquae PMC9707 100
G AY646785
J AY646786
CYA359FGC-CYA781R(b) N AY646787 Synechococcus sp. MH301 (AY224199) 97 CYA359FGC-CYA781R(b) L AY646788 Synechocystis sp. PCC6803 (AY224195) 94 CYA359FGC-CYA781R(a+b) F AY646789 Aphanizomenon flos-aquae PMC9707 100
G AY646790
H AY646791
J AY646792
CYA359F-CYA781RGC(a) 5 AY646793 Aphanizomenon flos-aquae PMC9707 100
9 AY646794
CYA359F-CYA781RGC(b) 15 AY646795 Synechococcus sp. MH301 97
CYA359F-CYA781RGC(b) 12 AY646796 Synechocystis sp. PCC6803 94
CYA359F-CYA781RGC(a+b) 2 AY646797 Aphanizomenon flos-aquae PMC9707 100
5 AY646798
9 AY646799
0ES39 CYA359FGC-CYA781R(a) J AY646800 Limnothrix redekei CCAP 1443/1 (AJ580007) 99
CYA359FGC-CYA781R(b) G AY646801 Synechocystis sp. PCC6803 94
K AY646802
L AY646803
CYA359FGC-CYA781R(a+b) O AY646804 Synechocystis sp. PCC6803 94
CYA359F-CYA781RGC(a) 10 AY646805 Limnothrix redekei CCAP 1443/1 99
CYA359F-CYA781RGC(b) 4 AY646806 Synechocystis sp. PCC6803 94
11 AY646807
14 AY646808
(a) and (b). This result is supported by the DGGE pat-terns (Fig. 1).
In sample 0ES27, with the GC clamp on the forward primer, 10 bands (A to J) were produced in total for the separate primers instead of 6 with the combined primers (A, E, G, H, I, J,Fig. 1). With CYA359F-CYA781RG-C(a + b), five bands were present in the DGGE pattern (2, 4, 6, 7, 8) whereas 11 bands were detected with the separate reverse primers.
Concerning sample 0ES32, 13 bands were obtained with the GC clamp on the forward primer with separate reverse primers (bands A, B, C, E, F, G, H, I, J, K, L, M, N) while only 10 bands could be observed when the reverse primers were mixed. With the GC clamp on the reverse primer, 15 bands in total were obtained for the separate reverse primers (1 to 15) and 6 bands (2, 5, 7, 8, 9, 12) when a combination of both primers were used. For 0ES39 and CYA359FGC, 16 bands were thus recovered in total (A to P). With the mixture of the reverse primers, 6 bands were visible. When the GC clamp was on the reverse primer, 7 bands were visible in the pattern obtained with the mixture of the reverse
primers (3, 4, 9, 10, 12, 13, 14) and 14 when the number of bands in the separate patterns were summed. For each of the samples analysed, with the GC clamp on the forward primer, only one type of sequence was recovered with the mixture of the reverse primers. The same result was obtained with the GC clamp on the reverse primer. The sequences are related to Aphanizo-menon flos-aquae PCC7905 (with the GC clamp on the forward primer) or to Synechococcus MH305 (with the GC clamp on the reverse primer) for 0ES27, to Apha-nizomenon flos-aquae PMC9707 for 0ES32, and to Synechocystis PCC6803 for 0ES39.
With the separate PCR amplifications and irrespec-tive of the position of the GC clamp, a higher number of genera was detected than with the mixture of primers according to the sequences obtained. Two (related to L. redekei CCAP 1443/1 and Synechocystis PCC6803 for 0ES39) or three (related to A. flos-aquae PMC9707, A. flos-aquae PCC7905 and
Synechococ-cus MH305 for 0ES27 and to A. flos-aquae
PMC9707, Synechococcus MH301 and Synechocystis PCC6803 for 0ES32) sequences were obtained. These Fig. 2. Melting profiles obtained with the primer pair CYA359FGC-CYA781R(a/b), (solid line) and CYA359F-CYA781RGC(a/b) (dotted line) for sequence positions 378–781 of the 16S rRNA sequence of Aphanizomenon flos-aquae PMC9707 and for Synechococcus MH305. CYA781R(a/b) indicates CYA781R(a) or CYA781R(b) as identical profiles that were produced with primers CYA359F-CYA781R(a) and CYA359F-CYA781R(b), with the GC clamp on the forward or reverse primer. The zones corresponding to the primers and the GC clamp are indicated by an arrow.
results are congruent with the theoretical match of the reverse primers.
It is believed that, when used together, the reverse primers compete to template hybridization between them, and the genetic fingerprint obtained is thus less complete. By making separate amplifications with the reverse primers (a) and (b), a more complete picture of the real diversity of the environmental sample can be obtained. If we consider sample 0ES32, four and three sequences related to the filamentous cyanobacterium A. flos-aquae were obtained with CYA359FGC-CYA781R(a + b) and CYA359F-CYA781RGC(a + b), respectively. This taxa probably dominated the environmental sample. Only when primer (b) was used alone could the unicellular populations (related to Synechococcus sp. MH301 and Synechocystis sp. PCC6803) be detected. Thus, the use of separate primers is recommended, especially when performing straightforward excisions and reamplifica-tions of bands, where it is not always possible to obtain sequences of all bands.
4. Conclusion
DGGE was originally designed to detect point muta-tions in human genomic DNA (Sheffield et al., 1989). In medical research, detection of mutations by DGGE can be optimized by careful analysis of the melting profiles and adaptations of the primers. This is not possible when using this method for community analysis. In addition, for cyanobacteria, the primers described byNu¨bel et al. (1997) are the only specific primers available. The results of our study show that the banding patterns obtained with the GC clamp on the forward or on the reverse primer varies and this is due to the influence of the GC clamp position on the melting profile. Neverthe-less, the number of bands observed are very similar irrespective of the position of the GC clamp. Moreover, except when using reverse primers mixed with sample 0ES27, the same band sequences were obtained with the GC clamp on the forward or reverse primer.
In addition, we advise to use the reverse primers CYA781R(a) and (b) separately. It gives a more complete view of the cyanobacterial community composition. The primers (a) and (b) target filamentous and unicellular cyanobacteria, respectively, and their separate use allows the two different types of populations to be revealed. Acknowledgments
This work was funded by the European Union under the project MIDI-CHIP (EVK2-CT1999-00026) and the Belgian Federal Science Policy under the project
B-BLOOMS (EVK2/34). We thank the Public Research Center Gabriel Lippmann (Luxembourg) for collecting water samples. The authors acknowledge Denis Baurain and Arnaud Taton for managing the ARB database of cyanobacterial sequences. Thanks are due to Antoine Kremer (INRA Pierroton, France) and Xavier Vekemans (Universite´ Libre de Bruxelles, Brussels, Belgium) for helpful advices. We thank Tony Collins for correcting the English language and anonymous reviewers for help-ful comments. The reference DGGE marker was kindly provided by Pirjo Rajaniemi (University of Helsinki, Fin-land). A. Wilmotte is Associate Researcher of the Nation-al Fund for Scientific Research of Belgium (FNRS). Appendix A. Supplementary data
Supplementary data associated with this article can be found, in the online version, at doi:10.1016/ j.mimet.2005.09.017.
References
Abed, R.M., Garcia-Pichel, F., Hernandez-Marine, M., 2002. Poly-phasic characterization of benthic, moderately halophilic, moder-ately thermophilic cyanobacteria with very thin trichomes and the proposal of Halomicronema excentricum gen. nov., sp. nov. Arch. Microb. 177, 361 – 370.
Casamayor, E.O., Schafer, H., Baneras, L., Pedros-Alio, C., Muyzer, G., 2000. Identification of and spatio-temporal differences be-tween microbial assemblages from two neighboring sulfurous lakes: comparison by microscopy and denaturing gradient gel electrophoresis. Appl. Environ. Microbiol. 66, 499 – 508. Diez, B., Pedros-Alio, C., Marsh, T.L., Massana, R., 2001.
Applica-tion of denaturing gradient gel electrophoresis (DGGE) to study the diversity of marine picoeukaryotic assemblages and compar-ison of DGGE with other molecular techniques. Appl. Environ. Microbiol. 67, 2942 – 2951.
Ercolini, D., 2004. PCR-DGGE fingerprinting: novel strategies for detection of microbes in food. J. Microbiol. Methods 56, 297 – 314.
Fewer, D., Friedl, T., Bu¨del, B., 2002. Chroococcidiopsis and hetero-cyst-differentiating Cyanobacteria are each other’s closest living relatives. Mol. Phylogenet. Evol. 23, 82 – 90.
Fischer, S.G., Lerman, L.S., 1983. DNA fragments differing by single base-pair substitutions are separated in denaturing gradient gels: correspondence with melting theory. Proc. Natl. Acad. Sci. U. S. A. 80, 1579 – 1583.
Garcia-Pichel, F., Lopez-Cortes, A., Nubel, U., 2001. Phylogenetic and morphological diversity of cyanobacteria in soil desert crusts from the Colorado plateau. Appl. Environ. Microbiol. 67, 1902 – 1910.
Garcia-Pichel, F., Johnson, S.L., Youngkin, D., Belnap, J., 2003. Small-scale vertical distribution of bacterial biomass and diversity in biological soil crusts from arid lands in the Colorado plateau. Microbial. Ecol. 46, 312 – 321.
Geiß, U., Selig, U., Schumann, R., Steinbruch, R., Bastrop, R., Hagemann, M., Schoor, A., 2004. Investigations on
cyanobacter-ial diversity in a shallow estuary (Southern Baltic Sea) including genes relevant to salinity resistance and iron starvation acclima-tion. Environ. Microbiol. 6, 377 – 387.
Giovannoni, S.J., DeLong, E.F., Schmidt, T.M., Pace, N.R., 1990. Tangential flow filtration and preliminary phylogenetic analysis of marine picoplankton. Appl. Environ. Microbiol. 56, 2572 – 2575. Kisand, V., Wikner, J., 2003. Limited resolution of 16S rDNA DGGE caused by melting properties and closely related DNA sequences. J. Microbiol. Methods 54, 183 – 191.
Lerman, L.S., Silverstein, K., 1987. Computational simulation of DNA melting and its application to denaturing gradient gel elec-trophoresis. Methods Enzymol. 155, 482 – 501.
Ludwig, W., Strunk, O., Westram, R., Richter, L., Meier, H., Yadhu-kumar, Buchner, A., Lai, T., Steppi, S., Jobb, G., Forster, W., Brettske, I., Gerber, S., Ginhart, A.W., Gross, O., Grumann, S., Hermann, S., Jost, R., Konig, A., Liss, T., Lussmann, R., May, M., Nonhoff, B., Reichel, B., Strehlow, R., Stamatakis, A., Stuck-mann, N., Vilbig, A., Lenke, M., Ludwig, T., Bode, A., Schleifer, K.-H., 2004. ARB: a software environment for sequence data. Nucleic Acids Res. 32, 1363 – 1371.
Lyautey, E., Lacoste, B., Ten-Hage, L., Rols, J.L., Garabetian, F., 2005. Analysis of bacterial diversity in river biofilms using 16S rDNA PCR-DGGE: methodological settings and fingerprints in-terpretation. Water Res. 39, 380 – 388.
Muyzer, G., 1999. DGGE/TGGE: a method for identifying genes from natural ecosystems. Curr. Opin. Microbiol. 2, 317 – 422. Myers, M.R., Fischer, S.G., Lerman, L.S., Maniatis, M., 1985. Nearly all single base substitutions in DNA fragments joined to a GC-clamp can be detected by denaturing gradient gel electrophoresis. Nucleic Acids Res. 13, 3131 – 3145.
Nikolausz, M., Sipos, R., Revesz, S., Szekely, A., Marialigeti, K., 2005. Observation of bias associated with re-amplification of DNA isolated from denaturing gels. FEMS Microbiol. Lett. 244, 385 – 390.
Nollau, P., Wagener, C., 1997. Methods for detection of point muta-tions: performance and quality assessment. Clin. Chem. 43, 1114 – 1128.
Nu¨bel, U., Garcia-Pichel, F., Muyzer, G., 1997. PCR primers to amplify 16S rRNA genes from cyanobacteria. Appl. Environ. Microb. 63, 3327 – 3332.
Sheffield, V.C., Cox, D.R., Lerman, L.S., Myers, R.M., 1989. Attach-ment of a 40-base-pair G+C-rich sequence (GC-clamp) to ge-nomic DNA fragments by the polymerase chain reaction results in improved detection of single-base changes. Proc. Natl. Acad. Sci. U. S. A. 86, 232 – 236.
Sekiguchi, H., Tomioka, N., Nakahara, T., Uchiyama, H., 2001. A single band does not always represent single bacterial strains in denaturing gradient gel electrophoresis analysis. Biotechnol. Lett. 23, 1205 – 1208.
Speksnijder, A.G.C.L., Kowalchuk, G.A., De Jong, S., Kline, E., Stephen, J.R., Laanbroekm, H.J., 2001. Microvariation artifacts introduced by PCR and cloning of closely related 16S rRNA gene sequences. Appl. Environ. Microbiol. 67, 469 – 472.
Taton, A., Grubisic, S., Brambilla, E., De Wit, R., Wilmotte, A., 2003. Cyanobacterial diversity in natural and artificial microbial mats of Lake Fryxell (McMurdo Dry Valleys, Antarctica): a morpholog-ical and molecular approach. Appl. Environ. Microbiol. 69, 5157 – 5169.
Wilmotte, A., Demonceau, C., Goffart, A., Hecq, J.-H., Demoulin, V., Crossley, A.C., 2002. Molecular and pigment studies of the picophytoplankton in a region of the Southern Ocean (428–548 S, 1418–1448 E) in March 1998. Deep-Sea Res., Part 2, Top. Stud. Oceanogr. 49, 3351 – 3363.
Wintzingerode, F.v., Go¨bel, U.B., Stackebrandt, E., 1997. Determi-nation of microbial diversity in environmental samples: pitfalls of PCR-based rRNA analysis. FEMS Microbiol. Rev. 21, 213 – 229.
Wu, Y., Hayes, V.M., Osinga, J., Mulder, I.M., Looman, M.W.G., Buys, C.H.C.M., Hofstra, M.W., 1998. Improvement of fragment and primer selection for mutation detection by denaturing gradient gel electrophoresis. Nucleic Acids Res. 26, 5432 – 5440. Yu, Z., Morrison, M., 2004. Comparisons of different hypervariable
regions of rrs genes for use in fingerprinting of microbial com-munities by PCR-Denaturating Gradient Gel Electrophoresis. Appl. Environ. Microbiol. 70, 4800 – 4806.
Zwart, G., Kamst-van Agterveld, M.P., van der Werff-Staverman, I., Hagen, F., Hoogveld, H.L., Gons, H.J., 2005. Molecular charac-terization of cyanobacterial diversity in a shallow eutrophic lake. Environ. Microbiol. 7, 365 – 377.