Autocrine/Paracrine Activation of the GABA
A
Receptor
Inhibits the Proliferation of Neurogenic Polysialylated
Neural Cell Adhesion Molecule-Positive (PSA-NCAM
⫹
)
Precursor Cells from Postnatal Striatum
Laurent Nguyen,
1Brigitte Malgrange,
1Ingrid Breuskin,
1Lucien Bettendorff,
1Gustave Moonen,
1,2Shibeshih Belachew,
1,2* and Jean-Michel Rigo
1*
1Center for Cellular and Molecular Neurobiology, University of Lie`ge, B-4020 Lie`ge, Belgium, and2Department of Neurology, University of Lie`ge, C.H.U.
Sart Tilman, B-4000 Lie`ge, Belgium
GABA and its type A receptor (GABA
AR) are present in the immature CNS and may function as growth-regulatory signals during the
development of embryonic neural precursor cells. In the present study, on the basis of their isopycnic properties in a buoyant density
gradient, we developed an isolation procedure that allowed us to purify proliferative neural precursor cells from early postnatal rat
striatum, which expressed the polysialylated form of the neural cell adhesion molecule (NCAM). These postnatal striatal
PSA-NCAM
⫹cells were shown to proliferate in the presence of epidermal growth factor (EGF) and formed spheres that preferentially
generated neurons
in vitro. We demonstrated that PSA-NCAM
⫹neuronal precursors from postnatal striatum expressed GABA
A
R
subunits
in vitro and in situ. GABA elicited chloride currents in PSA-NCAM
⫹cells by activation of functional GABA
A
R that displayed a
typical pharmacological profile. GABA
AR activation in PSA-NCAM
⫹cells triggered a complex intracellular signaling combining a tonic
inhibition of the mitogen-activated protein kinase cascade and an increase of intracellular calcium concentration by opening of
voltage-gated calcium channels. We observed that the activation of GABA
AR in PSA-NCAM
⫹neuronal precursors from postnatal striatum
inhibited cell cycle progression both in neurospheres and in organotypic slices. Furthermore, postnatal PSA-NCAM
⫹striatal cells
synthesized and released GABA, thus creating an autocrine/paracrine mechanism that controls their proliferation. We showed that EGF
modulated this autocrine/paracrine loop by decreasing GABA production in PSA-NCAM
⫹cells. This demonstration of GABA synthesis
and GABA
AR function in striatal PSA-NCAM
⫹cells may shed new light on the understanding of key extrinsic cues that regulate the
developmental potential of postnatal neuronal precursors in the CNS.
Key words: GABA
Areceptors; newborn rat striata; proliferation; PSA-NCAM; whole-cell patch-clamp; RT-PCR; HPLC;
immunocytochemistry
Introduction
During CNS development, all types of neurons and glial cells are
derived from primordial neural stem cells (NSCs) (Edlund and
Jessell, 1999) and emerge, according to a precise time schedule,
through a complex sequence of intermediate precursors.
Al-though the conventional view of the adult CNS used to be a
structurally constant organ, recent experimental evidence
deter-mined that cells are regularly added de novo to several CNS areas
during adulthood (for review, see Gross, 2000). NSCs are defined
by their ability to self-renew and to generate the main cell lineages
of the CNS (McKay, 1997). NSCs have been isolated from
em-bryonic and newborn CNS as well as from specific restricted
re-gions of the adult mammalian CNS, including the subventricular
zone [(SVZ) postnatally termed the subependymal zone] and the
dentate gyrus of the hippocampus (for review, see Weissman et
al., 2001). At early stages of CNS cell fate determination, NSCs
give rise to progenitors that express the polysialylated form of the
neural cell adhesion molecule (PSA-NCAM) (Doetsch et al.,
1999). Many tissues expressing PSA-NCAM during development
show a progressive loss of PSA carbohydrate residues, but
PSA-NCAM
⫹cells persist in several adult brain regions in which
neu-ronal plasticity and sustained formation of new neurons occur
(Bonfanti et al., 1992; Seki and Arai, 1993; Doetsch et al., 1997).
PSA-NCAM has been shown to be involved in changes of cell
morphology that are necessary for motility, axonal guidance,
syn-apse formation, and functional plasticity in the CNS (for review,
see Yoshida et al., 1999; Bruses and Rutishauser, 2001).
Although they are already restricted to either a glial (Trotter et
Received July 31, 2002; revised Jan. 27, 2003; accepted Jan. 29, 2003.
WearegratefultoDr.P.Legendre(Universite´PierreetMarieCurie,Paris,France)forprovidinghelpfulcomments on this manuscript. We thank B. Rogister (Universite´ de Lie`ge, Lie`ge, Belgium), G. Rougon (Universite´ de la Me´di-terrane´e, Marseille, France), and J. Eriksson (University of Turku, Turku, Finland) for their generous gifts of antibod-ies. We thank P. Ernst-Gengoux, A. Brose, and M. Louvet for their technical support and expertise. B. Malgrange and S. Belachew are research associate and postdoctoral researcher, respectively, of the Fonds National de la Recherche Scientifique (FNRS) (Belgium). This work was supported by the Fonds pour la Formation a` la Recherche dans l’Industrie et dans l’Agriculture, the FNRS, the Fondation Me´dicale Reine Elisabeth, the Fondation Charcot, and the Ligue Belge de la Scle´rose en Plaques.
*S.B. and J.-M.R. contributed equally to this work.
Correspondence should be addressed to L. Nguyen, Center for Cellular and Molecular Neurobiology, University of Lie`ge, 17 Place Delcour, B-4020 Lie`ge, Belgium. E-mail: [email protected].
al., 1989; Grinspan and Franceschini, 1995; Ben Hur et al., 1998;
Vitry et al., 1999) or a neuronal (Mayer-Proschel et al., 1997)
preferential fate, cultured PSA-NCAM
⫹progenitors preserve a
relative degree of pluripotentiality (Marmur et al., 1998; Vitry et
al., 2001). Considering that PSA-NCAM
⫹cells can be neatly used
for brain repair purposes (Keirstead et al., 1999; Vitry et al.,
2001), there is much interest in studying signaling factors that
regulate their development. In this regard, it has been known for
many years that neurotransmitters, which belong to the
micro-environment of neural cells in vivo, regulate morphogenetic
events preceding synaptogenesis such as cell proliferation,
migra-tion, differentiamigra-tion, and death (for review, see Nguyen et al.,
2001). Along this line, previous reports have suggested that
GABA, the major inhibitory neurotransmitter in the mammalian
brain, exerts trophic roles during CNS embryonic and postnatal
development (Barker et al., 1998).
To investigate whether GABA may control the proliferation of
postnatal PSA-NCAM
⫹neural precursors, we first established an
isolation procedure that allows the purification of PSA-NCAM
⫹precursors from newborn rat striata. Using this in vitro
prepara-tion together with postnatal striatal organotypic slices, we report
the following: (1) epidermal growth factor (EGF)-responsive
proliferative PSA-NCAM
⫹precursors generate spheres
commit-ted mostly to a neuronal fate; (2) postnatal PSA-NCAM
⫹precur-sors express functional type A GABA receptors (GABA
ARs) and
glutamate decarboxylase (GAD) 65 and GAD 67; (3)
prolifera-tion of PSA-NCAM
⫹precursors is inhibited by an
EGF-controlled endogenous production of GABA that activates
GABA
AR in these cells; and (4) GABA
AR-dependent inhibition of
PSA-NCAM
⫹cell proliferation is mediated by a complex
intra-cellular signaling involving notably the inhibition of the
mitogen-activated protein kinase (MAPK) pathway and an increase of
intracellular calcium concentration by opening of voltage-gated
calcium channels.
Materials and Methods
Sequential purification of PSA-NCAM⫹progenitors. Newborn Wistar rats (0- to 3-d-old rat pups) were raised from our animal facility. They were killed following National Institutes of Health animal welfare guidelines. Briefly, rats were anesthetized and subsequently decapitated. Striata were dissected out and collected in PBS solution supplemented with glucose at 4.5 gm/l. Next, isolated striata, possibly including small parts of subven-tricular zones, were gently triturated in PBS-HEPES (25 mM) by passing
through a fire-polished Pasteur pipette before being filtered with a 15m nylon mesh. The cell suspension was then layered on top of a pre-centrifuged (15 min at 26,000⫻ g) Percoll density gradient (1.04 gm/ml; Amersham Biosciences, Uppsala, Sweden) and further ultracentrifuged for 15 min at 26,000⫻ g. Proliferating PSA-NCAM⫹precursor cells were separated from differentiated postmitotic neural cells and cell debris by collecting the interphase located between the bands at 1.052 and 1.102 gm/ml as determined by using density marker beads (Amersham Bio-sciences) for the calibration of the Percoll gradient after centrifugation (Maric et al., 1997) (see Fig. 1 A, B). The resulting suspension was then centrifuged three times (10 min at 400⫻ g) in PBS-HEPES to eliminate Percoll. The final pellet was resuspended in DMEM/F12 (1:1, v/v; In-vitrogen, Merelbeke, Belgium) medium supplemented with 1% (v/v) N2 (25g/ml bovine insulin, 100 g/ml transferrin, 20 nMprogesterone, 60
Mputrescine, 30 nMsodium selenite), 1% (v/v) B27 (Invitrogen) with
or without EGF (20 ng/ml) supplementation (PeproTech, Rocky Hill, NJ). We refer hereafter to these media as either containing or EGF-free medium. The final cell suspension was plated either in 50l droplets on poly-ornithine-coated (Becton Dickinson, Erembodegem, Belgium) coverslips at a density of 2.106cells/ml for immunocytochemical studies
or onto uncoated nonadherent T25 culture flasks in 5 ml of EGF-containing medium at a density of 2.105cells/ml (Sarstedt, Newton,
NC). Cells grown in uncoated conditions generated floating spheres (see Fig. 1 I). After 3 d in EGF-containing medium, growing spheres were allowed to attach for 1 hr on poly-ornithine-coated coverslips before being used further for patch-clamp recordings or immunocytochemical studies.
Immunostainings. Cultures were fixed with 4% (v/v) paraformalde-hyde for 10 min at room temperature and permeabilized in 0.1% Triton X-100 (v/v) for 15 min during which subsequent immunostainings were directed toward cytoplasmic epitopes. For anti-GABAA␣ subunit
stain-ing, cells were fixed with a methanol/acetic acid (95:5, v/v) mixture for 5 min. For all immunostainings, nonspecific binding was blocked by a 30 min treatment in a PBS solution containing nonfat dry milk (15 mg/ml). Cells were then incubated overnight at 4°C with primary antibodies, i.e., mouse anti-PSA-NCAM at 1:500 (anti-Men-B antibody; generous gift from G. Rougon, Universite´ de la Me´diterrane´e, Marseille, France), rab-bit anti-nestin at 1:400 (generous gift from Prof. J. Eriksson, University of Turku, Turku, Finland), mouse anti-A2B5 at 1:100 (Boehringer Mann-heim, Mannheim. Germany), mouse anti-III tubulin at 1:1500 (clone Tuj1, Babco, Richmond, CA), mouse anti-MAP2ab at 1:100 (clone AP20, Boehringer Mannheim), mouse monoclonal anti-O4 at 1:150 (Chemi-con, Temecula, CA), rabbit anti-glial fibrillary acidic protein (GFAP) at 1:1500 (Dako, Prosan, Belgium), rabbit anti-NF-M at 1:350 (Chemicon), mouse anti-synaptophysin at 1:200 (Sigma-Aldrich, Bornem, Belgium), goat anti-GABAA␣ subunits (␣1–␣3,␣5) at 1:40 (clone C-20, Santa Cruz
Biotechnology, Santa Cruz, CA), goat anti-GABAA1–3subunits at 1:50
(clone N-19, Santa Cruz Biotechnology), goat anti-GABAA␥1– 4subunits
antibody at 1:50 (clone M-20, Santa Cruz Biotechnology), rabbit anti-GABA at 1:400 (Incstar, Stillwater, MN), rabbit anti-GAD (GAD 67) at 1:500 (Biogenesis, Poole, UK), and rabbit anti-GAD 65 at 1:50 (clone H-95, Santa Cruz Biotechnology). Secondary antibodies were diluted in PBS solution and applied for 45 min at room temperature. These in-cluded Cy5-, FITC-, or TRITC-conjugated anti-rabbit Ig antibodies (1: 500), Cy5-, FITC-, or TRITC-conjugated anti-mouse IgG (1:500), and Cy5-, FITC-, or TRITC-conjugated anti-mouse IgM (all from Jackson ImmunoResearch Laboratory, West Grove, PA), or FITC- or TRITC-conjugated anti-mouse IgG2a (ImTec Diagnostics, Antwerp, Belgium).
Three rinses in PBS were performed between different steps. Prepara-tions were mounted in Fluoprep (Biomerieux). Images were acquired using a laser scanning confocal microscope (MRC1024, Bio-Rad, Hert-fordshire, UK).
For quantitative immunostainings, before immunocytochemical pro-cedure, spheres were mechanically dissociated and further plated onto poly-ornithine-coated coverslips. Cells were allowed to attach for 1 hr before fixation. For counting, cells were counterstained with the nuclear dye ethidium homodimer-1 (Etd1) (applied at 6.10⫺ 7Mfor 7 min;
Mo-lecular Probes, Leiden, The Netherlands) or Hoescht 33258 (0.4g/ml for 15 min). Ten nonoverlapping microscopic fields (⫾50 cells per field) (Axiovert 135 fluorescence microscope, 40⫻ objective; Zeiss) were counted for each coverslip in a minimum of two or three separate experiments.
Frozen 30m tissue sections were prepared as described previously (Yuan et al., 2002). Immunohistochemical stainings were processed fol-lowing a procedure identical to that of cultured cells.
Electrophysiological recordings. For patch-clamp recordings, Cell-Tak (Becton Dickinson)-coated coverslips containing 1–3 hr adhesive spheres were transferred to the stage of a Zeiss interferential contrast microscope equipped with fluorescence. Coverslips were maintained at 37°C in a recording chamber that was perfused continuously with a saline solution containing (in mM): 116.0 NaCl, 11.1D-glucose, 5.4 KCl, 5.4, 1.8
CaCl2䡠2H2O, 2.0 MgCl2䡠6H2O, 10.0 HEPES, pH 7.2. Cs⫹-containing
solutions were composed as follows (in mM): 116.0 NaCl, 5.4 CsCl, 11.1 D-glucose, 1.8 CaCl2䡠2H2O, 2.0 MgCl2䡠6H2O, 9.0 HCl, 5.0 HEPES, 26.2
NaHCO3, 5.0 BaCl2䡠2H2O, pH 7.2. Low chloride solution contained (in
mM): 8.0 NaCl, 108.0 Na-gluconate, 5.4 CsCl, 5.4, 11.1 D-glucose,
1.8 CaCl2䡠2H2O, 2.0 MgCl2䡠6H2O, 17.0 HCl, 5.0 HEPES, 26.2 NaHCO3,
5.0 BaCl2䡠2H2O, pH 7.4. All drugs were applied by a microperfusion
system (SPS-8, List Medical). Borosilicate recording electrodes (15–20 M⍀) were made using a Flaming-Brown microelectrode puller (P97, Sutter Instruments Novato, CA). Micropipettes were filled with an
intracellular-like solution containing (in mM): 130.0 KCl, 1.0 CaCl2䡠2H2O, 11.1D-glucose, 10.0 EGTA, 2.5 Na2-ATP, 2.5 Mg-ATP, 10.0
HEPES, pH 7.4. In Cs⫹-containing pipettes, used for the establishment of the GABA-evoked current–voltage relationship, KCl was equimolarly replaced by CsCl and BaCl2䡠2H2O was added at 5 mMto block K⫹
chan-nels. Current–voltage relationships were obtained using a series of volt-age steps (ranging from⫺140 to ⫹100 mV) before, during, and after application of GABA. The current–voltage curve was established by fit-ting experimental data to the Goldman-Hodgkin and Katz equation:
IS⫽ PS 䡠 ZS 䡠 E 䡠 F2 R 䡠 T 䡠 关S兴i⫺关S兴o 䡠 exp
冉
⫺ZS 䡠 F䡠 E R 䡠 T冊
1⫺ exp冉
⫺ZS 䡠 F 䡠 E R 䡠 T冊
,where Iscorresponds to the current generated (ampere), Psthe mem-brane permeability, Zsthe valence, [S]ithe intracellular concentration (M䡠l⫺ 1), and [S]othe extracellular concentration (M䡠l⫺ 1) of the ion S,
respectively. E corresponds to the membrane potential, F is the Faraday’s constant, R is the ideal gas constant, and T is the absolute temperature. Electrophysiological recordings were performed with a patch-clamp am-plifier (RK400, Bio-Logic, Claix, France) using the whole-cell configura-tion of the patch-clamp recording technique (Hamill et al., 1981). Cells were injected with Lucifer yellow (Molecular Probes) (1g/ml Lucifer yellow solution in the recording pipette) during voltage-clamp record-ings to allow their post hoc immunocytochemical characterization. Series resistances (10 –20⍀) were electronically compensated (80–85%), and current traces were filtered at 3 kHz, acquired and digitized at 0.5 kHz, and stored on an personal computer system. Control of drug application, data acquisition, and data analysis was achieved using an ITC-16 acqui-sition board (Instrutech Corporation, Great Neck, NY) and the TIDA for Windows software (HEKA Elektronik Lombrecht/Pfolz, Germany).
RT-PCR. Total RNAs from adult Wistar rat brains and from PSA-NCAM⫹spheres derived from postnatal day 0 (P0)–P3 Wistar rat striata were extracted and purified using the RNAgents Total RNA Isolation System kit (Promega, Leiden, The Netherlands). One microgram of total RNA was reverse transcribed using primers with oligo-dT and 200 U of reverse transcriptase (Kit Superscript 1, Life Technologies). Two micro-liters resulting from the RT reaction were used as template and added to 50l of PCR reaction mixture containing 0.2 Mof both forward and
reverse primers synthesized by Eurogentec (Seraing, Belgium) (see Table 1), 0.2 mMof each dNTP, 1.5 mMof MgCl2, and 5 U of Taq Polymerase
(Promega). The PCR program was run with an MJ Research PTC 200 instrument. The thermal cycling protocol started with a 2 min preincu-bation at 94°C followed by 35 cycles made (1) 30 sec at 94°C, (2) 30 sec at 60°C, and (3) 30 sec at 72°C. The protocol was finally completed by an extension step at 72°C for 7 min. We used 64°C for the annealing of␣3 primers and 55°C for␥3, GAD 65, and GAD 67 primers. Ten microliters of the PCR reaction were analyzed in a 1.4% agarose gel in Tris–acetic acid–EDTA (TAE) buffer.
Bromodeoxyuridine and [3H]thymidine incorporation assays. After 2 d
of growth in EGF-containing medium (as described previously), PSA-NCAM⫹spheres were harvested, centrifuged (10 min at 200⫻ g), and rinsed three times in the EGF-free medium before being transferred into uncoated nonadherent T25 culture flasks (Sarstedt) in mitogen-free me-dium. After 24 hr in this medium, bromodeoxyuridine (BrdU) (20M;
Sigma), which is a S-phase marker, was added to the cultures for 18 hr before fixation and staining. All treatments were performed simulta-neously with the addition of BrdU. PSA-NCAM,III tubulin, O4, and GFAP immunolabelings were performed as described above. Coverslips were then postfixed for 10 min in 4% (v/v) paraformaldehyde, perme-abilized in 0.1% Triton X-100 for 10 min, incubated in 0.07N NaOH for 10 min, and finally postfixed again for 10 min before incubation with an anti-BrdU FITC-conjugated antibody for 45 min (1:3, v/v; Becton-Dickinson). The preparations were mounted in Fluoprep and imaged using a Bio-Rad MRC1024 laser scanning confocal microscope. The frac-tion of cells that incorporated BrdU was determined by counting 10 nonoverlapping microscopic fields (⫾50 cells per field) (Axiovert 135
fluorescence microscope, 40⫻ objective, Zeiss) for each coverslip in at least three separate experiments.
In similar culture conditions, the proliferation of PSA-NCAM⫹ spheres was also quantified by measuring the incorporation of [3
H]thy-midine (Amersham Biosciences, Roosendaal, The Netherlands). All treatments were performed simultaneously with the addition of [3H]thymidine (2 Ci/ml) to the medium for 18 hr. Cultures were
washed three time with PBS and digested with NaOH (0.1N), and the radioactivity was counted in a liquid scintillation counter (Wallac Win-Spectral 1414 liquid scintillation counter, Turku, Finland). The [3
H]thy-midine incorporation was normalized for cellular protein concentration measured by the Bradford technique (Bradford, 1976) and expressed as disintegrations per minute of [3H]thymidine incorporated per
milli-gram of protein. Results from the treated conditions were then expressed as percentages of control values. We always performed three separate experiments in triplicate wells for each condition.
Terminal deoxynucleotidyl transferase-mediated dUTP nick end labeling assay. To assess apoptosis occurring in our cultures, spheres were gently dissociated after treatments, and cells were plated for 15–30 min on Cell-Tak (Becton Dickinson)-coated coverslips at a density of 2.106cells/
ml. Terminal deoxynucleotidyl transferase-mediated dUTP nick end la-beling (TUNEL) staining was then performed according to the method of Gavrieli et al.(1992), using the ApopTag fluorescent detection kit (On-cor, Gaithersburg, MD). Cultures were fixed with 4% paraformaldehyde for 10 min at room temperature. Equilibration buffer was then applied for 30 min at 20°C. Cultures were incubated with working strength stop/ wash buffer, washed, and further incubated with anti-digoxigenin–FITC. For cell counting, cultures were counterstained with ethidium homodimer-1 (Molecular Probes; applied at 6.10⫺ 7Mfor 7 min). Ten
nonoverlapping microscopic fields (⫾50 cells per field) (Axiovert 135 fluorescence microscope, 40⫻ objective, Zeiss) were counted for each coverslip in a minimum of three separate experiments.
HPLC procedure. We used an adaptation of a procedure described previously (Bettendorff et al., 1996). Cultures of PSA-NCAM⫹spheres (25 mg) were homogenized in 1 ml of an 80% ethanol solution at 0°C in a glass– glass homogenizer (Potter-Elvehjem device). Homogenates were centrifuged (30 min at 5000⫻ g), and the supernatants were saved. The pellets were resuspended in 1 ml of a 60% ethanol solution, homoge-nized, and centrifuged as described above. The second supernatant was pooled with the first, and the liquids were evaporated under a stream of nitrogen. The residue was dissolved in 300l of water and centrifuged (30 min, 5000⫻ g). An aliquot of 100l from the supernatant was added to 100l of LiCO3(80 mM, pH 8.5) before dansylation by addition of 100
l dansyl chloride (1.5 mg/ml in acetonitrile). The mixture was incu-bated in the dark for 35 min at 25°C, and the reaction was stopped with 10 l of 2% ethylamine.
We used a Bio-SiL C18 HL column (5m, 150 ⫻ 4.6 mm; Bio-Rad Laboratories, Nazareth-Eke, Belgium) heated at 50°C. After injection of the dansylated solution (20l), GABA was eluted by means of a linear gradient at a flow rate of 1.5 ml/min. The column was equilibrated in 85% solvent A (3% tetrahydrofuran, 0.57% acetic acid, 0.088% triethyl-amine in water) and 15% solvent B (3% tetrahydrofuran, 0.57% acetic acid, 0.088% triethylamine, 70% methanol in water). After injection, the percentage of solvent B was increased linearly to reach 100% after 40 min. Initial conditions were restored within 2 min, and the next sample was injected after a reequilibration period of 5 min. A fluorescent spectrom-eter (LS-4, Perkin-Elmer, Norwalk, CT) was used with the wavelengths set at 334 nm for excitation and 522 nm for emission. A reference stan-dard, composed of a GABA solution (0.1 mM) in water, was dansylated
simultaneously with samples.
Calcium imaging. PSA-NCAM⫹cells were loaded with the calcium indicator dye fluo-3 AM (6M) (Molecular Probes) by bath application
for 30 min at 37°C. Fluo-3 AM is a non-ratiometric indicator dye that triggers an increase of cell fluorescence intensity when the intracellular calcium concentration increases. After fluo-3 loading, cells were washed three times in Locke solution containing (in mM): 154 NaCl, 5.6 KCl, 5.6
glucose 5.6, 2.3 CaCl2䡠2H2O, 10.0 HEPES, pH 7.2. Calcium responses
were recorded as digitized images acquired with a Bio-Rad MRC 1000 laser scanning confocal system coupled to a Zeiss Axiovert 135
micro-scope with a plan-NEOFLUAR objective (40⫻, 1.3 numerical aperture, oil immersion). The Time Course Software Module program (Bio-Rad) was used to control the confocal microscope to acquire a series of images at intervals from 2 to 5 sec. The different reagents diluted in Locke solu-tion were applied by a microperfusion system (SPS-8, List-Medical). The series of digitized fluorescence images were analyzed by a program that determined the average level of fluorescence above the background level of each cell for every time point sampled. The recorded areas were delim-ited by placing rectangular boxes around every cell in a field. A “back-ground” box was also defined in a noncellular area of each scanned image. The averaged intensity of the pixels within a boxed cellular region was calculated by the program, and the averaged intensity of the pixels within the “background” box defined for the image was subtracted from this value. To compensate for variable dye loading between cells, these background-corrected values were normalized by conversion to percent-age changes relative to a baseline measurement for each boxed cellular region at the start of a time series (Ft/F0).
Organotypic slice cultures. We used a technique adapted from Yuan et al. (1998). Briefly, whole brains were dissected from P1 Sprague Dawley rats and placed in oxygenated (carbogen, 95% O2/5% CO2) artificial CSF
containing (in mM): 120 NaCl, 25 NaHCO3, 3.3 KCl, 1.2 NaH2PO4, 1.8
CaCl2, 2.4 MgSO4, 10 glucose, pH 7.2. Brains were then sliced coronally
(400m) using a vibratome. The SVZ and striatum (as depicted in Fig. 10 A1) were separately microdissected to allow a distinct assessment of SVZ and striatal cells. SVZ and striatal slices were placed into sterile Millicell (Millipore, Bedford, MA) in six-well plates (Falcon) containing 1 ml of EGF-free medium (as described previously). Treatments with drugs began 4 hr after the slicing procedure. The medium was replaced by EGF-free medium containing simultaneously BrdU (20M; Sigma) and drugs for 18 hr. Cell viability was assessed in each experiment at the end of the BrdU incorporation time frame by using a LIVE/DEAD viability/ cytotoxicity kit (L-3224, Molecular Probes). Slices were then gently me-chanically dissociated, and cells were plated for 1 hr on poly-ornithine-coated coverslips before fixation and immunocytochemical analysis.
Drugs. GABA, muscimol, bicuculline, picrotoxin, pentobarbital, ba-clofen, saba-clofen, SR-95531, U0126, and nifedipine were obtained from Sigma-Aldrich, and clonazepam was purchased from Roche Diagnostics Belgium (Brussels, Belgium).
Data analysis. For electrophysiological recordings, n represented the number of recorded cells. Peak currents in the different experimental conditions were measured and subsequently normalized to the initial response (100%) in control conditions. Agonist concentration–response profiles were fitted to the following equation: I/Imax⫽ 1/(1⫹(EC50
/[ago-nist])nh), where I and I
max, respectively, represent the normalized
agonist-induced current at a given concentration and the maximum cur-rent induced by a saturating concentration of the agonist. EC50is the
half-maximal effective agonist concentration, and nh is the Hill slope. The concentration–response of modulations was fitted by a similar pro-cedure, except for clonazepam, where a polynomial curve was used.
The quantitative results of [3H]thymidine incorporation assays and
immunocytochemical experiments were expressed as mean⫾ SEM val-ues arising from a minimum of three independent experiments (n).
For all experiments, a statistical analysis was performed either using unpaired two-tailed Student’s t test between control and experimental conditions or using a one-way ANOVA (ANOVA-1) followed by a Dun-nett’s post-test for multiple comparisons (GraphPad Prism software, version 2.04 a, San Diego, CA). The level of significance was expressed as follows: *p⬍ 0.05, **p ⬍ 0.01, and ***p ⬍ 0.0001.
Results
Purification and characterization of PSA-NCAM
ⴙprogenitors acutely isolated from newborn rat striata
To obtain a highly enriched population of PSA-NCAM
⫹progen-itors, newborn rat (P0 –P3) striata were first dissociated as
de-scribed previously for neural stem cell cultures (Reynolds and
Weiss, 1992). The cell suspension was then layered on top of a
buoyant density Percoll gradient and further ultracentrifuged
(Fig. 1 A). This isopycnic centrifugation allowed cells to sediment
in an equilibrium position equivalent to their own natural
buoy-ant density. We demonstrated that viable, small (7
⫾ 1
m in
diameter), round cells were separated from more differentiated
cells and cell debris by collecting the interphase located in the
range of densities between 1.052 and 1.102 gm/ml (Fig. 1 B). The
final cell suspension harvested according to these density criteria
was resuspended in EGF-containing medium.
To validate our protocol of purification, we assessed
PSA-NCAM
⫹cells before and after the Percoll centrifugation. The
isopycnic centrifugation of cell suspension in a buoyant density
gradient allowed us to increase the percentage of PSA-NCAM
⫹cells from 62.5
⫾ 15.1% (n ⫽ 3) to 94 ⫾ 1.0% of total cells (n ⫽
6) (Fig. 1C–E). After purification by the Percoll centrifugation
step, the phenotype of PSA-NCAM
⫹cell suspension was
charac-terized more extensively. Nestin was observed in 74.9
⫾ 8.3%
(n
⫽ 4) of total cells, and all nestin
⫹cells also expressed
PSA-NCAM (Fig. 1 E). We observed that 47.6
⫾ 4.5% of total cells
(n
⫽ 2) were A2B5
⫹(Fig. 1 E). Neuronal phenotypes were
inves-tigated by studying the expression of neuron-specific antigens.
We found that 74.6
⫾ 1.4% (n ⫽ 4) of total acutely purified cells
expressed
III-tubulin (i.e., Tuj1
⫹) (Fig. 1 E, F ), 4.5
⫾ 2.6% (n ⫽
2) expressed type 2a,b microtubule-associated protein (i.e.,
MAP2ab
⫹) (Fig. 1 E, G), and 2.6
⫾ 1.6% (n ⫽ 2) were
neurofila-ment 145 kDa-positive (i.e., NF-M
⫹) (Fig. 1 E, H ). Importantly,
we never found cells that were immunoreactive for
synaptophy-sin, which is a marker of synapse formation (Fig. 1 E). Finally, we
found a low expression of oligodendrocyte (O4) or astrocyte
(GFAP) specific markers. Respectively, 2.8
⫾ 1.2% (n ⫽ 4) of
total cells were O4
⫹and 4.4
⫾ 0.8% of total cells (n ⫽ 4) were
GFAP
⫹(Fig. 1 E). These results provide evidence that purified
PSA-NCAM
⫹cells from early postnatal rat striatum mostly show
antigenic features of neuron-committed progenitor cells.
Purified proliferative PSA-NCAM
ⴙcells form spheres that
preferentially generate neurons
After 3 d in vitro (DIV) in EGF-containing medium,
PSA-NCAM
⫹progenitor cells proliferated and formed spheres with a
mean diameter of 61.8
⫾ 7.3
M(n
⫽ 4) (Fig. 1I). A vast majority
of cells within 3-DIV-old spheres remained PSA-NCAM
⫹(89.6
⫾ 4.7% of total cells; n ⫽ 6), and Tuj1
⫹(57.3
⫾ 1.2% of
total cells; n
⫽ 4) (Fig. 1J,M). Interestingly, we observed that all
Tuj1
⫹cells were still PSA-NCAM
⫹in 3-DIV spheres (data not
shown). To quantify cell proliferation within PSA-NCAM
⫹spheres, we performed a BrdU incorporation assay (18 hr) at 3
DIV. The BrdU incorporation index (BrdU
⫹cells per total cells)
was 17.2
⫾ 4.0% in the presence of EGF (20 ng/ml) (n ⫽ 2) (Fig.
1 K, L). By double immunostaining, we observed that
proliferat-ing cells were mostly PSA-NCAM
⫹because 16.0
⫾ 4.1% of total
cells (n
⫽ 3) were immunoreactive for both PSA-NCAM and
BrdU (Fig. 1 K, L, left panel). The other way around, we showed
that 92.9
⫾ 4.1% of the total BrdU
⫹cells were PSA-NCAM
⫹(Fig. 1 L, right panel). Conversely, cells expressing markers of
lineage commitment were weakly involved in the overall BrdU
incorporation index because only 3% of Tuj1
⫹cells, 1% of O4
⫹cells, and 2% of GFAP
⫹cells were also BrdU
⫹(Fig. 1 L, left
panel). Interestingly, cultured PSA-NCAM
⫹cells generated
pre-dominantly neuron-committed cells after 3 DIV in
EGF-containing medium (Fig. 1 E, M–O). As compared with acutely
purified cells, we observed a fourfold and a fivefold increase,
respectively, of the relative percentages of MAP2ab
⫹and
NF-M
⫹cells in 3-DIV spheres, whereas no change was observed
for O4
⫹or GFAP
⫹cells. Furthermore, with respect to the
calcu-lated 1.8-fold increase of the total cell number during the 3-DIV
growth of PSA-NCAM
⫹spheres (data not
shown), the absolute number of cells
ex-pressing
mature
neuronal
antigens
MAP2ab and NF-M were increased by
seven- and eightfold, respectively (Figs.
1 N, O).
PSA-NCAM
ⴙspheres express type A
GABA receptors
Given that previous works reported the
ex-pression of GABA
AR in early postnatal
neuronal progenitor cells, notably in the
anterior subventricular zone, we sought to
investigate the presence of these receptors
in striatal PSA-NCAM
⫹neuronal
precur-sors (Stewart et al., 2002). To characterize
GABA
AR subunit transcripts expressed in
PSA-NCAM
⫹progenitors, total RNAs
ex-tracted from 3-DIV spheres were reverse
transcribed, and the subsequent cDNAs
were amplified by PCR using specific sets
of primers aimed at detecting transcripts
for
␣
1–5,

1–3,
␥
1–3, and
␦GABA
AR subunit
genes (Table 1). Experiments were
repli-cated three times and consistently yielded
bands with the appropriate amplicon size
for
␣
2(549 bp),
␣
4(532 bp),
␣
5(300 bp),

1(578 bp),

3(587 bp),
␥
1(296 bp),
␥
2(423 bp), and
␥
3(336 bp) transcripts,
re-spectively (Fig. 2 A, B). RNAs isolated from
total adult rat brains were used as positive
control.
The expression of GABA
AR subunit
proteins was analyzed by
immunocyto-chemistry in PSA-NCAM
⫹spheres. We
used three polyclonal antibodies directed
against
␣
1–3,5,

1–3, and
␥
1– 4subunits,
re-spectively, of GABA
AR. As illustrated in
Figure 2C–E, 70.6
⫾ 13.8% of total cells
(counted after mechanical dissociation of
spheres)
were
immunoreactive
for
GABA
AR
␣ subunit proteins (i.e., ␣
1–3,5;
n
⫽ 2) (Fig. 2C), 65.6 ⫾ 4.3% of total cells
were immunoreactive for GABA
AR

sub-units (i.e.,

1–3; n
⫽ 2) (Fig. 2D), and
66.6
⫾ 6.2% of total cells expressed
GABA
AR
␥ subunits (i.e., ␥
1– 4; n
⫽ 3) (Fig.
2 E).
GABA triggers whole-cell currents in
PSA-NCAM
ⴙspheres by GABA
Areceptor activation
We wanted to ascertain by
electrophysio-logical recordings whether PSA-NCAM
⫹cells expressed functional GABA
Arecep-tors. We therefore recorded cells within
PSA-NCAM
⫹spheres using the
whole-cell patch-clamp technique. Occasionally,
the Lucifer yellow fluorescent dye was
added to the intracellular solution and
al-lowed to diffuse in the recorded cell for
post hoc immunostainings. All recorded
cells filled with Lucifer yellow were
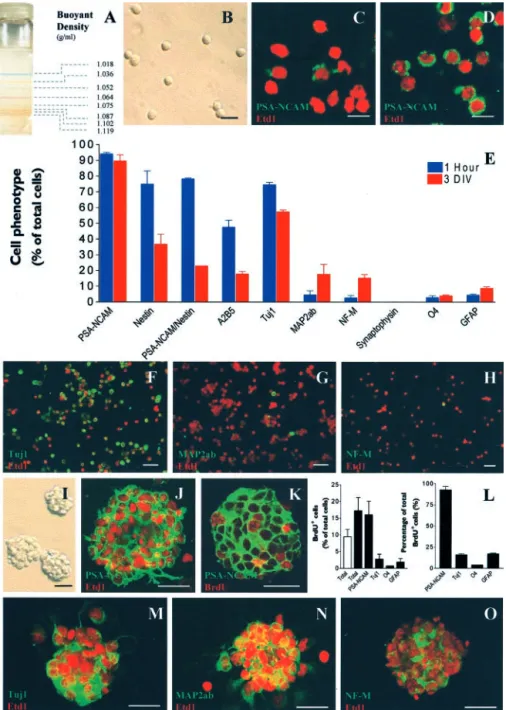
PSA-Figure 1. Purification and in vitro amplification of proliferative and neurogenic PSA-NCAM⫹progenitors from early postnatal
striatum. A, Bands of color-coded density marker beads in ultracentrifuged Percoll gradient. According to their isopycnic buoyant densities, living PSA-NCAM⫹cells ( B) were separated from differentiated neural cells and cell debris in a continuous Percoll
gradient.Cellswerecollectedintheinterphaselocatedbetweentherangesofdensity:1052–1102gm/mlasdeterminedbyatube containing control density beads that was ultracentrifuged simultaneously. C, D, Confocal images of acutely dissociated cell suspensionfromnewbornratstriatumbefore( C )andafter( D)selectionbycentrifugationinaPercolldensitygradient.Cellswere immunostained for PSA-NCAM (green) and counterstained with the nuclear dye Etd1 (red). Cells acutely purified from early postnatal striatum (1 hr) or dissociated from 3-DIV-old spheres were allowed to adhere onto poly-ornithine-coated coverslips and were assessed by immunostaining. E, Histogram comparing the percentage of total cells expressing various markers 1 hr after purification (blue bars) and after 3 d of growth in vitro in EGF-containing medium (red bars). F–H, Confocal images of represen-tative fields showing acutely purified cells immunostained for markers of neuronal commitment: F, Tuj1 (green); G, MAP2ab (green); H, NF-M (green), and F–H, counterstaining with Etd1 (red). Purified cells cultured in EGF-containing medium for 3 d in uncoated conditions formed spheres ( I ) that were composed almost exclusively of PSA-NCAM⫹cells. J, PSA-NCAM in green and
Etd1 in red. K, Confocal optical section of a 3-DIV sphere immunostained for BrdU after 18 hr of BrdU incorporation assay in EGF-containing medium (PSA-NCAM in green and BrdU in red). L, Histograms representing the percentage of total cells that incorporated BrdU (20M) for each immunophenotype (left panel) and the percentage of total BrdU⫹cells that expressed a
given immunophenotype (right panel), respectively, in the presence (black bars) or absence (open bar) of EGF (20 ng/ml). M–O, Confocalopticalsectionof3-DIVspheresexpressingmarkersofneuroncommitment:M,Tuj1(green);N,MAP2ab(green);O,NF-M (green) and counterstaining with Etd1 (red). Scale bars: B–D, 10m; F–K, 25 m; M–O, 20 m.
NCAM
⫹in 3-DIV spheres (Fig. 3A). We selectively assessed cells
that were located at the accessible periphery of the spheres. The
mean membrane potential recorded in current-clamp
configura-tion was
⫺52.9 ⫾ 1.9 mV (n ⫽ 110 cells). All recordings were
performed in the presence of 1
Mstrychnine to avoid
cross-activation of ionotropic glycine receptors. In voltage-clamp
mode (the holding potential was kept at
⫺70 mV), bath
applica-tion of 1 m
MGABA, a concentration that saturates GABA
ARs
(Fig. 3C), elicited inward currents in 94.6% of total cells with a
peak current displaying a mean maximum amplitude of 408.9
⫾
46.8 pA (n
⫽ 53 cells) (Fig. 3B).
In GABA-responsive PSA-NCAM
⫹progenitors, the EC
50value (i.e., the concentration that yielded an inward current of
half-maximum amplitude) calculated from the sigmoidal
con-centration–response curve was 6.2
⫾ 1.1
M, with a Hill
coeffi-cient (n
h) of 0.7
⫾ 0.2 (n ⫽ 11 cells) (Fig. 3C,D). To confirm that
GABA-elicited currents were caused specifically by the
activation of GABA
ARs, we showed that the specific GABA
AR
ago-nist muscimol also induced inward currents in PSA-NCAM
⫹cells
(Fig. 3F ). For muscimol-induced currents, the concentration–
response curve, fitted by the Hill equation, yielded an EC
50of 6.5
⫾
1.1
M, with a Hill coefficient (n
h) of 0.5
⫾ 0.2 (n ⫽ 5 cells) (Fig.
3E,F).
The current–voltage relationship of GABA-evoked currents
was obtained by applying voltage steps ranging from
⫺140 to
⫹100 mV during GABA application. As shown in Figure 3, G and
I, the resulting current–voltage curve could be fitted by the
Goldman-Hodgkin-Katz relation (see Materials and Methods)
and reversed at
⫹5.9 mV (n ⫽ 4 cells), which is close to the
calculated Nernst chloride equilibrium potential (
⫺1.1 mV).
When 108 m
Mof extracellular sodium
chloride was replaced by sodium
glu-conate, the reversal potential shifted to a
more positive value (⫹27.9 mV; n ⫽ 5
cells) (Fig. 3 H, J ), consistent with the
pre-dicted shift of the calculated Nernst
chlo-ride equilibrium potential (
⫹29.0 mV).
Pharmacological characterization of
functional GABA
ARs expressed in
striata-derived PSA-NCAM
ⴙprogenitors
In 3-DIV PSA-NCAM
⫹cells,
GABA-induced currents were completely and
re-versibly inhibited in a dose-dependent
manner by the competitive antagonists
bicuculline (IC
50⫽ 1.54 ⫾ 1.12
M; n
⫽ 5
cells) (Fig. 4 A, B) and SR95531 (IC
50⫽
0.15
⫾ 0.01
M; n
⫽ 6 cells) (Fig. 4C,D)
and by the noncompetitive antagonist
pi-crotoxin (IC
50⫽ 4.5 ⫾ 1.1
M; n
⫽ 7 cells)
(Fig. 4 E, F ). We also assessed the effect of
benzodiazepines and barbiturates, which
are positive allosteric modulators of
GABA
AR. The effects of clonazepam and
pentobarbital were studied on currents
elicited by a low concentration of GABA (1
M⫽ EC
10⫽ GABA concentration
induc-ing an inward current correspondinduc-ing to
10% of the maximum GABA-evoked
cur-rent) to sensitize the detection of a
en-hancing effect. Our results showed that
clonazepam potentiated GABA currents at
concentrations ranging from 10 n
Mto 100
M, with a maximum
effect at 1
M(212% of I
GABAat EC
10) (Fig. 4G,H ). Pentobarbital
triggered a maximal 5.6-fold increase of the amplitude of
GABA-evoked currents in a concentration-dependent manner (EC
50⫽
2.1
⫾ 0.3
M; n
⫽ 11 cells) (Fig. 5I,J).
GABA
AR activation inhibits the proliferation of
PSA-NCAM
ⴙprogenitors
Because the activation of ionotropic GABA
AR has been reported
to affect the proliferation of neural progenitors in the ventricular
and subventricular zones of the embryonic neocortex (LoTurco
et al., 1995; Haydar et al., 2000), we decided to analyze the effect
of GABA on proliferation kinetics in striatal early postnatal
PSA-NCAM
⫹progenitor cells. After 48 hr of growth in
EGF-containing medium, spheres were transferred to the same
me-dium but devoid of EGF for the next 24 hr. This procedure
allowed us to obtain a synchronization of most cells in G
0(Jones
and Kazlauskas, 2001) before starting BrdU or [
3H]thymidine
incorporation assays (18 hr). The removal of EGF from the
me-dium did not affect the phenotype of cells within these 3-DIV
spheres (data not shown).
To compare the proliferation rates of the different cell
pheno-types present within 3-DIV spheres, cells were colabeled for BrdU
and lineage markers (i.e., PSA-NCAM, Tuj1, O4, and GFAP)
(Fig. 5C, F, I ). Cytosine arabinoside (10
M) was used as an
inter-nal control inhibiting proliferation in all phenotypes. Although
agonists and antagonists of GABA
AR did not modify the
percent-ages of O4
⫹/BrdU
⫹and GFAP
⫹/BrdU
⫹cells (data not shown),
treatment with GABA
AR agonists (GABA at 100
Mand
musci-Table 1. Sequences of primers (forward, reverse) used for PCR
cDNA Primer Size of product(base pairs) Sources GABAAR␣1 For 5⬘-CAT TCT GAG CAC TCT CTC GGG AAG-3⬘
Rev 5⬘-GTG ATA CGC AGG AGT TTA TTG GGC-3⬘ 396 (Khrestchatisky et al., 1989) GABAAR␣2 For 5⬘-AGG TTG GTG CTG GCT AAC ATCC-3⬘
Rev 5⬘-AAC AGA GTC AGA AGC ATT GTA AGT CC-3⬘ 549 (Khrestchatisky et al., 1991) GABAAR␣3 For 5⬘-CAA CAT AGT GGG AAC ACC TAT CC-3⬘
Rev 5⬘-GGG AGC TCT GGG GTT TGG GAT TT-3⬘ 350 (Criswell et al., 1997) GABAAR␣4 For 5⬘-CAA AAC CTC CTC CAG AAG TTC CA-3⬘
Rev 5⬘-ATG TTA AAT AAT GCC CCA AAT GTG ACT-3⬘ 532 (Wisden et al., 1991) GABAAR␣5 For 5⬘-TGA CCA AAA CCC TCC TTG TCT TCT-3⬘
Rev 5⬘-ACC GCA GCC TTT CAT CTT TCC-3⬘ 300 (Khrestchatisky et al., 1989) GABAAR1 For 5⬘-GTT TGG GGC TTC TCT CTC TTT TCC T-3⬘
Rev 5⬘-AGT TAC TGC TCC CTC TCC TCC ATT-3⬘ 578 (Ymer et al., 1989a) GABAAR2 For 5⬘-CAG GTT CTT ATC CCA GAT TGT CCC-3⬘
Rev 5⬘-GGT CCA TCT TGT TGA CAT CCA GG-3⬘ 408 (Ymer et al., 1989b) GABAAR3 For 5⬘-CTT TTC GGC ATC TTC TCG GC-3⬘
Rev 5⬘-TCC ACG CCA GTA ACA GCC TTG-3⬘ 587 (Ymer et al., 1989b) GABAAR␥1 For 5⬘-TAG TAA CAA TAA AGG AAA AAC CAC CAG A-3⬘
Rev 5⬘-CCA GAT TGA ACA AGG CAA AAG CT-3⬘ 296 (Ymer et al., 1990) GABAAR␥2 For 5⬘-TGG TGA CTA TGT GGT TAT TGC CGT G-3⬘
Rev 5⬘-AGG TGG GTG GCA TTG TTC ATT T-3⬘ 423 (Khrestchatisky et al., 1989) GABAAR␥3 For 5⬘-GAA ATC ATG GCG GCT CTA GTT-3⬘
Rev 5⬘-CTC CAT CAG TGC GGC AAA GAC AAA-3⬘ 336 (Stewart et al., 2002) GABAAR␦ For 5⬘-GAC TAC GTG GGC TCC AAC CTG GA-3⬘
Rev 5⬘-ACT GTG GAG GTG ATG CGG ATG CT-3⬘ 398 (Zhao and Joho, 1990) GAD 65 For 5⬘-CCA TTA CCC CAA TGA GCT TCT-3⬘
Rev 5⬘-CCC CAA GCA GCA TCC ACG T-3⬘ 698 (Dkhissi et al., 2001) GAD 67 For 5⬘-AAT TGC ACC CGT GTT TGT TCT TAT G-3⬘
Rev 5⬘-AGC GCA GCC CCA GCC TTC TTT A-3⬘ 252 (Stewart et al., 2002)
mol at 100
M), but not with GABA
BR
ag-onist (baclofen 100
M), significantly
re-duced the percentage of PSA-NCAM
⫹cells that incorporated BrdU (Fig. 5A) at
both the Tuj1
⫺(Fig. 5G) and Tuj1
⫹(Fig.
5D) stages. The addition of SR-95531 (10
M) totally abolished the muscimol (100
M)-induced decrease of proliferation in
PSA-NCAM
⫹cells (Fig. 5A) at Tuj1
⫺(Fig. 5G) and Tuj1
⫹stages (Fig. 5D).
EGF (20 ng/ml) increased the
prolifera-tion of PSA-NCAM
⫹cells (Fig. 5B) similarly
at Tuj1
⫺(Fig. 5H) and Tuj1
⫹stages (Fig.
5E) (n
⫽ 4; Student’s t test; **p ⬍ 0.01,
***p
⬍ 0.0001) but had no effect on O4
⫹and GFAP
⫹cells (data not shown).
Interest-ingly, muscimol (100
M) inhibited
EGF-induced increase of proliferation (n
⫽4;Stu-dent’s t test; *p
⬍ 0.05) in PSA-NCAM
⫹cells (Fig. 5B) at the Tuj1
⫹stage only (Fig.
5E,H), whereas addition of SR-95531 (10
M) totally abolished the effect of muscimol
(Fig. 5B,E). This discrepancy may reflect
de-velopmental differences of GABA
AR
expres-sion and/or function between potentially
more immature Tuj1
⫺/PSA-NCAM
⫹pre-cursors and their Tuj1
⫹/PSA-NCAM
⫹neu-roblastic progeny.
The influence of GABA
AR modulators
assessed by BrdU incorporation was also
analyzed on the whole-cell population
us-ing the [
3H]thymidine incorporation
as-say with similar results (data not shown,
but see Fig. 8).
EGF-controlled GABA-mediated autocrine/paracrine
inhibition of proliferation in cultured PSA-NCAM
ⴙcells and
Tuj1
ⴙneuron-committed precursor cells from early
postnatal striatum
To investigate whether PSA-NCAM
⫹progenitors were able to
synthesize GABA, we performed RT-PCR experiments with
spe-cific primers to detect the enzymes required for GABA synthesis
by decarboxylation of glutamate,: i.e., the 65 kDa (GAD 65) and
67 kDa (GAD 67) glutamate decarboxylases (Table 1). During
brain development, alternative splicing produces three transcript
isoforms for the GAD 67 but not the GAD 65 gene (Szabo et al.,
1994). With RNAs extracted both from 3-DIV PSA-NCAM
⫹spheres and from control adult total brain, we detected an
appro-priate 698 bp band by using a specific set of primers for GAD 65
(Fig. 6 A). For GAD 67 RT-PCR, we used a set of primers aimed at
amplifying cDNAs for the three alternatively spliced isoforms.
However, we detected only a 252 bp band corresponding to the
full-length functional isoform of GAD 67 with RNAs extracted
both from PSA-NCAM
⫹spheres and control adult total brain
(Fig. 6 A). We next sought for the presence of GABAergic cells
among PSA-NCAM
⫹progenitors by immunocytochemical
stainings using antibodies directed against GABA, GAD 65, and
GAD 67. We found that GAD 65
⫹cells represented 48.9
⫾ 5.2%
(n
⫽ 2) (Fig. 6B) of total cells from 3-DIV PSA-NCAM
⫹spheres,
whereas 61.5
⫾ 4.1% (n ⫽ 3) (Fig. 6C) of the progenitors
ex-pressed GAD 67. GABA
⫹cells represented 19.3
⫾ 9.8% (n ⫽ 3)
(Fig. 6 D) of total cells.
Given this demonstration of GABA synthesis in striatal
PSA-NCAM
⫹cells, we next investigated whether these cells were able
to actively secrete GABA, which in turn could regulate their
pro-liferation level by an autocrine or paracrine activation of
GABA
AR. To test this hypothesis of an endogenous activation of
GABA
AR within PSA-NCAM
⫹spheres, we studied the effects on
proliferation of antagonists (SR-95531 at 10
M, picrotoxin at 5
M, and bicuculline at 100
M) and positive allosteric
modula-tors (clonazepam at 1
Mand pentobarbital at 10
M) of
GABA
AR in the absence of exogenously added GABA in our
pro-liferation assay. In the absence of EGF, GABA
AR antagonists
trig-gered an increase (n
⫽ 3; ANOVA-1 followed by a Dunnett’s
post-test; *p
⬍ 0.05, **p ⬍ 0.01), whereas positive allosteric
mod-ulators induced a decrease (n
⫽ 3; not significant) of proliferation
in total PSA-NCAM
⫹and Tuj1
⫹/PSA-NCAM
⫹cells (Fig.
6 E, F ). The lower level of increase of BrdU labeling in total
PSA-NCAM
⫹cells in comparison with the Tuj1
⫹subpopulation in
the presence of GABA
AR antagonists underlies the fact that
Tuj1
⫺/PSA-NCAM
⫹cells were less sensitive to this
pharmaco-logical effect (data not shown). Our data suggest the existence of
an endogenous GABA-dependent inhibition of proliferation in
PSA-NCAM
⫹spheres.
Furthermore, in the presence of EGF (20 ng/ml), the GABA
antagonist SR-95531 (10
M) did not increase the proliferation of
total PSA-NCAM
⫹and Tuj1
⫹/PSA-NCAM
⫹cells (Fig. 6G,H ).
Therefore, using the HPLC technique, we measured the GABA
contents in spheres synchronized for 24 hr and subsequently
grown for 18 hr in DMEM/F12/N2/B27 with or without EGF (20
ng/ml). We found that EGF-treated spheres contained a lower
amount of GABA when compared with untreated cultures (n
⫽
3; Student’s t test; *p
⬍ 0.05) (Fig. 6I). These results emphasize
Figure 2. GABAAreceptors are expressed by PSA-NCAM⫹progenitors from early postnatal striatum. A, B, RT-PCR
amplifica-tion of GABAAR␣1–5,1–3,␥1–3, and␦ subunit transcripts using RNA extracted from 3-DIV PSA-NCAM⫹spheres ( A) and adult
rat brain tissue ( B). Bands corresponding to␣2(549 bp),␣4(532 bp),␣5(300 bp),1(578 bp),3(587 bp),␥1(296 bp), and␥3
(336bp)weredetected(⫹,withRT;⫺,withoutRT).LeftmarginsindicatemigrationofstandardDNAmarkerswithsizeindicated in base pairs. C, Z-series confocal image of 3-DIV PSA-NCAM⫹cells immunoreactive for GABA
AR␣subunits(green).D,E,Confocal
images of 3-DIV PSA-NCAM⫹spheres showing GABA
AR⫹cells (D, green), and GABAAR␥⫹cells (E, green), respectively. All
Figure3. GABAAreceptoractivationtriggerschloride-mediatedinwardcurrentsinPSA-NCAM⫹progenitorcells.A,ConfocalimageshowingaGABA-responsivecellinjectedwithLuciferyellow(green)and
expressingPSA-NCAM(red).B,HistogramrepresentingthemeanmaximumcurrentinducedbyGABA1mMandthepercentageofrespondingcellsinthetotalrecordedpopulationof3DIVPSA-NCAM⫹cells,
respectively. C, Concentration–response curve obtained from GABA-responsive PSA-NCAM⫹progenitors. E, The specific GABA
AR agonist muscimol also induced concentration-dependent currents in
PSA-NCAM⫹cells. D, F, Traces illustrating inward currents elicited by different concentrations of GABA (D) and muscimol (D). G–J, Reversal potential of GABA-induced currents (E
GABA). I, J, Current–voltage
relationshipofGABA-evokedcurrentswasstudiedbyapplyingvoltagestepsrangingfrom⫺140to⫹100mVrepetitivelyevery5secbefore,during,andafterGABA(100M)application.Meancontrolcurrents
(before and after GABA application) were subtracted from the currents recorded at the peak of the GABA response. G–I, Using the currents obtained in I, we constructed a current–voltage curve reversing at ⫹5.89 mV (n ⫽ 4 cells), which is close to the calculated Nernst chloride equilibrium potential (⫺1.1 mV) (left panel). H–J, When extracellular chloride concentration was lowered (J), the reversal potential shifted to⫹30.63mV(n⫽5cells),whichagainisclosetotheexpectedchlorideequilibriumpotentialinthiscondition(⫹29.00mV).
that GABA production in PSA-NCAM
⫹cells may be controlled by EGF signaling.
GABA
AR activation does not interfere
with the survival of PSA-NCAM
ⴙcells
We performed TUNEL bioassays to
ascer-tain that GABA
AR agonists, antagonists,
and positive allosteric modulators did
not modify the percentage of
BrdU-incorporating PSA-NCAM
⫹cells by
in-terfering with apoptotic cell death. As
shown in Figure 7A, GABA
AR agonist
(muscimol 100
M), antagonist
(SR-95531 10
M), or positive allosteric
mod-ulators (pentobarbital and clonazepam)
did not influence the apoptotic events in
PSA-NCAM
⫹cells. Roscovitine at a high
concentration (40
M) (Ljungman and
Paulsen, 2001) was used as positive control
(n
⫽ 3; ANOVA-1 followed by a Dunnett’s
post-test; **p
⬍ 0.01) (Fig. 7A,B).
Intracellular signaling pathways
mediating the effects of GABA
AR
activation on cell cycle progression in
PSA-NCAM
ⴙprogenitors
Because the mitogen-activated protein
ki-nase (MAPK) signaling pathway has been
shown to be involved in the regulation of
cell cycle progression in neuronal
progen-itor cells (Li et al., 2001), we studied the
effect of a chemical inhibition of this
cas-cade on GABA
AR-mediated modulation
of PSA-NCAM
⫹cell proliferation. We
used U0126, a specific inhibitor of the
mitogen-activated kinase kinases MEK1
and MEK2 (Duncia et al., 1998). U0126
(10
M) had no effect on basal
prolifera-tion or on muscimol-induced arrest of
proliferation (Fig. 8). Conversely, we
found that U0126 totally abolished the
in-crease of proliferation induced by
SR-95531 or EGF (n
⫽ 5; Student’s t test; *p ⬍
0.05, **p
⬍ 0.01) (Fig. 8).
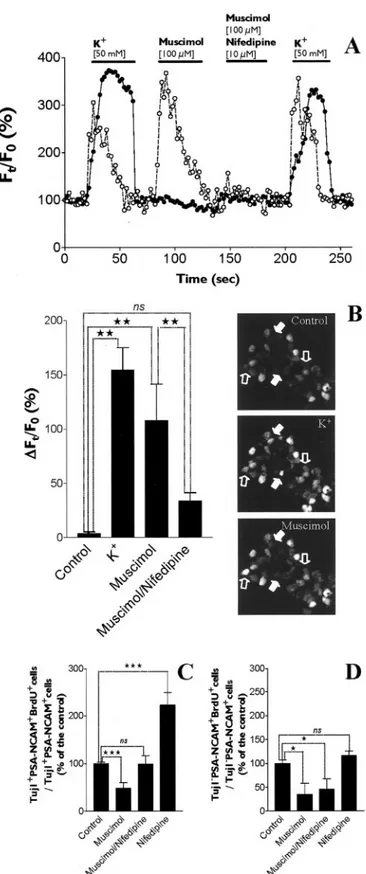
As described (Belachew et al., 2000), to
assess GABA-induced calcium responses,
PSA-NCAM
⫹cells have been imaged
us-ing confocal microscopy and the calcium
indicator dye fluo-3 in Locke standard
ex-tracellular solution. In such conditions, we
first tested the presence of voltage-gated
calcium channels (VGCCs) in
PSA-NCAM
⫹cells by studying the effects of
depolarization. The application of a
depo-larizing solution containing a high K
⫹concentration (50 m
M) resulted in a
pro-longed rise of intracellular calcium
con-centration ([Ca
2⫹]
i) in 28.3% of the cells
(28 of 99 cells tested) (Fig. 9 A, B). A cell
was considered to be a responding cell if it
displayed a sustained increase of its
fluo-rescence intensity that was significantly (at
least 20%) above the average baseline
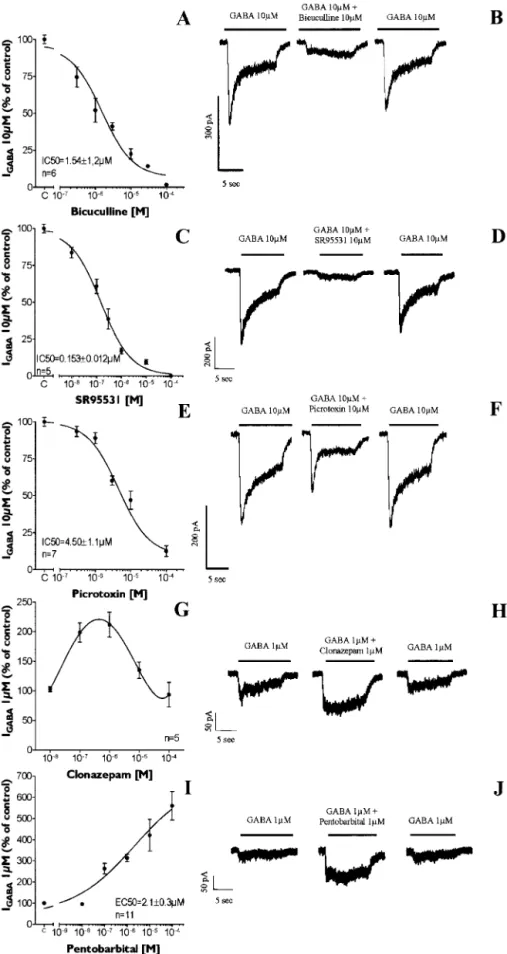
flu-Figure 4. Pharmacological characterization of GABAAR expressed by PSA-NCAM⫹progenitors. A–F, GABA was applied at 10
M(IGABA10M),aconcentrationclosetoitsEC50.GABA-evokedcurrentswerereversiblyinhibitedbybicuculline(A,B),SR-95531
(C,D),andpicrotoxin(E,F ).G–J,WealsotestedpositiveallostericmodulatorsofGABAAR.ClonazepampotentiatedGABA-induced
currents (GABA at 1M, EC10) in a range of concentrations between 10 nMand 100M, with a maximal effect at 1M(G, H ). I–J,
orescence. A muscimol-evoked [Ca
2⫹]
iincrease was observed in
20.2% of PSA-NCAM
⫹cells (20 of 99 cells tested), and all
muscimol-responsive cells exhibited intracellular calcium
re-sponses to depolarization induced by high extracellular K
⫹(Fig.
9 A, B). Muscimol-induced calcium responses in PSA-NCAM
⫹cells were consistently inhibited by the VGCC blocker nifedipine
(10
M; n
⫽ 20 cells) (Fig. 9A,B). These data suggest that GABA
interferes with [Ca
2⫹]
ihomeostasis in a subpopulation (20%) of
postnatal PSA-NCAM
⫹cells from striatum by inducing a
suffi-cient depolarization to open VGCCs.
We have also investigated the effect of the VGCC blocker
nifed-ipine on GABA
AR-mediated regulation of
cell cycle progression in PSA-NCAM
⫹cells.
Therefore, we provided evidence that a
GABA
AR-mediated increase of [Ca
2⫹]
iin
striatal PSA-NCAM
⫹cells was involved in
GABA
AR-mediated inhibition of
prolifera-tion in neuron-committed Tuj1
⫹/PSA-NCAM
⫹progenitor cells but not in Tuj1
⫺/
PSA-NCAM
⫹cells (Fig. 9C,D).
GABA
AR is expressed in PSA-NCAM
ⴙcells in situ and autocrine/paracrine
GABA
AR activation regulates
proliferation of postnatal striatal
PSA-NCAM
ⴙcells in organotypic slices
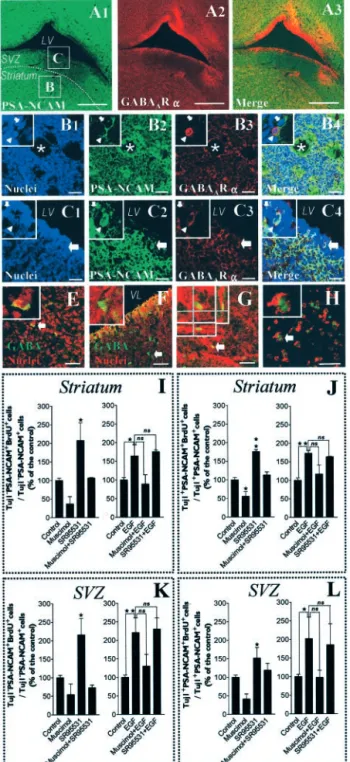
We performed immunostaining in
coro-nal frozen tissue sections (30
m) from
postnatal (P1) rat brains. We were able to
demonstrate that PSA-NCAM
⫹cells from
striatum as well as from the adjacent SVZ
were immunoreactive for GABA
AR
␣
sub-units (Fig. 10 A–C). GABA- expressing
cells were also detectable in the postnatal
striatum and adjacent SVZ regions (Fig.
10 E, F ). Finally, we wanted to assess cell
proliferation, as described previously
(Yuan et al., 1998), in organotypic slice
(P1, 400
m thick) cultures to gain more
insights from a cytoarchitecturally intact
postnatal striatum (Fig. 10G), closer to the
in vivo situation. To restrict our analysis to
the postnatal striatum, SVZ regions (as
de-fined in Fig. 10 A1) were microdissected
out and assessed similarly but separately.
BrdU incorporation was performed
dur-ing the first 24 hr of culture, i.e., between
⫹4 and ⫹22 hr after dissection. Slices next
were mechanically dissociated and plated
onto poly-ornithine-coated coverslips to
attach for 1 hr before fixation and
immu-nostaining (Fig. 10 H). We ascertained the
viability of our slice culture system by
run-ning LIVE/DEAD cytotoxicity assays just
before fixation after each experiment,
yielding to values of 88.6
⫾ 0.6 living cells
and 11.4
⫾ 0.6 dead cells (percentage of
total cells; mean
⫾ SEM; n ⫽ 3
indepen-dent experiments).
In EGF-free conditions, consistent with
our data from cultured cells, we observed
in situ that the GABA
AR agonist muscimol
(100
M) inhibited proliferation of striatal
PSA-NCAM
⫹cells both at the Tuj1
⫺stage (Fig. 10 I) and in
neuron-committed Tuj1
⫹cells (Fig. 10 J). Likewise, the addition
of SR95531 (10
M) totally abolished muscimol-induced
inhibi-tion of proliferainhibi-tion in striatal PSA-NCAM
⫹cells at both the
Tuj1
⫺(Fig. 10 I) and Tuj1
⫹stages (Fig. 10 J). Furthermore, in the
absence of exogenously applied GABA
AR agonists, SR95531
stimulated the proliferation of Tuj1
⫺(Fig. 10 I) and Tuj1
⫹(Fig.
10 J) cells within the PSA-NCAM
⫹population, just as was shown
in spheres.
We also confirmed with this ex vivo paradigm that EGF (20
ng/ml) stimulated proliferation of striatal PSA-NCAM
⫹cells
Figure 5. GABAAR activation inhibits the proliferation of PSA-NAM⫹cells at both Tuj1⫺and Tuj1⫹stages. Cells were
incubatedsimultaneouslywithdrugsandBrdU(20M)for18hrinEGF-freemedium.Theanti-mitoticagentcytosinearabinoside
(AraC, 10M) was used as an internal control condition. (A, D, G). GABAAR agonists (100MGABA and 100Mmuscimol)
inhibited the incorporation of BrdU (n⫽6;ANOVA-1followedbyaDunnett’spost-test;*p⬍0.05,**p⬍0.01,***p⬍0.0001) in total PSA-NCAM⫹cells ( A), in Tuj1⫹/PSA-NCAM⫹cells ( D), and in Tuj1⫺/PSA-NCAM⫹cells ( G). The effect of muscimol was
totally abolished by SR-95531 (100M). Baclofen (100M), a GABABR agonist, had no effect on BrdU incorporation. (A, D, G).
Muscimol (100M) significantly inhibited (n⫽ 4; Student’s t test; *p ⬍ 0.05) the mitogenic effect of EGF (20 ng/ml) (n ⫽ 4,
Student’s t test; **p⬍ 0.01, ***p ⬍ 0.0001) in total PSA-NCAM⫹cells ( B) and in Tuj1⫹/PSA-NCAM⫹cells ( E), but not in
Tuj1⫺/PSA-NCAM⫹cells ( H ). C, F, I, Confocal images of double-immunostaining for PSA-NCAM (red) and BrdU (green) ( C ),
triple-immunostaining for PSA-NCAM (red), Tuj1 (blue), and BrdU (green) (F, I ), respectively, showing that both Tuj1⫹
/PSA-NCAM⫹and Tuj1⫺/PSA-NCAM⫹cells are proliferative. Because a vast majority of cells constituting 3-DIV spheres expressed
PSA-NCAM, we found similar results on the whole-cell population, and these results were confirmed in [3H]thymidine
at both the Tuj1
⫺(Fig. 10 I) and Tuj1
⫹stages (Fig. 10 J). In contrast to data from
cultured cells, muscimol (100
M)
inhib-ited EGF-induced increase of proliferation
in striatal PSA-NCAM
⫹cells not only at
the Tuj1
⫺(Fig. 10 I) but also at the Tuj1
⫹stage, although without statistical
signifi-cance. Finally, in the presence of EGF,
SR95531 (10
M) did not increase
prolif-eration of PSA-NCAM
⫹cells at either the
Tuj1
⫺(Fig. 10 I) or Tuj1
⫹stage (Fig. 10 J),
thus suggesting that EGF may also interact
with GABA synthesis in situ in such
orga-notypic striatal slices. Altogether, such
findings emphasize that an autocrine/
paracrine GABA
AR activation may be an
essential mechanism for cell cycle control
in PSA-NCAM
⫹cells from the postnatal
striatum in vivo.
Interestingly, using this organotypic
slice culture technique, we observed that
the regulation of proliferative kinetics of
Tuj1
⫺/PSA-NCAM
⫹and Tuj1
⫹/PSA-NCAM
⫹cells in response to EGF
applica-tion and GABA
AR activation appears to be
qualitatively identical in the SVZ
(micro-dissected as defined in Fig. 10 A1) (Fig.
10 K, L) as compared with that of the
stria-tum area (microdissected as defined in Fig.
10 A1) (Fig. 10 I, J ).
Discussion
The generation of cell diversity from
mammalian NSCs is likely to be controlled
by the interaction between both extrinsic
and intrinsic cues. In addition to growth
factors, hormones, integrins, and
extracel-lular matrix components,
neurotransmit-ters are present in the developing brain
well before the onset of synaptic activity
and have been shown to be part of the
ex-trinsic control of CNS neurogenesis
in-volving progenitor cell proliferation,
mi-gration, and differentiation as well as cell
death (for review see Lauder, 1993;
Cam-eron et al., 1998; Herlenius and
Lager-crantz, 2001; Nguyen et al., 2001). Recent
studies reported that functional
neuro-transmitter receptors are expressed by a
wide variety of neuronal progenitors
dur-ing embryonic development, thus pointdur-ing to a possible role in
the transduction of important developmental cues (LoTurco et
al., 1995; Flint et al., 1998; Haydar et al., 2000; Maric et al., 2000).
In the present work, we show that (1) proliferative PSA-NCAM
⫹neuronal precursors from early postnatal rat striata synthesize
and release GABA and express functional GABA
AR in vitro and in
situ, (2) an EGF-dependent GABA-mediated
autocrine/para-crine loop regulates neuronal precursor cell division in the
post-natal striatum, and, (3) the levels of GABA synthesized by
PSA-NCAM
⫹cells in vitro were found to be in the same range of
concentration as that of GABAergic brain areas in vivo
(Miranda-Contreras et al., 1999). This work emphasizes that GABA may
serve as a physiological signal that could regulate proliferation of
neuronal progenitors and likely neurogenesis in the postnatal
striatum.
Functional GABA
Areceptors are expressed in postnatal
PSA-NCAM
ⴙcells
GABA, the principal inhibitory neurotransmitter of the adult
CNS, may act as a trophic factor during CNS development long
before the onset of inhibitory synaptogenesis (Barker et al., 1998).
We wanted to determine whether functional GABA
ARs were
ex-pressed in neurogenic PSA-NCAM
⫹progenitors isolated from
rat striatum at the early postnatal period, when spontaneous and
growth factor-stimulated proliferation is established to persist at
Figure 6. EGF-dependent production of endogenous GABA intrinsically inhibits the proliferation of PSA-NCAM⫹precursor
cells. A, RT-PCR amplification of both GAD 65 and GAD 67 transcripts from 3-DIV PSA-NCAM⫹spheres and from control adult rat
brain using specific sets of primers. RT-PCR analysis yielded bands with the appropriate amplicon size for GAD 65 (698 bp) and for the full-length functional GAD 67 (252 bp). Left margin indicates migration of standard DNA markers with size indicated in base pairs. B, C, Three-DIV-old dissociated PSA-NCAM⫹spheres labeled for GAD 65 (B, green) or GAD 67 (C, green) and counterstained
by Etd1 (red). D, Dissociated 3-DIV progenitors immunostained for GABA (green) and counterstained with Etd1 (red). Scale bars: B–D, 10m. E, F, Histograms representing the differences of BrdU incorporation index (BrdU⫹cells/total cells, %) between
treated and untreated conditions, respectively, in total PSA-NCAM⫹( E) and Tuj1⫹/PSA-NCAM⫹cells ( F ). Antagonists and
positive allosteric modulators of GABAAR were applied on 3-DIV-old synchronized cells for 18 hr of BrdU incorporation assay.
GABAAR antagonists (10MSR-95531, 5Mpicrotoxin, and 100Mbicuculline) significantly increased the percentage of
PSA-NCAM⫹/BrdU⫹cells (n⫽ 3; ANOVA-1 followed by a Dunnett’s post-test, ns; *p ⬍ 0.05) (E) and Tuj1⫹/PSA-NCAM⫹/
BrdU⫹cells (n⫽ 3; ANOVA-1 followed by a Dunnett’s post-test; *p ⬍ 0.05, **p ⬍ 0.01) (F). Conversely, GABA AR-positive
allosteric modulators decreased the percentage of PSA-NCAM⫹/BrdU⫹cells ( E) and Tuj1⫹/PSA-NCAM⫹/BrdU⫹cells ( F ) as
compared with control. Saclofen (10M), a GABABR antagonist, had no effect (E, F ). G, H, In the presence of EGF (20 ng/ml) (n⫽
4; Student’s t test; ***p⬍ 0.0001), SR-95531 (10M) (n⫽ 4; Student’s t test; **p ⬍ 0.01, ***p ⬍ 0.0001) had no effect on
proliferationoftotalPSA-NCAM⫹cells( G)andofTuj1⫹/PSA-NCAM⫹cells( H ).I,HistogramshowingtheconcentrationofGABA
measured by HPLC in synchronized 3-DIV-old PSA-NCAM⫹spheres treated or not with EGF for 18 hr. EGF-treated spheres