HAL Id: hal-01075703
https://hal.archives-ouvertes.fr/hal-01075703
Submitted on 20 Oct 2014
HAL is a multi-disciplinary open access
archive for the deposit and dissemination of
sci-entific research documents, whether they are
pub-lished or not. The documents may come from
teaching and research institutions in France or
abroad, or from public or private research centers.
L’archive ouverte pluridisciplinaire HAL, est
destinée au dépôt et à la diffusion de documents
scientifiques de niveau recherche, publiés ou non,
émanant des établissements d’enseignement et de
recherche français ou étrangers, des laboratoires
publics ou privés.
Recent Trends in Satellite Image Pan-sharpening
techniques
Kidiyo Kpalma, Miloud Chikr El-Mezouar, Nasreddine Taleb
To cite this version:
Kidiyo Kpalma, Miloud Chikr El-Mezouar, Nasreddine Taleb. Recent Trends in Satellite Image
Pan-sharpening techniques. 1st International Conference on Electrical, Electronic and Computing
Engi-neering, Jun 2014, Vrniacka Banja, Serbia. �hal-01075703�
Abstract—Nowadays, there are several satellites bearing
sensors to provide images from different spectral bands at the same time, but with various resolutions and at different frequencies. In practice, there is an image captured over a wide spectral band which is known as panchromatic (PAN) image. Besides this image there are at least three multispectral (MS) images captured over narrower spectral bands including the visible red (R), green (G) and blue (B) bands. Commonly, multispectral images have lower spatial resolution than that of panchromatic image. Though, today's sensors can produce multispectral images with higher spatial resolution than before, it is still desirable to enhance their resolution in order to approach that of the PAN image. The process of generating high resolution color images from MS and PAN images is known as pan-sharpening. This process fuses the low-resolution MS images with the higher-low-resolution PAN image so that the resulting images corresponding to MS images are of the same resolution as the PAN image. This helps to obtain color images with higher spatial resolution for better visualization of remote sensing color images.
This paper presents a review of pan-sharpening methods and then analyzes the trends of the algorithms. Through this review, we will analyze the impact of pan-sharpening on remote sensing images processing, and particularly, we will observe the income of pan-sharpening in vegetation detection. Based on our previous work, a strategy is implemented to evaluate the performance of pan-sharpened images.
Index Terms—Panchromatic images, multispectral images,
pan-sharpening, NSCT, IHS, quality assessment, vegetation detection ….
I. INTRODUCTION
Recent technological developments in electronics have enabled remote sensing systems to reach fine resolution images over the ground. The images obtained from remote sensing systems depend on the sensor capabilities in terms of spatial resolution (the size of the elementary area the sensor can capture), the revisit time (which is the time elapsed between two consecutive observations of the same point on the earth by a sensor and expresses temporal resolution) and the wavelength bands captured by the sensor that express spectral resolution. Either of these resolutions will be preferred depending on the application. This paper is only concerned by spatial and spectral resolutions.
In terms of spectrum, three types of images are produced by remote sensing systems: optical images, Synthetic
K. Kpalma is with UEB INSA IETR, Department of Image and Automatic, CS 70839 35708 Rennes Cedex 7, France
(e-mail: [email protected]).
M. Chikr El-Mezouar and N. Taleb are with the Department of Electronics, University of Djillali Liabes, 22000 Sidi Bel Abbes, Algeria
(e-mail: [email protected], [email protected]).
Aperture Radar (SAR) images and Light Detection And Ranging (LiDAR) images.
Radio Detection and Ranging (Radar) is an object-detection system developed in the 1950s that uses radio waves to determine the range, altitude, direction, or speed of objects. Synthetic Aperture Radar (SAR) is a technique for obtaining high-resolution images of the earth's surface. In SAR imaging, microwave pulses are transmitted by an antenna towards the earth surface. Then the SAR system detects the reflected microwave energy and forms an image using the time delay of the backscattered signals. Over the area of the surface being observed, these images represent the backscattered microwave energy, the characteristics of which depend on the properties of the surface, such as its slope, roughness, humidity, textural inhomogeneities and dielectric constant.
LiDAR (Light Detection And Ranging1 or a portmanteau derived from Light and raDAR) systems are based on the light pulses to observe the earth. By analyzing the time elapsed between the pulsed light and the light reflected by a target. This gives a high-quality 3D information about surface of the target. It enables to capture the height of both the terrain and objects such as buildings, in amazingly fine resolution details: it provides a rapid and accurate terrain mapping system. The frequency range of the laser light used in LiDAR lays in the ultra-violet, visible or near infrared bands [1]. Due to its capability to detect multiple echoes of the same pulse the LiDAR can see through water, canopies and trees on the ground to map surface terrain and to estimate the depth of the water body or plantation.
For the rest of the paper, we will focus on the optical images as we are only concerned by the visible spectral bands. For more details concerning the other systems, we urge the reader to refer to [1].
II. OPTICAL IMAGES
Remote sensing optical images are captured over the earth surface in visible, near infrared and short-wave infrared bands. The wavelengths of the bands in an optical remote sensing system ranges from 0.30mm to 15.00mm. Depending on the number of spectral bands used, optical images are classified into four broad categories, Panchromatic (PAN), Multi-Spectral (MS), Super-Spectral (SS) and Hyper-Spectral (HS). Radiometric, spectral, textural, geometric and contextual information contained in an optical image, is very useful for its understanding.
1http://www.webcitation.org/6H82i1Gfx (visited June 2014)
Recent Trends in Satellite Image
Pan-sharpening techniques
A. Panchromatic image
A panchromatic sensor consists of a single band detector sensitive to radiation within a wide spectral range covering visible as well as IR wavelengths. If the wavelength range lies within the visible range, then the resulting image will appear as a black and white photograph taken from space. The color of the targets is not available. It is usually displayed as a grey scale image as in figure 1 that shows PAN image of Yokohama, Japan acquired October 5, 2007 by WorldView-1. Though it is also different in a way that unlike black and white photograph, PAN sensors of some satellites also cover the infrared wavelengths and in some satellites, these do not cover the blue wavelengths. The PAN images always have greater resolutions than the MS images from the same satellite. It is due to the much more energy per unit area gathered by a PAN sensor due to its wider bandwidth. Refer to figure 2 that shows the frequency response of the PAN sensor of WorldView-1. Examples of panchromatic imaging system are Ikonos Pan, QuickBird PAN and WorldView PAN.
Fig. 1: A WorldView-1 Panchromatic image of Yokohama, Japan acquired October 5, 2007 2
Fig. 2: WorldView-1 imager relative spectral radiance response [2], [1]
2
http://www.satimagingcorp.com/galleryimages/worldview-1-satellite-image-yokohama-japan.jpg (visited June 2014)
B. Multi-spectral image
The sensor of a multi-spectral imaging system is obtained from a set of multi-band sensors (less than 10 bands). Compared to panchromatic imaging system, the recorded radiation of a multispectral imaging system is within a narrow range of wavelength for each band. Both brightness and spectral (color) information of the targets being observed are available on the resulting image. Whatever, multispectral images have a low resolution they can cover the visible as well as infrared range of wavelengths. In figure 3 the responses of the PAN as well as the 8 multispectral sensors of WorldView-2 satellite are shown to illustrate the used range of the electromagnetic spectrum from the visible to the infrared part. The three visual primary color bands (red, green, blue) of MS image may be combined to produce a “true color” image. However, one can assign any MS image to any color band in an entirely arbitrary manner. In this case, the color of a target in the displayed image differs from its actual color. The resulting product is known as a "false color" image. Figure 4 illustrates a scene from the Hajj pilgrimage area in Mecca at Saudi Arabia acquired November 2, 2011, with a true color image having 0.5m resolution captured by WorldView-2.
Fig. 3: Spectral Response of the WorldView-2 panchromatic and multispectral imager [2]
Fig. 4: half-meter satellite photo of the Hajj pilgrimage captured by WorldView-23
This image is a pan-sharpening result of the original multispectral bands (of 2m resolution) with the corresponding panchromatic image having 0.5m resolution.
3
Pan-sharpening is a process of fusing PAN and MS images to create a single high spectral and spatial resolution image.
In case of satellite that does not have the three true color bands: Red, Green and Blue, it is recommended to use a false color representation. SPOT-5 is an example, where blue band is not available. This missing band can be replaced by the NIR band and then displayed as red channel. The red and green bands are displayed as green and blue channels, respectively, generating a false color image representation (see figure 5 left picture). Moreover, by combining multispetral bands, it is possible to get a natural color appearance of the image, as it is shown at the right of figure 5.
Fig. 5: SPOT 5: left image: Naples4at 5 m resolution and right image: Paris5at 2.5 m resolution
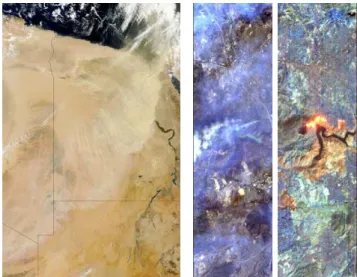
Super-spectral and Hyper-spectral images: an imaging system is considered super-spectral if it acquires more than ten spectral bands. It will be hypersepctral if the number of the captured spectral bands is more than one hundred. Bandwidths are narrower when the number of spectral bands increases. Thus, sensors will be able to capture the finer spectral characteristics of the features of the targets. These types of systems will improve understanding of global dynamics and processes occurring on the land, in the oceans, and in the lower atmosphere. It finds a potential applications in such fields as precision agriculture (e.g. monitoring the types, health, moisture level and maturity of crops), coastal management (e.g. monitoring of phytoplankton, pollution, bathymetry changes) etc. Examples of superspectral optical remote sensing systems are MODIS (36 spectral bands) and MERIS (15 programmable spectral bands), and of a hypespectral is Hyperion (242 spectral bands).
Example of MODIS image is illustrated on the left of figure 6. This natural color image acquired on April 2012 and issued from the combination of bands 1, 4 and 3, shows a dust storm over Egypt. The middle and right images of this figure, captured on October 23, 2007 using Hyperion spectrometer, show wildfire areas in Southern California. The middle data visualization represents the scene, as the human eye would see it. Using three of shortwave infrared bands gives a better view of the burning fire, as illustrated in the right side of figure 6.
4 http://spot5.cnes.fr/images/naples/naples_no_01.html (visited June
2014)
5http://spot5.cnes.fr/images/paris/paris_so_01.htm (visited June 2014)
Fig. 6: Left: MODIS image6, middle: Hyperion image 17and right Hyperion image 28
III. PAN-SHARPENING
A. Motivation of pan-sharpening
The quality of images, provided by earth observation satellites systems, is directly linked to their spatial and spectral resolutions [3]. The images produced by these sensors allow the discrimination of geometric structures according to the spatial resolution. When the sensor is able to integrate the incident radiation energy over a wide range of wavelength band, as the case of panchromatic image, it offers little information on the spectral level, but at the same time, it offers a high spatial resolution. In contrast, some sensors capture energy over a set of much narrower bands of spectrum to produce multispectral images. Then their spectral resolution is much higher, but at the cost of a low spatial resolution. Note that the terms of resolution 'high' or 'low' are relative terms to describe different resolutions between images acquired by a single observation system for PAN and MS images [1].
The advantage of using MS images with a high spatial resolution has already been demonstrated in many remote sensing applications. The color information helps in the distinction of different regions of the image compared to the grayscale PAN image. Therefore, if we can use these spectral contents while taking advantage of a better spatial resolution, the identification of objects in a scene will be enriched and more accurate [1].
The question is why manufacturers have not directly built sensors able to provide images with high spatial and high spectral resolutions?
In fact, these notions are contradictory from a technical point of view for a given technology; when the acquisition spectrum of a sensor is large the incident light flux on a pixel of the image is great. The pixel size is then lower and therefore the image has better spatial resolution. At the opposite, a narrow acquisition spectrum, including a
6http://modis.gsfc.nasa.gov/gallery/individual.php?db_date=2012-04-22 (visited June 2014) 7 http://www.nasa.gov/images/content/194419main_eo-1_RGB.jpg (visited June 2014) 8 http://www.nasa.gov/images/content/194420main_eo-1_SWIR.jpg (visited June 2014)
restricted incident light flux on a pixel, produces a low spatial resolution.
To overcome this problem, it is possible to combine these data, PAN and MS, and produce MS imagery with a higher spatial resolution by using suitable algorithms. This concept is known as multispectral or multisensor merging, fusion or pan-sharpening [4]. Pan-sharpening can be defined as a pixel level fusion technique used to synthesize the MS images to a higher resolution using spatial information from the PAN image.
Pan-sharpening techniques increase the spatial resolution while simultaneously preserving the spectral information in the final produced MS image, giving the best of the two worlds: high spectral resolution and high spatial resolution. Wald in [5] defines image fusion as: “a formal framework in which are expressed means and tools for the alliance of data originating from different sources. It aims at obtaining information of greater quality; the exact definition of ‘greater quality’ will depend upon the application”.
B. Methods and trends in pan-sharpening
A large collection of pan-sharpening techniques have been proposed in the literature. Among the huge number of these techniques, the widely used methods include intensity-hue-saturation (IHS), high-pass filtering (HPF), principal component analysis (PCA), Brovey and wavelet transforms [6]. In [7], a review of these classical methods is provided. The launch of the SPOT satellite in 1986 has allowed civilian community of remote sensing to use high resolution MS images. The IHS transform was used in [8] to merge MS and PAN images of the SPOT satellite. Chavez et al. [9] used the high-pass filtering (HPF) method of minimizing the spectral distortion in the resulting images. This algorithm was applied to sharpen Landsat Thematic Mapper (TM) images with SPOT PAN images. The high-frequency information of the PAN image, related to spatial information, is extracted using a high-pass filter and then injected into the MS image. The HPFs were mainly used in several pan-sharpening methods, using different tools for extracting spatial information and injecting it in MS images as: the discrete wavelet transform [10], [11], [12], [13], the generalized Laplacian pyramid algorithms [14], [15], or “à trous” wavelet transforms [16], [17]. Recently, authors in [18] introduced the Contourlet transform and showed that it is better than the Wavelet transform. Hence Contourlet was used in the pan-sharpening process like in [19] and [20].
Image fusion methods have been classified in several ways. The authors in [7] proposed to classify pan-sharpening in three categories corresponding to three different processing levels, i.e., pixel level, feature level, and the decision level. Many other authors shared this idea, however author in [21] emphases that the boundaries between the three levels are unclear. So in some situations, it becomes controversial to decide the level of the fusion to perform. Moreover, the author in [5] declared that this categorization may be misleading and it may falsely imply that fusion processes do not deal simultaneously with these different levels. Hence, he proposed another categorization, where three types of methods have been identified: projection and substitution methods, relative spectral contribution methods and those linked to the ARSIS concept
(from its French acronym “Amélioration de la Résolution Spatiale par Injection de Structures” which means “Enhancement of the spatial resolution by structure injections”).
The authors in [22] sort the methods into groups with respect to their main design idea. The following groups were defined.
- Transformation based fusion: like IHS and PCA. - Addition and multiplication fusion: like the method
(P+XS).
- Filter fusion: like HPF method. - Fusion based on inter-band relations. - Wavelet decomposition fusion
- And finally further fusion methods: like those based on statistical properties.
The HPF and wavelet methods can be classified into the ARSIS group [23]; however the authors in [24] claim that these methods could belong to an IHS-like image fusion method group.
Another classification given in [4] defines three categories: spectral domain, spatial domain and scale-space techniques.
The authors in [25], [26] proposed two generalized frameworks for methods such as IHS, PCA, HPF or AWT and provided detailed relationships between them.
Recently, the authors in [27] provide a review of many pan-sharpening methods with their categorization. We fully agree with this categorization and think that it is more accurate and include the most known pan-sharpening methods:
- Component Substitution (CS) category: first, the images are linearly transformed; then some of the original bands are replaced with the transformed ones. Examples are methods using IHS and PCA. For IHS method, the R, G and B bands are transformed to obtain I, H and S bands. Then the I band is replaced with the pan image to apply IHS backward transform to generate pan-sharpened R', G' and B' bands. - Relative Spectral Contribution category: the fused
results are obtained by a linear combination of the spectral bands. Examples are methods using the Brovey Transform and P+XS.
- High-Frequency Injection category: spatial details extracted from the PAN image, using a high pass filter, are injected in the MS images. An example is HPF.
- Methods based on the statistics of the image, as Bayesian-based and super-resolution methods. - Multiresolution category: it is based on a
multiresolution analysis like generalized Laplacian pyramid, wavelet and contourlet methods. Moreover, techniques combining multiresolution analysis with methods from other categories, like a combination of wavelet and IHS, belong to this group.
It should be noted that some methods can be classified into more than one category.
In the two following figures, pan-sharpening methods, belonging to different categories, are applied to the same MS and PAN images in order to compare the obtained results.
MS images but with color distortion, especially in vegetation areas. The proposed method in [28] uses the Normalized Difference Vegetation Index (NDVI) to correct pan-sharpened images. In [29], the authors have introduced a new high-resolution NDVI (HRNDVI) index based on which they proposed a method to reduce color distortion and to enhance the vegetation. Like IHS, the main drawback of the PCA-based fusion is the distortion of the spectral information.
The recently proposed pan-sharpening methods are based on multi-resolution approaches of the Laplacian pyramid, the wavelet transform, and the Contourlet Transforms (CT).
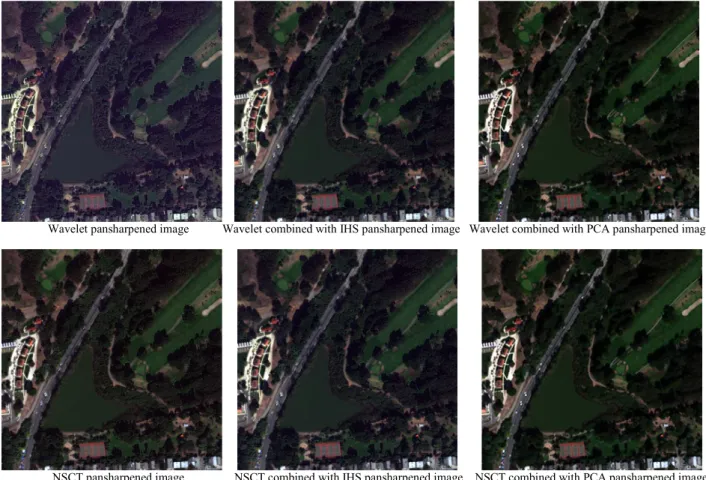
As can be seen on figure 7, the obtained images show clearly that methods based on multiresolution give better results compared with the other pan-sharpening techniques.
Indeed, methods belonging to multiresolution category provide actually the most significant pan-sharpened images. The wavelet transform is widely used in pan-sharpening thanks to its properties such as multi-resolution, localization, critical sampling, and limited directionality (horizontal, vertical, and diagonal directions) [27]. However, it fails to capture the smoothness along the contours [30]. CT seems to overcome this drawback [31]. In fact, CT is a multi-resolution transform which provides an efficient directional representation and takes into consideration wavelet properties. Thus CT has been used for image fusion and pan-sharpening in [30] and in [27]. The Non-Subsampled
Contourlet Transform (NSCT) is a shift invariant version of CT. Figure 8 illustrates the performance of multiresolution pan-sharpening and the effect of applying IHS or PCA after multiresolution transform.
MS image PAN image
IHS pan-sharpened image PCA pan-sharpened image
Brovey pan-sharpened image P+XS pan-sharpened image high-pass filtering pan-sharpened image Fig. 7: pan-sharpening examples for component substitution, relative spectral contribution and high-frequency injection categories.
Coarse level MSi
(T)
Fig. 9: NSCT-based pan-sharpening method for an ith band (MS i)
MSi Band (size T)
1-Level NSCT PAN (size 4T)
3-Level NSCT
Coarse level PAN (4T)
Up-sampling to 4T
3-Level NSCT-1
Pan-sharpened MSi band (size 4T)
Fine level 1 PAN (4T) Fine level 2 PAN (4T) Fine level 3 PAN (4T) Fine level 1 MSi (T) Up-sampling to 4T
Local energy-based Fusion
Wavelet pansharpened image Wavelet combined with IHS pansharpened image Wavelet combined with PCA pansharpened image
NSCT pansharpened image NSCT combined with IHS pansharpened image NSCT combined with PCA pansharpened image Fig. 8: pansharpening examples for multiresolution category.
Figure 9 represents the bloc diagram of a recent method based on NSCT to pan-sharpen MS images [3]. This method was tested on WorldView-2 images and was found to provide pan-sharpened images with very good quality compared to the state-of-the-art methods based on multiresolution (see Table I).
C. Assessment of pan-sharpening
The quality assessment of the pan-sharpened MS images presents a problem since no reference image exists at the pan-sharpened resolution. Even when reference MS images are available, the assessment of faithfulness to the reference usually requires computation of a number of different indexes. In this paper, we have selected the following widely used indexes for assessing the quality:
The correlation coefficient (CC) [29]: it is the most popular. It measures the similarity between the fused and original images. A CC value of +1 indicates that the two images are highly correlated or similar.
The correlation between high frequencies (sCCz) based on [11]: a high-pass filter is applied to the fused bands and the PAN image. Then, the CC coefficient between the resulting images is computed.
The correlation between high frequencies (sCCo) based on [32]: in this case high-pass filtered versions of the pan-sharpened bands are compared with the high-pass filtered versions of the original MS bands.
The relative bias (BIAS): it is the difference between the mean of the original image and that of the fused one, divided by the mean of the original image [29].
The relative variance (VAR): it represents the difference in variance between the original and fused images, divided by the variance of the original image [29].
The standard deviation (SD) of the difference image in relation with the mean of the original image: it indicates the level of the error at any pixel [29].
The Structural SIMilarity (SSIM) index: it measures the similarity between two images [33]. The SSIM index can be viewed as a quality measure of one of the images being compared, provided the other image is regarded as of perfect quality.
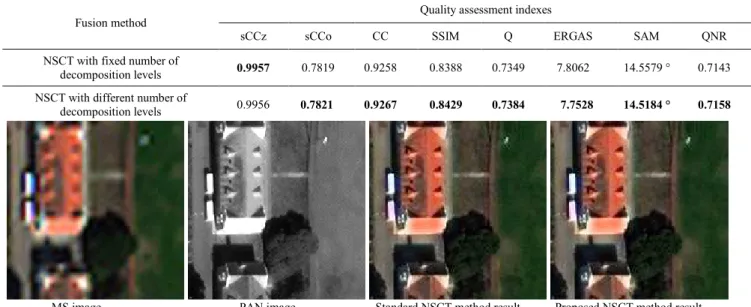
MS image PAN image Standard NSCT method result Proposed NSCT method result Fig. 10: NSCT-based pan-sharpening.
The universal objective image quality index (Q) [34]: it models distortion as a combination of three different factors: loss of correlation, luminance distortion, and contrast distortion.
The relative average spectral error (RASE): it is used to characterize the average performance of the pan-sharpening method in spectral bands [35].
The root-mean-square error (RMSE) [29].
The average spectral angle mapper (SAM): it computes the change in angle of spectral vectors [36].
The relative dimensionless global error in synthesis (ERGAS): it provides a single quantity synthesizing the quality of the fused data set [37].
The QNR index [38]: it is used to assess fusion quality without requiring reference images. It is based on the universal quality index Q proposed in [34], and includes two
indexes, one for spectral distortion and the other for spatial distortion. In the QNR approach, it is assumed that the inter bands spectral quality of the pan-sharpened images is unchanged after the fusion process.
The best value for indexes CC, sCCz, sCCo, SSIM, Q and QNR is 1, whereas it is 0 for indexes BIAS, VAR, SD, RASE, RMSE, SAM and ERGAS.
The protocol of Wald described in [39] is usually used to evaluate pan-sharpened images. It consists of three properties but only the first one can always be assessed since the two others need the reference. In order to apply the whole protocol, two approaches must be conducted. In the first approach the pan-sharpening is performed at the full scale. In this approach the reference is not available; for this reason it is possible to directly assess only the first property
TABLEI
QUANTITATIVE ASSESSMENT OF PAN-SHARPENED IMAGES
Fusion method
Quality assessment indexes
sCCz sCCo CC SSIM Q ERGAS SAM QNR NSCT with fixed number of
decomposition levels 0.9957 0.7819 0.9258 0.8388 0.7349 7.8062 14.5579 ° 0.7143 NSCT with different number of
of Wald’s protocol. The second and the third properties of Wald’s protocol can be indirectly verified by using the QNR and sCCz indexes. The second approach, instead, allows directly verifying also the second and the third properties. It consists of down-sampling all the dataset (panchromatic and multispectral), making pan-sharpening at lower scale and using the original multispectral as reference [40]. This approach is used to compute indexes sCCo, CC, Bias, VAR, SD, SSIM, Q, ERGAS, RASE, RMSE and SAM. In this way the protocol is entirely applied. In the first approach, the second and the third property of Wald’s protocol are indirectly assessed by using the QNR and sCCz indexes; while in the second approach the indexes the CC, SSIM, Q and sCCo indexes verify the second property; and finally indexes ERGAS and SAM verify the third property. In general, the two fusions must be conducted: one at full scale and the other at lower scale. The former is used for computing the sCCz and QNR indexes. The latter is used to compute the rest of the indexes: sCCo, CC, Bias, VAR, SD, SSIM, Q, ERGAS, RASE, RMSE and SAM.
Figure 10 shows two examples of NSCT-based fusion methods. From left to right are shown the MS image, the PAN image, the fused image using the standard NSCT-based method and a recent NSCT-NSCT-based pan-sharpening with a different number of decomposition levels [3].
In the traditional pan-sharpening based on NSCT (we call it "Standard NSCT"), the MS images and the PAN image are first decomposed up to the same number N of levels. Then the coarse level of PAN image decomposition is replaced with that of MS image to apply backward NSCT transform. But one can observe that: in a multiresolution process, the MS image of size T is equivalent to reducing the resolution of the PAN image of size 4T down to 2 levels; so decomposing PAN and MS images to the same number of levels and combining the coarse level of MS and the fine levels of PAN in the backward NSCT transform appears to be unjustified: there is a mix of resolutions. So the idea to overcome this drawback is to decompose the MS image to 1 level and decompose the PAN image to 3 levels. By doing this, the 3-level NSCT PAN image and the 1-level NSCT MS image are of equivalent resolutions. Now, one can apply the backward NSCT transform after replacing the coarse level of PAN image with that of MS image.
Some indexes, assessing the quality of the fused images, are computed and shown in Table I. This table demonstrates the efficiency of the proposed method. Spatial quality is measured by sCCz and sCCo, while spectral quality is evaluated using the rest of the indexes. From Table I, it is obvious that the proposed method, based on different number of decomposition levels, gives better results, in terms of most of the indexes, compared to the standard method based on a fixed number of decomposition levels for both the MS and the PAN images.
IV. APPLICATION TO VEGETATION ASSESSMENT
One of the main applications of pan-sharpening is the assessment of the vegetation conditions. As it has been shown in [29], vegetation detection can be improved by using pan-sharpened images in the computation of the vegetation index. Hence, a new NDVI, the HRNDVI, has been proposed that integrates pan-sharpened bands instead
of the corresponding original ones.
This statement is confirmed by the recent study [41] about the effect of pan-sharpening on vegetation indices. In this study, some pan-sharpening methods are applied before computing the vegetation indices. This study concluded that it may be desirable to apply pan-sharpening prior to vegetation indices computation.
V. CONCLUSION
Image pan-sharpening is a process of fusing low spatial resolution but high spectral resolution MS images with the high spatial resolution but low spectral resolution PAN image to produce high spatial and high spectral resolution multispectral image. This provides high quality color image for better visualization of remote sensing images.
This paper has presented an overview of pan-sharpening methods. It is observed that the trends in pan-sharpening are to use multiresolution methods.
We have also shown that using different number of decomposition levels gives better pan-sharpening quality than when using the same number of decomposition levels.
Though pan-sharpening may affect the vegetation indexes, it has been shown that the distortions are insignificant in the assessment of the vegetation conditions. ACKNOWLEDGMENT
This work was supported in part by the Franco-Algerian cooperation program PHC TASSILI grants. Entitled "Système Conjoint de Compression et d’Indexation Basé-Objet pour la Vidéo (SCCIBOV)", the project gathers members of Institut National des Sciences Appliquées (INSA) de Rennes, Université de Technologie de Compiègne (UTC), the University of Sidi Bel Abbès and the University of Mascara.
REFERENCES
[1] Chikr El-Mezouar M., Image fusion in satellite remote sensing, PhD thesis, INSA de Rennes, December 12, 2012
[2] “Spectral Responses for DigitalGlobe Earth Imaging Instruments”, available at http://www.digitalglobe.com/resources/Technical Information, accessed 04/25/2012
[3] M. Chikr El-Mezouar, N. Taleb, K. Kpalma, and J. Ronsin, “A Pan-Sharpening Based on the Non-Subsampled Contourlet Transform: Application to Worldview-2 Imagery,” Selected Topics in Applied Earth Observations and Remote Sensing, IEEE Journal of , vol.7, no.5, pp.1806-1815, May 2014, doi: 10.1109/JSTARS.2014.2306332 [4] Schowengerdt, R., Remote Sensing: Models and Methods for Image
Processing, 3rd ed., Academic Press, Elsevier, NY, 2007.
[5] Wald, L. Some terms of reference in data fusion. IEEE Transaction on Geoscience and Remote Sensing, vol. 37, no. 3, pp. 1190–1193. (May 1999 ).
[6] Dong J., Dafang Z., Yaohuan H. and Jinying F. (2011). Survey of Multispectral Image Fusion Techniques in Remote Sensing Applications, Image Fusion and Its Applications, Yufeng Zheng, Alcorn State University, USA (Ed.), ISBN: 978-953-307-182-4, InTech, Available from: http://www.intechopen.com/books/image- fusion-and-its-applications/survey-of-multispectral-image-fusion-techniques-in-remote-sensing-applications
[7] C Pohl, JLV Genderen, Multi-sensor image fusion in remote sensing: Concepts, methods, and applications. Int J Remote Sens. 19(5), 823– 854 (1998). doi:10.1080/014311698215748
[8] R Welch, M Ehlers, Merging multiresolution SPOT HRV and landsat TM data. Photogramm Eng Remote Sens. 53(3), 301–303 (1987) [9] PS Chavez, JA Bowell Jr, Comparison of the spectral information
content of Landsat Thematic Mapper and SPOT for three different sites in the Phoenix, Arizona region. Photogramm Eng Remote Sens. 54(12), 1699–1708 (1988)
[10] B Garguet-Duport, J Girel, JM Chassery, G Pautou, The use of multiresolution analysis and wavelets transform for merging SPOT panchromatic and multispectral image data. Photogramm Eng Remote Sens. 62(9), 1057–1066 (1996)
[11] J Zhou, DL Civco, JA Silander, A wavelet transform method to merge Landsat TM and SPOT panchromatic data. Int J Remote Sens. 19(4), 743–757 (1998). doi:10.1080/014311698215973
[12] T Ranchin, L Wald, Fusion of high spatial and spectral resolution images: The ARSIS concept and its implementation. Photogramm Eng Remote Sens. 66, 49–61 (2000)
[13] DA Yocky, Image merging and data fusion by means of the discrete twodimensional wavelet transform. Optical Society of America. 12(9), 1834–1841 (September 1995). doi:10.1364/JOSAA.12.001834 [14] B Aiazzi, L Alparone, S Baronti, A Garzelli, Context-driven fusion of
high spatial and spectral resolution images based on oversampled multiresolution analysis. IEEE Trans Geosc Remote Sens. 40(10), 2300–2312 (2002). doi:10.1109/TGRS.2002.803623
[15] A Garzelli, F Nencini, Interband structure modeling for pan-sharpening of very high-resolution multispectral images. Information Fusion 6, 213–224 (2005). doi:10.1016/j.inffus.2004.06.008 [16] J Nuñez, X Otazu, O Fors, A Prades, V Pala, R Arbiol,
Multiresolution-based image fusion with additive wavelet decomposition. IEEE Trans Geosci Remote Sens. 37(3), 1204–1211 (1999). doi:10.1109/36.763274
[17] Y Chibani, A Houacine, The joint use of IHS transform and redundant wavelet decomposition for fusing multispectral and panchromatic image. Int J Remote Sensing 23(18), 3821–3833 (2002). doi:10.1080/ 01431160110107626
[18] AL da Cunha, J Zhou, MN Do, The nonsubsampled contourlet transform: Theory, design, and applications. IEEE Trans. Image Process. 15(10), 3089–3101 (2006)
[19] M Gonzalo, C Lillo-Saavedra, Multispectral images fusion by a joint multidirectional and multiresolution representation. Int J Remote Sens. 28(18), 4065–4079 (2007). doi:10.1080/01431160601105884 [20] I Amro, J Mateos, Multispectral image pan-sharpening based on the
contourlet transform, in Journal of Physics Conference Series. 206(1), 1–3 (2010)
[21] S. Stubberud, P. Shea and D. Klamer, “ Data Fusion: A Conceptual Approach to Level 2 Fusion (Situational Assessment)”, Signal Processing, Sensor Fusion, and Target Recognition XII, Ivan Kadar, Editor, Proceedings of SPIE Vol. 5096 (2003)
[22] Bretschneider T., Kao O., Image fusion in remote sensing, Proceedings of the 1st Online Symposium of Electronic Engineers. [23] T Ranchin, B Aiazzi, L Alparone, S Baronti, L Wald, Image fusion:
The ARSIS concept and some successful implementation schemes. ISPRS Journal of Photogrammetry & Remote Sensing 58, 4–18 (2003). doi:10.1016/S0924-2716(03)00013-3
[24] TM Tu, SC Su, HC Shyu, PS Huang, A new look at IHS-like image fusion methods. Inf Fusion 2(3), 177–186 (2001). doi:10.1016/S1566-2535(01)00036-7
[25] Z Wang, D Ziou, C Armenakis, D Li, Q Li, A comparative analysis of image fusion methods. IEEE Trans Geosci Remote Sens. 43(6), 1391–1402 (2005)
[26] B Aiazzi, S Baronti, F Lotti, M Selva, A comparison between global and context-adaptive pan-sharpening of multispectral images. IEEE Geoscience and Remote Sensing Letters 6(2), 302–306 (2009) [27] I. Amro, J. Mateos, M. Vega, R. Molina, and A.K. Katsaggelos, “A
survey of classical methods and new trends in pan-sharpening of multispectral images,” EURASIP Journal on Advances in Signal Processing, vol. 2011, no. 79, pp. 1-22, 2011.
[28] M. Chikr El-Mezouar, N. Taleb, K. Kpalma, and J. Ronsin, “A new intensity-hue-saturation fusion technique imagery with color distortion reduction for IKONOS,” ICGST Int. GVIP J., vol. 9, no. 4, pp. 53–60, 2009.
[29] M. Chikr El-Mezouar, N. Taleb, K. Kpalma, and J. Ronsin, “An IHS-Based Fusion for Color Distortion Reduction and Vegetation Enhancement in IKONOS Imagery,” IEEE Trans. Geosci. Remote Sensing, vol. 49, no. 5, pp. 1590-1602, May 2011.
[30] VP. Shah, NH. Younan, and RL. King, “An efficient pan-sharpening method via a combined adaptive PCA approach and contourlets,” IEEE Trans. Geosci. Remote Sensing, vol. 46 no. 5, pp.1323-1335, May 2008.
[31] MN. Do, and M. Vetterli, “The contourlet transform: an efficient directional multiresolution image representation,” IEEE Trans. Image Process., vol. 14, no. 12, pp. 2091-2106, Dec. 2005.
[32] X. Otazu, M. Gonzalez-Audicana, O. Fors, and J. Nunez, “Introduction of sensor spectral response into image fusion methods. Application to wavelet-based methods,” IEEE Trans. Geosci. Remote Sens., vol. 43, no. 10, pp. 2376–2385, Oct. 2005.
[33] Z. Wang, AC. Bovik, HR. Sheikh, and EP. Simoncelli, “Image quality assessment: From error visibility to structural similarity,” IEEE Trans. Image Process., vol. 13, no. 4, pp. 600-612, Apr. 2004.
[34] Z. Wang, and AC. Bovik, “A Universal Image Quality Index,” IEEE Signal Process. Lett., vol. 9, no. 3, pp. 81-84, Mar. 2002.
[35] M. Choi, “A New Intensity-Hue-Saturation Fusion Approach to Image Fusion with a Tradeoff Parameter,” IEEE Trans. Geosci. Remote Sens., vol. 44, no 6, pp. 1672-1682, Jun. 2006.
[36] RH. Yuhas, AFH. Goetz, and J. W. Boardman, “Discrimination among semi-arid landscape endmembers using the spectral angle mapper (SAM) algorithm,” in Proc. Summaries 3rd Annu. JPL Airborne Geosci. Workshop, 1992, volume 1, pp. 147-149.
[37] L. Wald, “Quality of high resolution synthesized images: Is there a simple criterion?,” Proc. 3rd Conf.; Fusion Earth Data: Merging Point Meas., Raster Maps Remotely Sensed Images, Sophia Antipolis, France, Jan. 2000, pp. 99-105.
[38] L. Alparone, B. Aiazzi, S. Baronti, A. Garzelli, F. Nencini, and M. Selva, “Multispectral and panchromatic data fusion assessment without reference,” Photogramm. Eng. Remote Sens., vol. 74, no. 2, pp. 193–200, 2008.
[39] L. Wald, T. Ranchin, and M. Mangolini, “Fusion of satellite images of different spatial resolutions: assessing the quality of resulting images,” Photogramm. Eng. Remote Sens., vol. 63, no. 6, pp. 691– 699, 1997.
[40] Y. Zhang, and G. Hong, “An IHS and wavelet integrated approach to improve pan-sharpening visual quality of natural colour IKONOS and QuickBird images,” Inf. Fusion, vol. 6, no. 3, pp. 225–234, Sep. 2005. [41] Johnson B. Effects of Pansharpening on Vegetation Indices. ISPRS
![Fig. 3: Spectral Response of the WorldView-2 panchromatic and multispectral imager [2]](https://thumb-eu.123doks.com/thumbv2/123doknet/11506329.293911/3.892.80.430.824.1039/fig-spectral-response-worldview-panchromatic-multispectral-imager.webp)