Université de Montréal
La réponse du pérïphyton sur différents substrats au développement résidentiel des bassins versants des lacs des Laurentides
par Daniel Lambert
Département des sciences biologiques Faculté des arts et des sciences
Mémoire présenté à la Faculté des études supérieures en vue de l’obtention du grade de
Maîtrise ès sciences (M. Sc.) en sciences biologiques
t t
JAN
2007 Août2006)
© Daniel Lambert, 2006UNIVERSITÉ DE MONTRÉAL
D
Université
(I{
de Montréal
Direction des bibliothèques
AVIS
L’auteur a autorisé l’Université de Montréal à reproduire et diffuser, en totalité ou en partie, par quelque moyen que ce soit et sur quelque support que ce soit, et exclusivement à des fins non lucratives d’enseignement et de recherche, des copies de ce mémoire ou de cette thèse.
L’auteur et les coauteurs le cas échéant conservent la propriété du droit d’auteur et des droits moraux qui protègent ce document. Ni la thèse ou le mémoire, ni des extraits substantiels de ce document, ne doivent être imprimés ou autrement reproduits sans l’autorisation de l’auteur.
Afin de se conformer à la Loi canadienne sur la protection des renseignements personnels, quelques formulaires secondaires, coordonnées ou signatures intégrées au texte ont pu être enlevés de ce document. Bien que cela ait pu affecter la pagination, il n’y a aucun contenu manquant.
NOTICE
The author of this thesis or dissertation has granted a nonexclusive license allowing Université de Montréal to reptoduce and publish the document, in part or in whole, and in any format, solely for noncommercial educational and research purposes.
The author and co-authors if applicable retain copyright ownership and moral rights in this document. Neither the whole thesis or dissertation, nor substantial extracts from it, may be printed or otherwise reproduced without the author’s permission.
In compliance with the Canadian Privacy Act some supporting forms, contact information or signatures may have been removed from the document. While this may affect the document page count, it does flot represent any loss of content from the document.
Faculté des études supérieures
Ce mémoire intitulé:
La réponse du périphyton sur différents substrats au développement résidentiel des bassins versants des lacs des Laurentides
présenté par: Daniel Lambert
a été évalué par un jury composé des personnes suivantes:
Bernadette Pinel-Alloul prsident-mpporteur Antonella Cattaneo directeurde recherche Daniel Boisclair membredujury
111
RÉSUMÉ
L’eutrophisation des lacs est un problème qui ne cesse de grandir. Les modèles de gestion utilisés pour prévenir ce processus sont généralement basés sur les caractéristiques de la zone pélagique. De récentes études suggèrent que le périphyton pounait être le premier producteur primaire à répondre en début d’eutrophisation. L’objectif de l’étude était de trouver un outil efficace pouvant détecter les premiers symptômes de l’eutrophisation. Pour ce faire, le périphyton et le phytoplancton de 1$ lacs des Laurentides ayant un fort gradient de développement résidentiel ont été comparés. La biomasse et la composition stoichiométrique du périphyton étaient significativement reliées au degré de perturbation des bassins versants, alors que la biomasse du phytoplancton était principalement reliée aux concentrations de phosphore de la colonne d’eau. Les relations étaient meilleures lorsque seulement les perturbations près du lac étaient considérées. Ensuite, la réponse du périphyton au développement des bassins versants a été comparée pour les 4 substrats naturels (roches, sédiments, bois et macrophytes) présents dans les lacs de cette région et un substrat artificiel (bande de plastique) afin de trouver la communauté périphytique qui répondait la mieux à l’eutrophisation. La biomasse de périphyton sur les roches a montrée la plus forte variation entre les lacs de différents niveaux de perturbation. La mesure de la couche de périphyton sur les roches à l’aide d’une règle s’est avérée une méthode fiable pour l’estimation de la biomasse d’épilithon. Puisque cette méthode est simple et rapide, elle a été suggérée aux associations de lacs comme outil à utiliser pour la détection précoce de l’eutrophisation des lacs.
MoTs-cLÉ chlorophylle a, épïlithon, épipelon, épiphyton, épixylon, eutrophisation, stoichiométrie, zone littorale
iv
ABsTRAcT
Lake eutrophication is an increasing problem. b prevent that ftom happening, lake monitoring is mostly done in the pelagic zone. Recent studies suggest that periphyton couïd be the first primary producer to react to early eutrophïcation. The aim of this study was to find an effective tool to detect early eutropication symptoms. Periphyton and phytoplankton were compared in 18 lakes ofthe Laurentian region (Québec) along a gradient ofresidential development. Periphyton biomass as chlorophyli u and stoichiometric composition were significantly related to variables describing watershed development whereas phytoplankton biomass was significantly related with open water total phosphoms concentration. Periphyton-residential development relationships were tighter when considering the perturbation near the shore rather than over the entire watershed. To examine which periphytic community best indicates lakeshore residential development, periphyton response was compared on ail four natural substrata found in Laurentian lakes (rocks, sediments, submerged wood, and macrophytes) and on an artificial substratum (plastic strips). Periphyton biomass on rocks showed the largest variation among lakes with different degree of perturbation. Measurements of periphyton thickness on rocks with a ruler proved to be a reliable method for estimating periphyton biomass. Because this method is rapid and simple, it has been proposed to lakeside resident associations as a monitoring tool for early eutrophication detection.
KEY-tvoRnS: chlorophyli u, epilithon, epipelon, epiphyton, epixylon, eutrophication,
V
TABLE DES MATIÈREs
RÉSUMÉ iii
ABSTRACT iv
TABLE DES MATIÈRES y
LISTE DES TABLEAUX vii
LISTE DES FIGURES viii
LISTE DES SIGLES ET ABRÉVIATIONS x
REMERCIEMENTS xiii
CHAPITRE 1. INTRODUCTION GÉNÉRALE 1
EuTRoPHIsATIoN
DWFÉRENcE PHYToPLANcToN ET PÉRWHYTON 2
LACS DES LAuRENTIDEs 4
GEsTIoN 4
OBiECTW DE L’ÉTUDE 7
BLBU0GRAPHW 9
CHAPITRE 2. PERIPHYTON AS AN EARLY INDICATOR 0F
EUTROPHICATION IN RECREATIONAL LAKES 12
ABSTRACT 12
RÉsuMÉ 13
IKfR0DUCTION 14
MATERIALS AND METHODS 15
RESuLTS 18
DISCUSSION 25
CONCLUSION 27
ACKN0wLEDGEMENT5 28
REFERENCES 28
CHAPITRE 3. MONITORING PERIPHYTON DEVELOPMENT IN LAKES
AFFECTED BY INCIPIENT EUTROPifiCATION 33
ABSTRACT 33
RÉSUMÉ 34
INTRODUCTION 35
MATERJALs AND METH0Ds 36
RESULTS 38
DISCUSSION 39
AcKNOwLEDGEMENTs 44
REFERENCES 44
ACCORD DES COAUTEURS 48
CONCLUSIONS GÉNÉRALES 49
ANNEXES 52
ANNEXE L LACS ET STATIONS 52
vii
LISTE DES TABLEAUX
CHAPrrRE2. Periphyton as an early indicator of eutrophication in recreational lakes
TABLE I. The range (mean) in watershed and lake characteristics observed in the 1 8 lakes studied in the Laurentian region of Quebec. Chemical variables are the mean values of 4 samplings in summer 2004 16
TABLE II. Correlation coefficients between epilithon and epipeÏon biomass (Chi a) and 2 descriptors of watershed development measured in various strips of increasing width and in the entire drainage area (DA). n = 13 in 2003 and n =
1$ in 2004. , ** and represent respectively significant correlation at thep
=O.O5,p=O.Ol andp=0.001 level 21
TABLE ifi. Con-elation coefficients between periphyton nutrient molar ratios and
periphyton biomass (as Chi a) where n = 13. , ** and represent
respectively significant correlation at the p 0.05,p = 0.01 andp 0.001
level 21
CHAPITRE 3. Monitoring periphyton development in lakes affected by incipient eutrophication
TABLE I. The range (mean) in watershed and lake characteristics observed in the 1$ lakes studied in the Laurentian region of Quebec. Chemical variables are the mean values of 4 samplings in summer 2004 (Lambert, Chapter 2) 36
viii
LISTE DES FIGURES
CHAPITRE 2. Periphyton as an early indicator of perturbation during the development of
recreational lakes
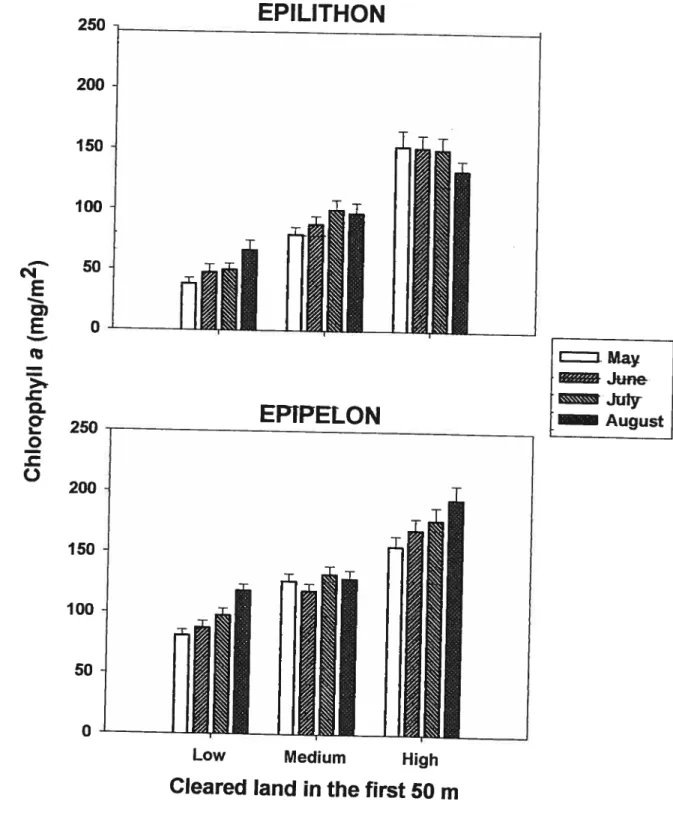
FIGURE 1. Seasonal changes in epilithon (a) and epipelon (b) biomass (Clii a) observed in 2004 in lakes of the Laurentian region grouped according to the degree of clearing in a 50 m strip around the lakeshore (10w < 15%, medium
15 — 35 %, high > 35%). Bars represent the mean with standard error
(n=6) 20
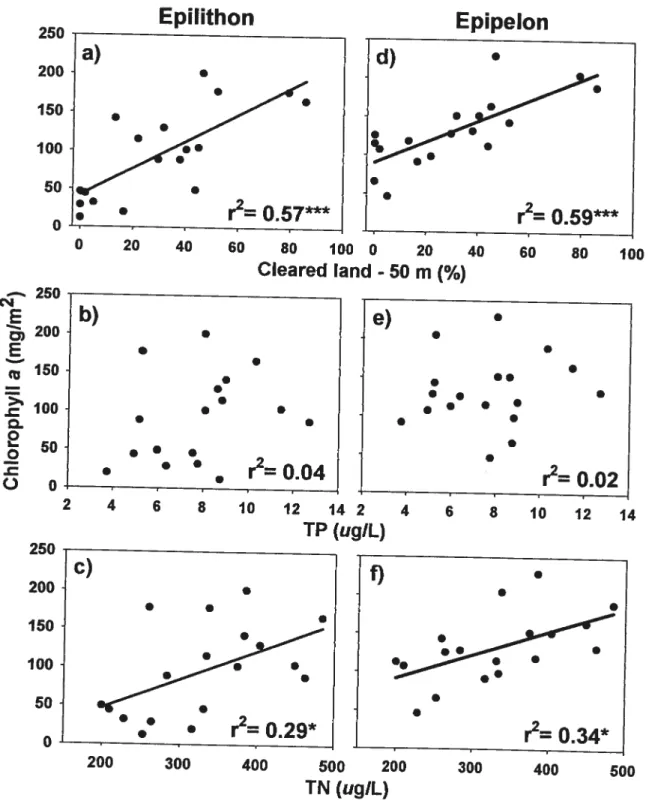
FIGURE 2. Reiationships of epilithon and epipelon biomass (Chi a) with percentage ofcieared land inside a 50 m wide strip around the lake (CL; a, d), open water
total phosphorus (TP; b, e), and total nitrogen (TN; c, f). r2 are presented for
ail relationships where n = 18 (* p < 0.05, ** p < 0.01, p < 0.001).
Regression unes are shown only for the significant relationships: a) Chlepiliffion 42.5 + 1.74 CL; c) Ch1epi]ith = 0.37 TN — 27.3; d) Chlepipeion= 90.5 + 1.35
CL; f) Chlepipeion 0.31 TN 29.5 22
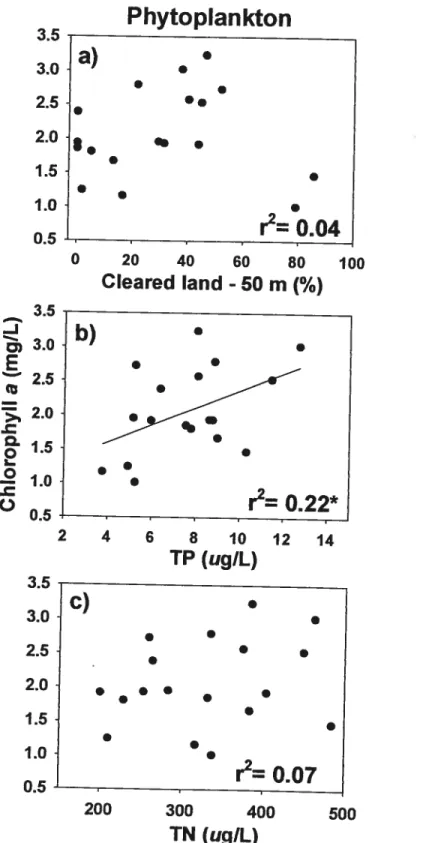
FIGuRE 3. Relationships of phytoplankton biomass (Chl a) with percentage of cleared land inside a 50 m wide strip around the lake (CL; a), open water total phosphoms (TP; b), and total nitrogen (TN; c).
r2
are presented for all relationships where n = 18 (* p < 0.05, ** p < 0.01, p < 0.001).Regression une is shown only for the significant relationship: b) Chlphtop1a*ton
=1.09+0.13TP 23
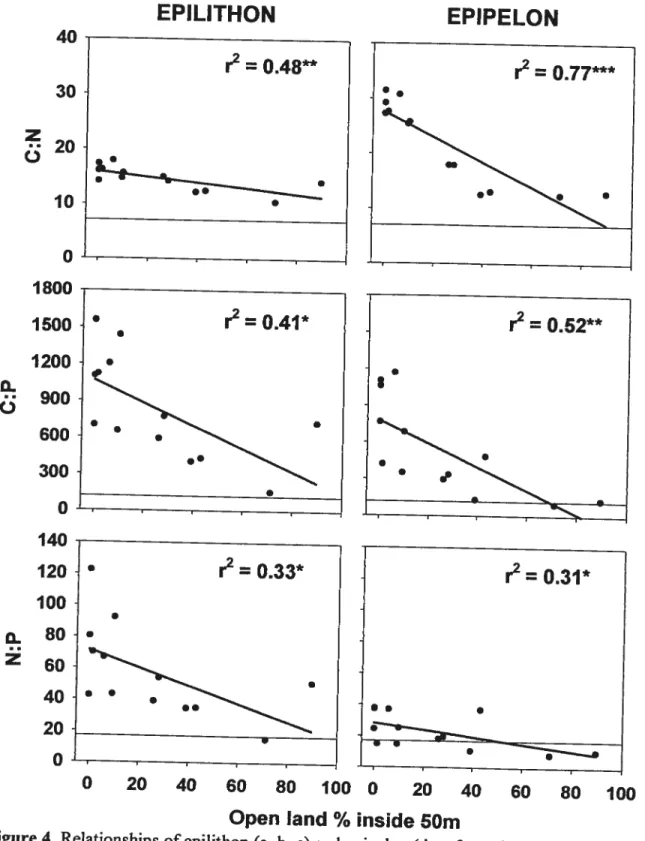
Figure 4. Relationships of epilithon (a, b, c) and epipelon (d, e,
f)
nutrient molarratios and the percentage of cleared land inside a 50 m wide strip around the lake. Regression unes and r2 are presented for ail relationships where n= 13 (*
p <0.05, ** p < 0.01, ‘‘
p < 0.001). Lakes over dash lines are considered N
limited (a, d) or P limited (b, c, e,
f)
according to optimal periphyton stoichiometric ratios (C:N:P = 119 17 1) proposed by Hillebrand &ix
CHAPrn 3. Monitoring periphyton deveiopment in lakes affected by incipient
eutrophication
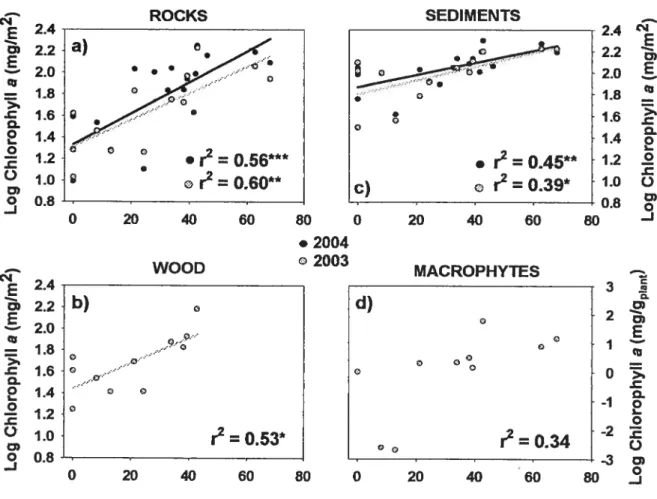
FIGuRE 1. Relationships ofepilithon ta: fl2003 = 13, fl2004= 18), epixylon (b: n= 11),
epipelon (c: fl2003 = 13, fl20o4 = 1$) and epiphyton (d: n = 10) biomass
(chlorophyli a) with percentage of cleared land inside a 50 m wide riparian strip. r2 are presented for ail relatïonships (* p <0.05, ** p <0.01, “‘
p <
0.001). Regression unes are shown only for the significant relationships:a)
LogCh1EI1fJ.OOO3 = 0.012 ArcsinCL%50m+ 1.316; a) LogChlElI0oQ4 =
0.014 ArCSiflCL%50m+ 1.333 b) LogCMEpxy1on = 0.012 A1CSflCL%5om +
1.442; c) LogChlEpipeIooo3 = 0.006 ArcsinCL%5om + 1.803; e)
LogChlii0oo4 0.006 ASCSflCL%5Om+ 1.869 40
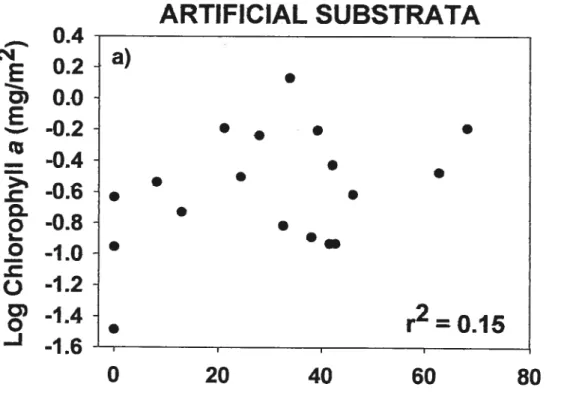
FIGuRE 2. Relationships of artificial substrata biomass (CM a) (a) and periphyton
thickness (b) with percentage ofcleared land inside a 50 m wide riparian strip. are presented for ail relationships where n = 18 (* p <0.05, ** p< 0.01, “‘
p < 0.001). Regression une is shown only for the significant relationship: b)
Thickness= 0.04 1 ArcsinCL%50m+ 2.374 41
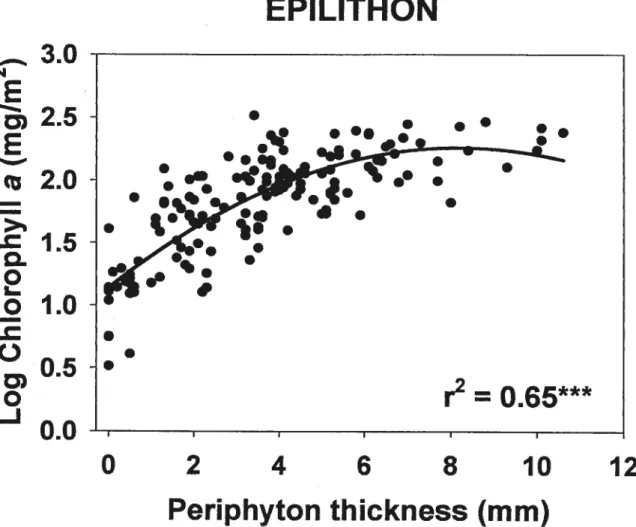
FIGuRE 3. Relationship between two different methods of estimating epilithon biomass: (Chi a) and periphyton thickness (T). r2 (*** p < 0.001, n 160) and
LISTE DES SIGLES ET ABRÉVIATIONS
AFDM Masse sèche sans cendre / Ash ftee dry mass Arcsin Transformation arcsinus / Arcsine transformation
C Carbone / Carbon
Chi a Chlorophylle a / Chlorophyll a CL Aire ouverte / Cleared land cm Centimètre / Centimeter
cm2 Centimètre carré / Square centimeter COD Carbone organique dissous
C:N:P Ratio stoichiométrique carbone: azote : phophore / Carbone : nitrogen: phosphorus stoichiometric ratio C:N Ratio stoichiométrique carbone: azote /
Carbon: nitrogen stoichiometric ratio
C:P Ratio stoichiométrique carbone : phosphore /
Carbon: phosphorus stoichiometric ratio °
Degré/Degree
°C Degré Celsius / Celsius degree
DA Aire du bassin versant / Drainage area DOC Dissolved organic carbon
Dwelling/km Densité d’habitation par kilomètre de rive / Dwelling density per kilo meter of shore Dwelling/km2 Densité d’habitation par kilomètre carré I
Dwelling density per square kilometer
e. g. Par exemple / For example et al. Et autres / And others
Fig. Figure
FQRNT Fonds québécois national de la recherche sur la nature et les technologies
g Gramme I Gram
h Heure I Hour
xi
km KilomètreIKilometer
km2 Kilomètre carréI Square kilometer
Log Transformation logarithmique en base 10 / Logarithmic with base 10 transformation
m Mètre / Meter
m3 1 1 000 mètre cube / 1 000 cubic meters
mg Milligramme / Milligram
mg/gp]t Milligramme par gramme de plante sèche / Milligrams per gram of dry mass of plant mgfL Milligramme par litre I Milligrams per liter
mg/m2 Milligramme par mètre carréIMilligrams per square meter
ml Millilitre / Milliliter
mm Millimètre / Millimeter
min Minute
Moy Moyenne
n Effectif! Sample size
N Azote /Nnitrogen
nm Nanomètre I Nanometer
NO3 Nitrate
N:P Ratio stoichiométrique azote: phosphore / Nitrogen : phosphorus stoichiometric ratio
NSERC Natural Sciences and Engineering Research Council of Canada
NT Azote totale
p Coefficient de probabilité / Probability coefficient
p. Page
pp. Pages
P Phosphore / Phosphorus
PT Phosphore total
PTD Phosphore total dissous
PVC Chlorure de polyvinyleIPolyvinyl chloride
% PourcentageIPercentage
r Coefficient de corrélation / Correlation coefficient
xii SBL Station de biologie des Laurentides de l’Université de Montréal T Épaisseur de périphyton I Periphyton thickness
Tab. TableauITable
TDP Total dissolved phosphorus
TN Total nitrogen
TP Total phosphorus
IN 1 molaireI I normal concentration MicromètreIMicrometer
pg/L Microgramme par litreIMicrograms per liter
vs ContreJVersus
wk Week
Z ProfondeurIDepth
xli’
REMERCIEMENTS
Merci beaucoup à
• Antonella Cattaneo pour tout les judicieux conseils et les bons moments
• Jennifer Boisvert, Ariane Bouffard, Andréane Lauzé et Patrick Saumure pour votre grande aide sur le terrain et pour tous les bons souvenirs
• Malorie Gélinas pour les données de physico-chimie de 2003
• Cathy Crago et MïreilÏe Hughes pour les analyses chimiques et votre précieuse aide • Marc Gélinas pour l’aide avec les variables des bassins versants
• Richard Carignan et Bernadette Pinel-Mloul pour les conseils
•
Éric
Valiquette et tout le personnel de la SBL pour votre hospitalité et les données météorologiquesCHAPITRE
1:
INTRODUCTION GENERALE
Eutrophisation
Les problèmes écologiques comme le réchauffement planétaire préoccupent beaucoup les gens en ce début du21esiècle. Un de ces problèmes répandu à l’échelle de la planète est l’eutrophisation des plans d’eau. L’eutrophisation se définit comme un enrichissement en nutriments tel le phosphore qui engendre une prolifération des algues et macrophytes. Ces changements induisent ultérieurement une modification des communautés d’invertébrés et de poissons. Bien que l’eutrophisation puisse être de cause naturelle, l’homme en est généralement responsable en transformant les zones forestières des bassins versants en zones agricoles, urbaines ou récréatives. En transformant les bassins versants à son avantage, il modifie l’état trophique des plans d’eau qui deviennent souvent inaptes aux activités récréatives, à songrand désarroi.
C’est surtout depuis le début des années 1960 que le processus a pris de l’ampleur, provoquée par les apports en substances fertilisantes (spécialement le phosphore) provenant des eaux usées municipales et industrielles, ainsi que des eaux de ruissellements agricoles ou urbaines (OCDE, 1982). Comme le phosphore est généralement un élément limitant la croissance des algues, son augmentation dans l’eau stimule la croissance des producteurs primaires (Schindier, 1974; Dodds, 2002). En zone pélagique, il peut y avoir une diminution de la transparence de l’eau due à l’augmentation du phytoplancton, une augmentation de la fréquence des fleurs d’eaux et certains épisodes de baisse critique de concentrations d’oxygène en zone profonde. Les principaux changements en zone riveraine sont la prolifération des macrophytes et l’augmentation des algues qui se développent sur les substrats (périphyton). Ces modifications des lacs peuvent rendre désagréables certaines activités récréatives comme la baignade. L’augmentation des producteurs primaires engendre généralement une hausse d’invertébrés aquatiques et donc également du nombre de poissons. Même si cela semble être avantageux pour les pêcheurs, un changement dans les communautés de poissons survient généralement après quelques temps, et il y a souvent diminution de la croissance de l’ensemble des poissons (Schindier et al., 2000).
2 Il serait normal de s’attendre à une dégradation graduelle des conditions d’un lac qui
subit une hausse constante des apports en nutriments venant du bassin versant. En réalité, ce n’est pas ce qui se produit. Une hausse des apports de nutriments ne se traduit pas par des changements aussi marqués dans la productivité des producteurs primaires tors des premiers stades de l’eutrophisation. Les réels effets de l’eutrophisation peuvent survenir subitement et un lac peut perdre d’une année à l’autre sa transparence et subséquemment sa végétation riveraine (Scheffer et al., 2001). Un tel changement drastique survient lorsqu’un lac a épuisé ses capacités de résistance à l’augmentation des nutriments qui ont dépassé un seuil critique. Jusqu’à l’atteinte de ce seuil, l’augmentation des nutriments n’affecte pas trop les conditions du lac. Lorsque ce seuil critique est dépassé, le lac est dans un nouvel état presque irréversible et la restauration du plan d’eau est très difficile. Des expériences ont démontré que la récupération des lacs n’est pas toujours possible en réduisant simplement les concentrations des nutriments au niveau précédant le changement catastrophique, mais qu’ils doivent être bien en deçà de ce qu’ils étaient. De plus, les effets bénéfiques peuvent prendre beaucoup plus de 15 ans avant de se faire sentir (Jeppesen et al., 1991; Carpenter et al., 1999). Parfois, le seul moyen de revenir à l’état précédent est par biomanipulation, c’est-à-dire la manipulation d’un niveau de la chaîne alimentaire comme par l’introduction d’herbivores, ce qui peut s’avérer compliqué, ou par des traitements au sulfate d’aluminium et d’oxygénation, qui peuvent être très coûteux et qui ne garantissent rien non plus. Comme la restauration des lacs est très difficile et que leur détérioration n’est pas graduelle, il est nécessaire d’être capable de détecter les premiers symptômes de l’eutrophisation afin de régler le problème avant qu’il soit déjà trop tard.
Différence Phytoplancton et Périphyton
Pour prévenir l’eutrophisation, une bonne gestion de l’eau couplée à la capacité de minimiser les apports en nutriments est primordiale. Pour réussir une gestion de l’eau efficace, il faut d’abord être équipé des bons outils. Jusqu’à la dernière décennie, les modèles de gestion d’eutrophisation des lacs étaient principalement conçus pour la zone pélagique, malgré une forte proportion de lacs petits et peu profonds aux zones littorales très importantes (Vadeboncoeur et aL, 2002). Ceci est du au développement de ces modèles qui c’est surtout fait vers la fin des années 1960 et début des années 1970 en considérant principalement la relation entre le phosphore et le phytoplancton dans les lacs
3 d’origine glaciaire et sur assise granitique du bouclier canadien ayant un bon couvert forestier sur leur bassin versant (Dillon et Rigler, 1974 ; Harper, 1992).
Le phytoplancton est composé d’algues principalement unicellulaires en suspension dans la colonne d’eau. Les algues qui se développent sur le substrat en zone littorale avec d’autres micro-organismes constituent le périphyton. Les modèles basés sur le phytoplancton ne sont pas applicables au périphyton puisque même si ces deux communautés sont composées principalement d’algues, elles n’occupent pas le même habitat dans un lac et ne profitent pas des mêmes sources de nutriments. Il y a cependant un intérêt grandissant depuis le début des années 1990 pour l’usage des algues benthiques comme indicateur de l’eutrophisation des lacs. Cette nouvelle approche découle d’études qui ont proposé que la production et la biomasse du périphyton pouvaient réagir avant celles du phytoplancton à une augmentation des nutriments dans un lac (Sand-Jensen & Borum, 1991; Brônmark & Hansson, 1998; Vadebonceour et al., 2002; Liboriussen & Jeppesen, 2003). L’utilisation du périphyton à des fins de gestion de l’eutrophisation n’est toujours pas très répandue, car les tentatives de relier le périphyton aux nutriments de la colonne d’eau ont généralement échoué (Cattaneo, 1987; Kahlert & Petersson, 2002). Il est connu que certaines caractéristiques des bassins versant peuvent prédire la chlorophylle du phytoplancton aussi bien que la chimie de l’eau (Duarte & Kalff 1989; D’Arcy & Carignan, 1997). Dans ce sens, possiblement que des caractéristiques du bassin versant pourrait également contrôler la biomasse du périphyton en zone littorale. Les feux de forêts et les coupes forestières dans les bassins versants affectent le périphyton plus que le phytoplancton dans les lacs du Québec (Planas et al., 2000).
La réponse du périphyton dans la zone littorale à l’eutrophisation n’est pas toujours aussi claire que celle du phytoplancton de la zone pélagique, mais l’idée que dans les premières phases de l’eutrophisation le périphyton puisse augmenter en biomasse avant même le phytoplancton est très intéressante et pourrait mener à une nouvelle façon de détecter l’eutrophisation dans les lacs.
Le périphyton recouvre tout le substrat et il est le premier producteur primaire à avoir accès aux nutriments qui proviennent de l’écoulement de surface et souterrain. Cela expliquerait pourquoi le périphyton pourrait réagir à l’eutrophisation avant le phytoplancton
4
et qu’il ne soit pas bien relié aux nutriments de la colonne d’eau. Le périphyton peut également accumuler sa biomasse avec le temps, ce qui est plus difficile dans le cas du phytoplancton qui peut sédimenter et être évacûé régulièrement. Une augmentation légère et persistante des nutriments pourrait donc avantager la biomasse de périphyton.
Lacs des Laurentides
La région des Laurentides abonde de petits lacs ayant une zone littorale importante, avec près de 10 000 lacs à l’intérieur d’un territoire d’un peu plus de 20 0000 km2. Le développement résidentiel est en hausse dans les bassins versants de ces lacs. La population des Laurentides a augmentée de 72 % entre 1971 et 1996 (Laurin, 2000). De plus, un nouveau mode de développement socio-économique a lieu depuis quelques années, c’est ta “villégiaturisation”. Ce phénomène, causé principalement par le passage à la retraite des “baby-boomers”, se définit comme un développement urbain conciliant les fonctions résidentielles et de loisirs sur une base permanente, ce qui se traduit en une transformation des chalets en résidence permanente utilisée toute l’année (Laurin, 2000).
La “villégiaturisation’ est généralement caractérisépar un développement important
des rives des lacs qui laisse le reste des bassins versants souvent intact. Les conséquences de ce développement sont principalement le déboisement des rives des lacs pour permettre la construction de résidences et l’aménagement de terrains. Des terrains de golfs ainsi que des pistes de skis peuvent également se retrouver dans les bassins versants. Malgré ce phénomène, il persiste encore des lacs avec des bassins versants inhabités et peu de lacs sont dans un état d’eutrophisation avancé dans les Laurentides. Cependant, beaucoup de riverains se plaignent de changements dans leur lac, plus spécialement de prolifération d’algues et macrophytes et parfois de diminution de la transparence de l’eau. Bon nombre de ces riverains ont à coeur la condition de leur lac et sont près à faire des efforts pour contrer l’eutrophisation. C’est pourquoi il est primordial de leur procurer des outils efficaces pour la gestion et le contrôle de leur lac.
Gestion
La majorité des outils pour la gestion des lacs sont basés sur les coùditions de l’eau
en zone pélagique. il est souvent proposé aux riverains de faire des mesures de la
5
sont analysés afin de connaître principalement la concentration en phosphore totale (PT) et la biomasse de phytoplancton. Ces mesures ne sont possiblement pas les meilleures qui puissent être faites dans les lacs des Laurentides afin de prévenir l’eutrophisation. Même
s’il peut y avoir de grande différence de développement résidentiel dans un bassin versant
d’un lac à un autre, les différences des caractéristiques de la colonne d’eau ne sont pas aussi marquées (Richard Carignan, communication personnelle). C’est pourquoi il faut trouver un autre outil pour la gestion des lacs. Comme il n’est pas rare d’entendre des témoignages de riverains qui prétendrent avoir observé une augmentation des algues de la zone littorale, le périphyton pourrait possiblement être un excellent indicateur précoce de l’eutrophisation de ces lacs.
Pour que le périphyton puisse être utilisé efficacement, il faut savoir sur quel substrat l’échantillonner. Quatre substrats naturels sont généralement retrouvés dans les lacs des Laurentides; les roches, les sédiments, le bois et les macrophytes. Chaque substrat supporte sa propre communauté de périphyton qui se nomme épilithon (roches), épipelon (sédiments), épixylon (bois) et épiphyton (macrophytes). Ces substrats présentent des différences marquées dans leur capacité de soutien de communautés d’algues benthiques, spécialement au niveau de leur stabilité et de leur position dans la colonne d’eau. Les roches ne sont pas une source de nutriments pour lépilithon (Burkholder, 1996), mais procurent à celui-ci un substrat beaucoup plus stable que ne peuvent l’être les sédiments ou les macrophytes (Vadeboncoeur & Lodge, 2000). Le bois est également un substrat stable pour
le périphyton et pourrait possiblement être une source de nutriments (Sinsabaugh et al.,
1991; Couch & Meyer, 1992; Scholz & Boon, 1993). Les macrophytes n’offrent pas un support stable à l’épiphyton, mais ils peuvent constituer une source non négligeable de nutriments pour les algues épiphytiques, en plus d’offrir de meilleures conditions d’illumination vue leur position dans la colonne d’eau (Burkholder & Wetzel, 1990; Kahiert & Petterson, 2002). Cependant, d’autres études n’ont démontré aucune relation métabolique entre l’épiphyton et les macrophytes (Cattaneo & Kalfl 1979; Stevenson, 198$). Les sédiments sont les plus instables des substrats, surtout ceux en zone peu profonde susceptibles d’être brassés par les vagues. Par contre, l’épipelon peut emmagasiner les nutriments qui se retrouvent dans les sédiments qui peuvent être une source majeure de phosphore (Carlton & Wetzel, 198$; Hansson, 1989; Hagerthey & Keffoot, 1998). Il est possible que le périphyton croissant sur des substrats inertes comme les roches, mais se
6 trouvant près des sédiments, puisse profiter des nutriments s’échappant des sédiments (Blumenshine et al., 1997).
Le périphyton peut également croître sur une multitude de substrats artificiels. Les substrats artificiels sont utilisés afin d’uniformiser les surfaces d’échantillonnage ou de faciliter la récolte des échantillons. Plusieurs types peuvent être confectionnés pour échantillonner le périphyton. Certains peuvent diffuser des nutriments alors que d’autres sont totalement inertes. Les matériaux inertes utilisés le plus couramment sont le verre, le plastique, les pierres et les tuiles (Cattaneo & Amireault, 1992).
Plusieurs méthodes sont disponibles afin d’étudier les réponses du périphyton. L’analyse de la biomasse de périphyton à l’aide de la quantité de chlorophylle a (Chi a) est une méthode très utilisée pour le périphyton ainsi que pour le phytoplancton. Cette technique est simple et permet l’analyse d’une grande quantité d’échantillons en un temps et avec un coût raisonnable. Il faut cependant être prudent dans l’interprétation des résultats obtenus à l’aide de cette méthode, car la concentration de Chi ci dans les algues peut varier, principalement lorsque des habitats très différents sont comparés (Lowe & Pan, 1996). Les espèces d’algues n’ont pas toutes les mêmes concentrations en ChI ci qui peuvent en plus
varier selon le niveau d’ensoleillement ou des concentrations en nutriments. L’analyse de la masse sèche sans cendre (AFDM) peut également être utile pour déterminer la biomasse du périphyton. Par contre, elle peut facilement être biaisée par de la matière organique autre que celle des algues (Stevenson, 1996). La mesure de la respirationlproduction du périphyton peut aussi être utilisée afin de connaître l’importance du périphyton comme producteur primaire dans les lacs. L’analyse taxonomique et le dénombrement des algues peuvent permettre d’étudier les changements dans les communautés algales. Cette méthode requiert cependant un certain niveau d’expertise et est plutôt longue. Finalement, la composition stoechiométrique, le rapport de la composition en carbone (C), azote (N) et phosphore (P), est une technique qui permet de regarder l’effet des perturbations sur la composition chimique des algues benthiques. Les variations du ratio C:N:P sur des cultures d’algues en laboratoire reflètent bien les réponses physiologiques des autotrophes aux conditions de croissance, comme la disponibilité des nutriments (Frost & Elser, 2002). Il est donc possible que ce phénomène soit observé en milieu naturel. En plus de ces techniques, il existe des méthodes pour évaluer le développement du périphyton très
7 rapides et peu coûteuses comme le toucher des roches ou la mesure de l’épaisseur de la couche de périphyton qui on été proposées pour l’évaluation des cours d’eau (Barbour et al., 1999).
Objectif de l’étude
L’objectif principal de cette étude était de vérifier si le périphyton peut être un bon indicateur précoce de l’eutrophisation des lacs afin de pouvoir en faire un outil pour la gestion des lacs des Laurentides. Pour cela, l’étude a étédivisée en deux chapitres. Au total, 1$ lacs reflétant bien le gradient de développement résidentiel des bassins versants des lacs des Laurentides ont été échantillonnés au cours des étés de 2003 et 2004.
Au Chapitre 2, la biomasse du périphyton (épilithon et épipelon) et du phytoplancton a été mesurée dans plusieurs lacs représentant un gradient de développement, le but étant de voir si ces deux communautés algales répondaient bien au développement résidentiel du bassin versant. Il était attendu que le phytoplancton réponde mieux aux caractéristiques chimiques de la colonne d’eau et que le périphyton soit le plus influencé par le degré de développement des bassins versants. L’analyse de la biomasse de périphyton par la ChI a a été la principale méthode utilisée afin de caractériser les algues benthiques. C’est une technique très utilisée qui est suffisamment simple et peu coûteuse pour permettre la prise d’un très grand nombre d’échantillons, ce qui est nécessaire compte tenu de la forte variabilité spatiale du périphyton. En complément à la biomasse chlorophyllienne, des analyses de la composition stoechiométrique des différentes communautés de périphyton ont été réalisées. Les biomasses chlorophylliennes du périphyton et du phytoplancton en plus de la stoichiométrie du périphyton ont été mises en relation avec les caractéristiques chimiques (PT, PTD, NT, NO3, COD, profondeur du disque de Secchi) et physiques des lacs (volume, aire du lac, profondeur maximum, profondeur moyenne) ainsi que les caractéristiques des bassins versants (aire du bassin versant, pente moyenne, densité d’habitations, % zones ouvertes, % zones forestières, % zones humides) afin de modéliser le développement du périphyton et du phytoplancton. Comme ce sont principalement les rives des lacs qui sont développées, les variables de perturbations des bassins versants (densité d’habitations, % zones ouvertes, % zones forestières, % zones humides) ont été calculées pour différentes tailles de bandes riveraines (50, 100, 250, 500 et 1000 m) ainsi que pour l’ensemble du bassin versant.
$ Dans le Chapitre 3, différentes techniques d’échantillonnage du périphyton ont été comparées dans le but de trouver le meilleur substrat à échantillonner et possiblement un outil rapide et efficace pouvant être utilisé par les riverains pour la gestion de leurs lac. Il était attendu que les substrats qui ne sont pas des sources de nutriments soient de bons substrats à échantillonner puisqu’ils peuvent supporter de faibles biomasses de périphyton dans certain cas et des fortes dans d’autres. Les analyses traditionnelles de biomasse de Chi
u ont été effectuées sur les 4 substrats naturels (roches, sédiments, bois et macrophytes), en plus d’un substrat artificiel (bande de plastique). Ces résultats ont été comparés à une technique plus simple, la mesure de l’épaisseur de l’épilithon avec une règle. Enfin, toutes les techniques ont été mises en relation avec le pourcentage de zone ouverte dans les premiers 50 m du bassin versant afin de déterminer laquelle reflétait la mieux les perturbations des bassins versants.
9
BIBLIOGRAPHIE
Barbour, M. T., J. Gerritsen, B. D. Snyder, & J. B. Stribling. 1999. Rapid bioassessment protocols for use in streams and wadeable rivers: periphyton, bernhic macroinvertebrates and fish, Second Edition. EPA 841-B-99-002. U.S. Environmental Protection Agency; Office ofWater; Washington, D.C.
Blumenshine, S. C., Y. Vadeboncoeur, D. M. Lodge, K. L. Cottingham & S. E. Knight.
1997. Benthic-Pelagic links: response of benthos to water-column nutrient
enrichment. Journal ofthe North American Benthotogicat Society, 16 (3), pp. 466-479.
Brônmark, C. & L.-A. Hansson. 1998. The bioÏogy of lakes and ponds. Oxford University press, Oxford, 216 p.
Burkholder, J. M. 1996. Interactions ofbenthic algae with their substrata. Dans: Stevenson,
R. J., M. L. Bothwell & R L. Lowe (Eds.). Aigal ecology: Freshwater benthic
ecosystems. Academic Press, San Diego, pp. 253-297.
Burkholder, J. M. & R. G. Wetzel. 1990. Epiphytïc aikaline phosphatase on natural and artificial plants in an oligotrophic lake: Re-evaluation ofthe role ofmacrophytes as
a phosphorus source for epiphytes. Limnology and Oceanography, 35 (3), pp.
736-747.
Canton, R. G. & R. G. Wetzel. 1988. Phosphoms flux from lake sediments: Effect of epipelic algal oxygen production. Linmology w7dOceangraphy. 33 (4), pp. 562-570. Carpenter, S. R., D. Ludwig & W. A. Brock. 1999. Management ofeutrophication for lakes subject to potentially irreversible change. Ecotogical Applications, 9 (3), pp. 751-771. Cattaneo, A. 1987. Peniphyton in lakes of different trophy. anadian Journal 0f fisheries
andAquatic Sciences, 44, pp. 296-303.
Caffaneo, A. & M. C. Amireault. 1992. How artificial are artificial substrata for periphyton? Journal of the North American Benthologicat Society, 11 (2), pp. 244-256.
Cattaneo, A. & J. Kalif. 1979. Primary production ofalgae growing on natural and artificial aquatic plants: A study of interactions between epiphytes and their substrate. Limnology and Oceanography, 24 (6), pp. 1031-1037.
Couch, C. A. & J. L. Meyer. 1992. Development and composition ofthe epixilic biofiim in
10
D’Arcy, P. & R. Carignan. 1997. Influence of catchment topography on water chemistry in southeastern Québec Shield lakes. Canadian Journal of Fisheries and Aquatic Sciences, 54, pp. 2215-2227.
Dillon1 P. J. & F. H. Rigler. 1974. A test ofa simple nutrient budget model predicting the
phosphoms concentrations in lake water. Journal of the Fisheries Research Board of
Canada, 31 (14), pp. 1771—1778.
Dodds, W. K. 2002. Freshwater ecology: concepts and environmental applications. Academic Press, San Diego, 569 p.
Duarte, C. M. & J. Kalif 1989. The influence of catchment geology and lake depht on
phytoplankton biomass. Archivfiir Hydrobiologia, 115 (1), pp. 27-40.
Frost, P. C. & J. J. Elser. 2002. Effects of light and nutrient on the net accumulation and elemental composition ofepilithon in boreal lakes. freshwater Biology 47: 173-183. Hagerthey, S. E. & W. C. Kerfoot. 1998. Groundwater flow influences the biomass and
nutrient ratios of epibenthic algae in a north temperate seepage lake. LimnoÏogy and Oceanography, 43 (6), pp. 1227-1242.
Hansson, L.-A. 1989. The influence of a periphytic biolayer on phosphoms exchange between substrate and water. Archivfitr Hydrobiotogia, 115 (1), pp. 2 1-26.
Harper, D. 1992. Eutrophication offteshwaters. Chapman &Hall, London, 327 p.
Jeppesen, E., P. Kristensen, J. P. Jensen, M. Sondergaard, E. Mortensen & T. Lauridsen. 1991. Recovery resilience following a reduction in extemal phosphorus loading of shallow Danish lakes: duration, regulating factors and methods for overcoming resilience. Memorie dell ‘Instituto di Idrobiologia, 4$, pp. 127-148.
Kahlert, M. & K. Petterson. 2002. The impact of substrate and lake trophy on the biomass and nutrie status ofbenthic algae. Hydrobiotogia, 4$9, pp. 161-169.
Laurin, Serge. 2000. Les Laurentides. Les éditions de PIQRC, Saint-Nicolas (Québec), 190
p.
Liboriussen, L. & E. Jeppesen. 2003. Temporal dynamics in epipelic, pelagic and epiphytic algal production in a clear and a turbid shallow lake. Freshwater BioÏogy, 4$, pp. 418-431.
Lowe, R. L. & Y. Pan. 1996. Benthic algal communities as biological monitors. Dans: Stevenson, R. Jan., Max. L. Bothwell et Rex. L. Lowe (Eds.). Mgal ecology: Freshwater benthic ecosystems. Academic Press, San Diego, pp. 705-739.
11
Organisation de Coopération et de Développement Économiques (OCDE). 1982. Eutrophisation des eaux. méthodes de surveillances, d ‘évaluation et de lutte. OCDE, Paris, 165 p.
Planas, D., M. Desrosiers, S.-R. Grouix, S. Paquet & R. Carîgnan. 2000. Pelagic and benthic algal responses in eastern Canadian Boreal Shield lakes following harvesting and wildfires. Canadian Joztrnal ofFisheries andAquatic Sciences, 57 (Suppl. 2), pp. 136-145.
Sand-Jensen, K. & J. Bomm. 1991. Interactions among phytoplankton, periphyton, and macrophytes in temperate freshwaters and estuaries. Aquatic Botanty, 41, pp.
137-175.
Scheffer, M., S. Carpenter, J. A. Foley, C. Foikes & B. Walker. 2001. Catastrophic shiifs in ecosystems. Nature, 413, pp. 59 1-596.
Schindler, D. E., S. I. Geib & M. R. Williams. 2000. Patterns of fish growth along a residential development gradient in north temperate lakes. Ecosystems, 3, pp. 229-237.
Schindier, D. W. 1974. Eutrophication and recovery in experimental lakes : implications for lake management. Science, 184, pp. $97-899.
Schoiz, O. & P. I. Boon. 1993. Biofiim development and extracellular enzyme activities on wood in billabongs ofsouth-eastern Australia. Freswater Biology, 30, pp. 359-368. Sinsabaugh, R. L., S. W. Golladay & A. E. Linkins. 1991. Comparison of epilithic and
epixilic biofiim development in a boreal river. freshwater biology, 25, pp. 179-197. Stevenson, J. C. 198$. Comparative ecology of submersed grass beds in freshwater,
estuarine, and environments. Limnology and Oceanography, 33 (4), pp. 867-893. Stevenson, R. J. 1996. An introduction to algal ecology in freshwater benthic habitats.
Dans: Stevenson, R. Jan., M. L. Bothwell et R. L. Lowe (Eds.). Mgal ecology: Freshwater benthic ecosystems. Academic Press, San Diego, pp. 3-3 0.
Vadeboncoeur, Y. & D. M. Lodge. 2000. Periphyton production on wood and sediment: substratum-specific response to laboratoiy and whole-lake nutrient manipulations.
Journal of the North American Benthological Society, 19 (1), pp. 68-$1.
Vadeboncoeur, Y., M. J. Vander Zanden & D. M. Lodge. 2002. Putting the lake back together: reintagrating benthic pathways into lake food web models. BioScience, 52
CHAPITRE
2:
PERIPHYT0N AS AN EARLY INDICATOR 0F EUTROPHICATION IN RECREATIONAL
V LAKES
Daniel Lambert, Antonella Cattaneo, and Richard Carignan
GRIL, Département de sciences biologiques, Université de Montréal, C. P. 6128, succ. Centre Ville, Montréal, Québec, Canada H3C 3J7
ABSTRACT
We looked for the existence of empirical relationships between periphyton biomass and residential development in the Laurentian lakes ofQuebec (Canada). We compared the response of periphyton (as chlorophyli a) on rocks and sediments to that of phytoplankton, the most commonly used target variable in eutrophication studies. Epilithon and epipelon biomass increased significantly with residential development (as percentage of cleared land in a 50m riparian strip) but was not related with open water phosphorus concentration. In contrast, phytoplankton was related to open water phosphorus but did not increase along the gradient of lake development. Periphyton stoichiometric composition also changed with increasing residential development. High C:P and C:N ratios were found in pristine lakes, suggesting high nutrient limitation. In the most developed lakes, periphyton molar ratios were approaching the optimal stoichiometric composition for benthic microalgae indicating that nutriment limitatin was low, if present at all. Our findings suggest that periphyton, positioned near the land-water interface, lias access to land-derived nutrients before they are diluted in the open water. Therefore, periphyton on ail substrata is the first community to respond to increased inputs resulting from lake recreational development. The mea surement of littoral algal biomass and chemical composition may represent a better tool for early detection of lake eutrophication than classic methods based on pelagic characteristics.
Key words: chlorophyli a, epilithon, epipelon, eutrophication, littoral zone, lakeshore residential development, stoichiometric composition.
13
RÉSUMÉ
Nous avons essayé de détecter l’existence de relations empiriques entre la biomasse
de périphyton et le développement résidentiel dans les lacs des Laurentides du Québec (Canada). Nous avons comparé la réponse du périphyton (chlorophylle a) sur les roches et les sédiments à celle du phytoplancton, la variable ta plus utilisée lors d’études sur l’eutrophisation. Les biomasses d’épilithon et d’épipeton ont augmenté significativement avec le développement résidentiel (pourcentage d’aire ouverte dans une zone riveraine de 50 m), mais n’étaient pas reliées aux concentrations de phosphore total de la colonne d’eau. Au contraire, le phytoplancton était relié au phosphore de la colonne d’eau, mais n’augmentait pas avec le gradient de développement des lacs. La composition stoichiométrique du périphyton a aussi changé avec l’augmentation du développement résidentiel. Des ratios élevés de C:P et C:N ont été obtenus dans les lacs peu développés, suggérant une forte limitation des nutriments. Dans les lacs les plus développés, les ratios molaires du périphyton s’approchaient des compositions stoichiométriques optimales pour les algues benthiques indiquant qu’une faible limitation des nutriments, si seulement présente. Nos résultats suggèrent que le périphyton en zone littorale a accès aux nutriments provenant des rives avant qu’ils soient dilués dans la zone pélagique. Le périphyton sur
tous les substrats est donc la première communauté à répondre à une hausse des apports en
nutriments provenant du développement résidentiel des lacs. Les mesures de biomasses des algues benthiques littorales ainsi que l’analyse de leur composition chimique pounaient représenter un meilleur moyen de détection des premiers signes d’eutrophisation que les méthodes classiques basées sur les caractéristiques pélagiques.
Mots-clés: chlorophylle a, composition stoichiométrique, développement, épilithon,
14
INTRODUCTION
Increasing population, desire to escape from urban life to nature, country retirement
of baby boomers are ail factors leading to further recreationai development in previously
pristine lakes. Construction of new dweiiings and clearing of riparian shore iead to changes in the nutrient input to these takes. The eariy detection of change in these lakes is particulariy important to prevent that they reach a eutrophic state. There are some suggestions that increasing nutrient loading to an oligotrophic lake may affect periphyton biomass and production before that ofphytoplankton (Sand-Jensen & Borum, 1991; Planas et al., 2000), yet, lake management modeis are mostly based on open water characteristics (e. g. Dillon & Rigler, 1974). The use of periphyton for monitoring eutrophication is stiil limited probably because attempts to relate periphyton biomass to water nutrients have largely faiied (Cattaneo, 1987; Hansson, 1992). This failure has been partty ascribed, at least for epipelon that grows in close contact with interstitial waters, to the fact that open
water nutrients do flot fully represent those avallable to littoral algae.
Mternatively to water nutrients, watershed variables have been used successffihly to
predict phytoplankton chlorophyli ci (Chl ci) (D’Arcy & Carignan, 1997). These variables
may be even more appropriate for modelling periphyton biomass that lay at the interface
between watershed and open water.
Here, we look for the existence of empirical relationships between periphyton biomass and recreationai development in the Laurentian lakes of Québec (Canada). Since 1970, dwelling density in this region bas more than doubled and the proportion of cottages used yearlong has substantially increased (Laurin, 2000). This development led to increased forest clearing for dwellings, lawn, parking lots, and roads that is mainly concentrated along the lakeshore. We sampled algae on rocks (epilithon) and sediments (epipelon) that are the most common natural substrata in these lakes. The response of these two communities to shore development may be different because epilithon does not receive nutrient from its substratum unlike epipelon that can draw nutrients from sediments
(Canton & Wetzel, 1988; Hansson, 1989). We compared the response ofpeniphyton Chi u
to that of phytoplankton, the most commonly used target variable in eutrophication studies. In addition, we measured C, N, and P proportions in periphyton because molar ratios may
15
be indicative of nutrient availabllity (Stevenson, 1996) and are flot to be affected by losses due to grazing and sloughing.
MATERIALS AND METIIODS Study site
We studied 18 lakes in the Laurentian region of Québec situated north of Montréal on the Canadian Shield within a 65 km radius ftom the “Station de Biologie des Laurentides” (SBL; 45° 59’ N, 73° 60’ W). This region is experiencing increasing recreational development while agriculture and industrial activity are negligible. We choose the lakes to represent the typical span in size, depth and watershed development going from pristine (no dwellings) to moderately inhabited (maximum 340 dwellinglkm2) (Tab. I).
Sampling
In the summer of 2003, we sampled 13 lakes on 3 occasions (May, lune, and August). In 2004, we revisited these 13 lakes on 4 occasions (May, June, July, and August) adding 5 new lakes to increase the range of physical and chemical variables. We collected periphyton on rocks (epilithon) and sediments (epipelon) in both years. On each lake, we sampled $ sites distributed regularly around its perimeter. A 60 ml cut off syringe was used to collect a 4.9 cm2 sediment core. The first superficial centimeter ofthe sediment core was
kept and frozen for Chi a analysis ofthe epipelon. On rocks, epilithon was collected with a bmshsyringe sampling device (4.9 cm2, Loeb, 1981) and transferred into a plastic
container. Ml samples were collected by divers at 1 m depth where light was flot limiting and wave disturbance was reduced. Preïiminary samplings had indicated that depth gradients in periphyton Chl a were flot pronounced in these lakes (unpublished data).
In the laboratory, epilithon samples were filtered on Gelman type A/E glass-fiber filters (1 p.m pore size), which were kept frozen until analysis. Chi a concentrations were measured before and afier acidification at 665nm and 750nm (Spectronic Genesys 5 spectrophotometer) after extracting filters in 95 % ethanol for 24h (Nusch, 1980). Epipelon samples were fteeze-dried before Chi cx extraction with ethanol (Hansson, 1988).
Lake Area(2)
Volume (m3 1 0) Z(m)
Z max (m)
Drainage Area (km2)
Dwelling/km2 in ail drainage area
Dwellingfkm2 in a 50 m wide riparian stiip
Cleared land
(%
in ail drainage area)Cleared land
(%
in a 50 m wide riparian strip)Catchment average siope (°)
TP (ug/L) TDP (ztgfL) TN (ug/L) NO3 (ug/L) DOC (mg/L) Seccbi depth (m) Range (mean) 0.07 —2.80 (0.61) 296—37276(6817) 4.2 —24.4 (9.0) 10—60 (22) 0.22—24.36 (6.77) 0—340 (69) 0—686(238) 0—53(10) 0—86(30) 5.9—14.6(9.1) 3.8— 12.9 (7.5) 1.4—4.3 (2.5) 202.6 —488.2 (335.4) 10.0— 121.4 (54.4) 2.2 —5.4 (3.3) 2.5 —9.0(5.4) 16
Table I. The range (mean) in watershed and lake characteristics observed in the 18 lakes
studied in the Laurentian region of Quebec. Chemical variables are the mean values of 4
17
Samples for C, N and P analyses were collected in June and August 2003 at 4 sites around each lake on rocks and sediments with the same above-described methods. Epitithon was concentrated by centrifugation, frozen, and lyophilised. The samples were then homogenized with mortar and pestie before C and N determination with a fisons Elemental Analyser 1102 CHNS-O. Phosphorus content was determined afier autoclaving a
-5 mg aliquot of the homogenized sample suspended in -50 ml of water with 0.-5 g of
potassium persulfate for 45 min at 120 oc (Stainton et aL, 1977). This technique gave similar resuits to the one using a combination of heat and acid (Hillebrand & Sommer, 1997), but required less material.
Lake water samples were collected near the deepest point of each lake contemporaneously to the littoral sampling. Integrated samples over the entire euphotic zone (defined as 1.7 times the Secchi depth) were collected with a PVC tube in duplicate (2003) and triplicate (2004) and kept reftigerated for 12-24 h until analysis. Unfiltered subsamples were used for total phosphorus (TP) and total nitrogen (TN) analyses. Water was filtered through 0.45 iim membrane filters (Life Sciences $uper®-450) for total dissolved phosphorus (TDP), nitrate (NO3) and dissolved organic carbon (DOC) analyses. Subsamples for phytoplankton Chi u measurements (Nusch, 1980) were flltered through Gelman type A/E glass-fiber filters (1 iim pore size). TP and TDP samples were analysed as orthophosphate afier persulfate digestion in an autoclave (Stainton et al., 1977). TN and NO3 were analysed with a LACHAT Continuous Flow Quick-Chem 8000 and DOC with a Shimadzu ASI-5000A
Dwelling density and cleared land surface area were measured (Maplnfo, V. 6.5) on 1:10 000 or 1:30 000 orthorectified aerial photographs acquired in 2002 and 2004. Cleared land represented areas with buildings, roads, parking lots, and lawns; in two instances, a
golf course and ski trails were also included. Because watershed development in this region
is usually concentrated around the takeshore, we measured landscape characteristics flot only in the entire drainage area, but also in various riparian strips of increasing width (50, 100, 200, 500 and 1000 m). Watershed (area and stope) and lake morphological characteristics (area, volume, maximum and average depth) were measured (Maplnfo) from numerical topographic and bathymetric maps.
18
Periphyton biomass was expressed per unit of surface (mg/m2) for epilithon and epipelon. For each lake and substratum, biomass was averaged over ail sites and dates and related to the indices of watershed development, watershed and lake morphological variables and chemical variables using simple regressions (Statistix package, Analytical Software, Tallahassee, Fi). Prior to analyses, the percentages of open land were arcsine
transformed according to Sokal & Rohif (1981).
RESULTS
Environmental characteristics ofthe takes
According to trophïc classifications (OECD, 1982), 15 of ouf 18 lakes were oligotrophic. Only three lakes were considered slightly mesotrophic with mean summer TP exceeding 10 .tg/L (10.6, 12.2, and 12.9) and mean summer TN above 400 jigfL (451, 467, and 488) (Tab. 1). Mean summer TP and TN varied respectively by 3.5 and 2.4 fold among lakes. The lake set comprised clear and coloured lakes with mean summer DOC ranging from 2.2 to 5.7 mg/L. Overali weather conditions were similar for both years ofthe study. Summer (April-August) 2003 was slightly warmer (13.2 °C) than summer 2004 (12.9 °C), but they were both slightly under the seasonal average (13.5 °C). Total summer precipitation was higher in 2003 (412 mm) than in 2004 (381 mm) and both years were below the average (496 mm). Seasonal averages are based on data registered between 1970 and 1998 by Environnement Québec nearby the Saint-Hippolyte station (7037310).
Temporal patterns of periphyton biomass
Our sampiing covered two consecutive years and different dates over the growing season to represent typicai summer periphyton development in these lakes. There were no significant seasonal pattem in the biomass of epilithon and epipelon neither in 2003
(ANOVA,p = 0.10 andp = 0.98, respectively) nor in 2004 (ANOVA, p
= 0.85 and p =
0.40, respectively). To test whether watershed development level might affect the seasonal
pattem, we grouped the lakes in three categories according to the amount of open land (as
%)
in the first 50 m ofriparian zone (Fig. 1). There were no significant seasonal pattems inany group for epilithon (ANOVA, ail p> 0.11) and for epipelon (ANOVA, allp> 0.31).
Because periphyton biomass was roughly constant throughout the summer, further analyses
19
Periphyton summer average biomass was slightly higher in 2004 than in 2003 (24 % for epilithon and 11% for epipelon). This difference was significant for both epilithon and
epipelon (Paired t-test, n 13, p 0.02 and 0.03, respectively). We kept separated the data
of the two years because they were based on a different number of lakes (13 in 2003 and 18
in 2004).
Periphyton and phytoptankton relationships with watershed development and open water chemistry
Periphyton biomass on rocks and on sediments was significantly correlated with 2 different descriptors of watershed development: dwelling density and percentage of cleared
land (Tab. II). Correlation coefficients were higher when these variables were measured in
narrow riparian strips (50 m for % cleared land and 100 m for dwelling density) rather than considering the entire watershed. Overail in both years, the best models of periphyton biomass were found when considering the percentage of open land in a 50 m riparian strip
(Fig. 2). Epilithon (as Chi a) changed more than epipelon along the development gradient. In the less perturbed lakes, biomass on sediments was more than twice as high than on
rocks whereas it was similar on the two substrata in the more developed lakes (Fig. 2a,d). Epilithon biomass was flot related for any ofthe watershed (drainage area and siope)
and lake (lake area, volume, mean and maximum depth) morphometric variables. Epipelon
biomass ha a weak but significant correlation with the ratio of drainage area to lake area (r
= 0.39, p = 0.04). Epilithon and epipelon biomass was flot corretated with variables
measured in the open water (TP, TDP, DOC, and Secchi depth) except with TN (Figs. 2c,
f). Epipelon was significantly related also with NO3 concentration (r=0.3 7, p=0.04).
In contrast to periphyton, phytoplankton Chl a was flot related to descriptors of
watershed development (Fig. 3a). Instead, phytoplankton was positively related with T?
20 (54 D) > .c Q.
o
QEPILIIHON
EPIPELON
I ‘May K June Jy - August 250 200 750 100 50o
250 200 150 100 50 OFigure 1. Seasonal changes in epilithon ta) and epipelon (b) biomass (CM a) observed in
2004 in lakes ofthe Laurentian region grouped according to the degree of clearing in a 50
m strip around the lakeshore (low< 15%, medium 15 —40 %, high
>40%). Bars represent
the mean with standard error (n=6).
Low Medium High
50m 100m 250m 500m 1000m DA 2003 0.66* 0.72** 0.54* 0.43 Epilithon Clii a 2004 0.60** 0.70** 0.40 0.27 2003 0.39 0.43 0.22 0.13 Epipelon Cli] a 2004 0.58* 0.69** 0.34 0.18 2003 0.78** 0.74** 0.68** 0.62* Epiithon Clii a 2004 0.75*** 0.72*** 0.60* 0.53* 2003 0.62* 0.60* 0.51 0.46 Epipelon Clii a 2004 0.77*** 0.73*** 0.66** 0.60** Q59** 0.48*
Periphyton stoichiometric composition
Epilithon and epipelon molar ratios (C:P, C:N, N:P) significantly decreased along the gradient of watershed development. As for periphyton biomass, the relationships
between molar ratios and percentage of open land improved when considering narrow
riparian strips. The best relationships were observed when the 50 m strips were considered (Fig. 4). Molar ratios were decreasing significantly with increasing periphyton biomass with the oniy exception of epipelon N:P (Tab. III).
Table III. Correlation coefficients between periphyton nutrient motar ratios and periphyton biomass (as Chi a) where n = 13. ‘K, ** and represent respectively significant
correlation at thep=0.05,p 0.01 andp 0.001 levet
Biomass Biomass
C:P 0.84*** C:? 0.57*
Epilithon N:? 0.78** Epipelon N:? -0.41
C:N _0.81*** C:N -0.75”
21
Table II. Correlation coefficients between epilithon and epipelon biomass (Chi a) and 2 descriptors ofwatershed development measured in various strips ofincreasing width and in
the entire drainage area (DA). n 13 in 2003 and n = 18 in 2004. ‘f’, ** and ‘fc’fc*represent
respectively significant correlation at thep O.OS,p 0.01 andp 0.001 level Dweliing/km2 0.69** 0.63** 0.41 0.64** Cleared 0.70** 0.64* 0.57’K 0.62’K 0.53* 0.32 0.49* Land % 0.68** 0.61* 0.55*
22 c1 O) >1
e
o
o
Epïlïthon
Epïpelon
TP
fugiL) 200 300 400 500TN
(ugiL) 200 300 400 500Figure 2. Relationships of epilithon and epipelon biomass (Chi u) with percentage of
cleared land inside a 50 m wide strip around the lake (CL; a, d), open water total phosphoms (TP; b, e), and total nitrogen (IN; c, f). r2 are presented for ail relationships where n= 18 (* p <0.05, **
p <0.01, p <0.001). Regression limes are shown only for
the significant relationships: a) Chlepjijthon 42.5 + 1.74 CL; c) = 0.37 TN— 27.3; d) Chlepipeion= 90.5 + 1.35 CL; f) Chlepipeion=0.31 TN29.5. 250 200 150 100 50
o
d)
. .r2= 0.59***
0 20 40 60 80 100 0 20 40 60 80 100Cleared land
-50 m
(%)
250b)
e)
200 . . 150 . . . . . . . 100 • . . . .:
• : •• 20.04
2Œ02
c)
250 200 150 100 50o
. . • .r2=0.29*
f)
. . 2=0.34*
TN
f
ugIL)
Figure 3. Relationships of phytopiankton biomass (Chi a) with percentage of open land inside a 50 m wide strip around the lake (CL; a), open water total phosphoms (TP; b), and
total nitrogen (TN; c). r2 are presented for ail relationships where n = 1$ (* p <0.05, ** p <
0.01, p < 0.001). Regression lime is shown only for the significant relationship: b) Chiphytoplanicton 1.09 + 0.13 T?.
Phytoplankton
a)
. . I.•
. .0.04
o
20 40 60 80 100Cleared land -50 m
(%)
-J C)o.
o
L..o
.o
3.5 3.0 2.5 2.0 1.5 1.0 0.5 3.5 3.0 2.5 2.0 1.5 1.0 0.5 3.5 3.0 2.5 2.0 1.5 1.0 0.5b)
. . . . .r2= 0.22*
2 4 6 8 10 12 14TP
f
ugiL)
C) . . . • . . . . .r= 0.07
200 300 400 50024
EPIUTHON
EPIPELON
40 30 20 10 O, 1800 1500 • r20.41* 1200 900 600 300 0 140 120 r20.33* r2=0.31* 100 80 Z 60 40 . • • • 20 __________________________ 0 20 40 60 80 100 0 20 40 60 80 100Open land % inside 50m
Figure 4. Relationships of epilithon ta, b, c) and epipelon (U, e, f) nutrient molar ratios and
the percentage of cleared land inside a 50 m wide strip around the lake. Regression unes and r2 are presented for ail relationships where n = 13 (‘ p < f105, **
p <0.01, ‘‘
p <
0.001). Lakes over dash unes are considered N llmited (a, d) or P limited (b, c, e, f) according to optimal periphyton stoichiometric ratios (C:N:P 119 : 17 1) proposed by Hillebrand& Sommer, 1999.
r2 = 0A8
25
DISCUSSION
Our resuits confirmed earlier observations (Cattaneo 1987; Hansson 1992) that
relatïonships between periphyton biomass and water phosphoms are poor. Light interactions over a trophic gradient, hypothesized in other studies, could be mled out beçause these lakes were ail transparent (Secchi depth aiways> 2.5 m) ami samples were collected at 1 m. Periphyton-P relationships could be poor because the concentrations measured in the water in the pelagîc zone do flot coïncide with those available to the aigae
in the littoral zone. Epilithon and epipelon biomass were both significantly correlated with
lakeshore development, either expressed as dwelling lensity or cleared land %, which presumably represents nutrient inputs. This suggests that periphyton, positioned near the land-water interface, lias .access to land-derived nutiients befre they are diluted in the open
water. This mechanism has been shown for epipelon growing on the sediments and relying on interstitial water (Carhon & Wetzel, 1988; Hansson, 1989). Being attached to an inert substratum, epilithon is supposed to respond to open water nutrients like phytoplankton
(Vadeboncoeur et al., 2006). Nevertheless, littoral epilithon should be exposed to relatively
high nutrient concentrations compared to those observed in open waters wherever nutrient
loading occurs from the shoreline. As expected, phytoplankton Chi a was significantly related with P but it clianged littie (3-fold) and flot proportionally along the development gradient. The stronger response of epilithon (16-fold) compared to phytoplankton could be explained by the fact that it is possible for attached algae to accumulate on their substratum
over long periods of time whereas such accumulation of suspended algae is prevented by sedimentation and flushing. Besides, close algal-microbial proximity is supposed to make
nutrient retention ami recycling more efficient in periphyton than in phytoplankton (Wetzel,
1996).
It lias been repeatedly observed in oligotrophic lakes that epipelon reach higher
biomass than epilithon (Vadeboncoeur et al., 2006). In the Laurentian lakes, we observed that the difference in biomass between substrata was decreasing with lakeshore residential
development. As a resuit, epilithon varied much more than epipelon along the gradient.
Epilithon should be disadvantaged in the most oligotrophic lakes because, unlike epipelon,
it cannot draw nutrients from its substratum. Once probable inputs from lakeshore
residential development enter the lakes, both epilithon and epipelon can increase in biomass. However, changes in periphyton biomass along the development gradient would
26 be more noticeable on rocks going from extremefy low biomass to levels similar to those on sediments.
Variables describing land development (dwelling density and cleared land %) were more closely related to periphyton biomass when they were calculated in narrow strips (50
or 100 m) around the lakes. This reflects the fact that residential development ofthese lakes typically occur near the shore leaving the rest of the watershed mostly untouched. Nutrient
concentrations in the open water were related to shore development when expressed per unjt of lake volume (Carignan, unpublished data). The impact of shore development on periphyton was instead independent of lake volume, again suggesting that the effect of
nutrient inputs was local at the edge of the lake rather than diluted according to water
volume.
Further evidences of periphyton enrichment were the changes in periphyton
stoichiometric composition along the gradient of lakeshore residential development. Molar ratios decreased to approach the optimal stoichiometric ratio for benthic microalgae (C:N:P 119:17:1; Hillebrand & Sommer, 1999) with increasing forest clearing along the shore. Transition from naturally vegetated shores to developed land may increase the export of disolved P (Frink, 1991) that is readily availabfe for uptake by littoral algae. High N:P and
C:P ratios in the epilithon of the most pristine takes suggest severe P limitation. In particular, the high C:P ratios we observed were in a similar range of those measured in other oligotrophic lakes of the Canadian ShielU (Frost et al., 2002). These high values probabfy reflect the presence of large amount of detritus originating from riparian sou, which is high in carbon in the Canadian Shield (Hecky et al., 1993). Indeed, proportion of detritus mateiial in periphyton of oligotrophic lakes may 5e significant (Frost et al., 2005). P enrichment lead to increased periphyton biomass and therefore to higher proportion of
alal material in the total particulate organic matter. Periphyton biomass was in fact
significantly higher when nutrients molar ratios were low, implying that most developed lakes were receiving more nutrients, especially phosphorus which supported higher
periphyton biomass.
Epipelon was also nutrient limited. Attougli C:P ratios were lower in epipelon than in epilithon, there werehigherC:N andN:P ratios in sediments than on rocks. The elevated
27 C:N ratios of epipelon in the undeveloped lakes were probably related to high amount of terrestrial plant detritus that decomposes slowly and has C:N ratios over 30 (Gosz et al.,
1973). With increasingriparian clearingthere is Iess plants detritus in lakes (Christensen et
al., 1996). This occurrence coupled with higher nutnent loading that reduces nutrient
limitation led to low molar ratios and high epipelon biomass in the developed lakes.
CONCLUSIONS
Nutrient concentrations and phytoplankton Chi a remained low throughout a large
range of lakeshore residential development. Values slightly exceeded those typical of oligotrophic lakes (OECD, 1982) in only 3 instances. In contrast, peripliyton Clii a was already beyond the value of 100 mg/m2, generally considered as the beginning of nuisance conditions (Dodds et al., 1997), in several lakes (9 for epilithon and 12 for epipelon). Based on consideration of nutrient and light requirements, it lias been hypothesized that littoral algae would be more important than phytoplankton in shallow oligotrophic lakes (San Jensen & Bomm, 1991) whereas phytoplankton would become prevalent in eutrophic systems. This hypothesis lias been supported by comparisons of periphyton and
phytoplankton development over large trophic spans and broad geographic scales
(Hansson, 1992; Vadeboncoeur et al., 2006). Whole-lake (Vadeboncoeur et al., 2001) and mesocosm (Blumenshine et al., 1997) experimental fertilization have shown a strong response of algae on hard substrata but flot of those on sediments. To our knowledge, however this study provides the first demonstration in unmanipulated lakes of a same region that periphyton on ail substrata respond more than phytoplankton to increasing
lakeshore development. Nutiient enrichment following watershed fire and harvesting
enhanced benthic production more than pelagic (Planas et al. 2000). These findings have
important implications for lake management.
Considerable effort by state agencies and resident associations is directed to measure open water characteristics (Secchi depth, phytoplankton Chi a, and TP) to set management guidelines and to monitor the evolution of lake trophic state. Such strategy may be misleading for lakes experiencing recent recreational development. In the
Laurentian lakes, development of littoral algae provided a stronger response to shore
perturbation than changes in water transparency. Warning signs may appear in the open