HAL Id: hal-00952696
https://hal.archives-ouvertes.fr/hal-00952696
Submitted on 27 Feb 2014
HAL is a multi-disciplinary open access
archive for the deposit and dissemination of
sci-entific research documents, whether they are
pub-lished or not. The documents may come from
teaching and research institutions in France or
abroad, or from public or private research centers.
L’archive ouverte pluridisciplinaire HAL, est
destinée au dépôt et à la diffusion de documents
scientifiques de niveau recherche, publiés ou non,
émanant des établissements d’enseignement et de
recherche français ou étrangers, des laboratoires
publics ou privés.
Investigating Electrophysiology for Measuring Emotions
Triggered by Audio Stimuli
Filippo Mazza, Matthieu Perreira da Silva, Patrick Le Callet
To cite this version:
Filippo Mazza, Matthieu Perreira da Silva, Patrick Le Callet. Investigating Electrophysiology for
Measuring Emotions Triggered by Audio Stimuli. Asilomar Conference on Signals, Systems and
Com-puters 2013, Nov 2013, Pacific Grove, CA, United States. 5 p. �hal-00952696�
Investigating Electrophysiology for Measuring
Emotions Triggered by Audio Stimuli
F. Mazza
LUNAM, Ecole Centrale de Nantes
IRCCyN UMR CNRS 6597
Nantes, FRANCE
[email protected]
M.P. Da Silva, P. Le Callet
LUNAM, Universit´e de Nantes
IRCCyN UMR CNRS 6597
Nantes, FRANCE
{matthieu.perreiradasilva,patrick.lecallet}@univ-nantes.fr
Abstract—Multimedia quality evaluation recently started to take into account also analysis of emotional response to audio-visual stimuli. This is especially true for quality of experience evaluation. Self-assessed affective reports are commonly used for this purpose. Nevertheless, measuring emotions via physiological measurement might be also considered as it could limit the effects of cognitive bias due to self-report following the rule that your body cannot lie. In this paper we first review in the context of emotion assessment, common physiological measurements such as cardiac and respiratory rhythms, Electroencephalography (EEG) and Galvanic Skin Resistance (GSR); more advanced techniques as infrared thermography or blood perfusion with laser Doppler flowmetry. Then we present some results of electrophysiological measures related to the evaluation of emotions triggered by sounds.
H.6 - Speech, Image and Video Processing: Models for Signal and Image Processing
Keywords—Multimedia quality, affective evaluation, electro-physiology, EEG, LDPM
I. INTRODUCTION
Affective research has become from mere theoretical dis-cussion one of the most active topic in recent research [1]. Emotion evaluation can be useful for many aspects. For example, understanding users’ state of mind can be very valuable in researches where the user itself plays an important role in evaluation models, as it is becoming with research on quality of experience [2]: perceived quality is related to a broader evaluation taking into account multiple influence factors. Between them human factors, taking into account user related context and notably user emotional state. User’s affective state evaluations have then started to be included in perceptual models, as emotions play an important role in how we perceive the world around us and how we react to it [3]. Different ways of measuring emotions have been studied. For long time moods and emotions have been evaluated through questionnaires developed by psychologists or other non verbal instruments such as behavioural analysis [4]. The problem with those systems is inherent to the highly subjective nature of the topic but also to the less obvious problem of describing correctly what we feel. However, our emotions affect not only our perception but also our physiology, having reflections on the nervous system. Evidence of emotion reflection on physiological activity has been found both in central and peripheral nervous system. Distinctive patterns of autonomic
nervous system (ANS) activity have been found for some emotions [5]. As ’our body can’t lie’, electrophysiology has been later adopted to evaluate emotional impact achieving remarkable results. Many differently kind of electrophysiology measures have been studied in the field, both related to the Central (CNS) or Peripheral Nervous System (PNS)[6]. Considering this last case, as body temperature is controlled also via blood perfusion in tissues, we expect that blood per-fusion measure reflects emotional responses. In this paper we focus on first experiments with blood perfusion measurement through Laser Doppler measurements - shortly Laser Doppler perfusion monitoring or LDPM - that has been very few times used in affective research. However this technology has been positively employed for affective research with stimuli other than multimedia, notably water taste [7]. Our aim is to evaluate the use of this technology alone for affective research and check how it relates with other better known alternatives.
II. ELECTROPHYSIOLOGY AND EMOTIONS A large literature is present regarding electrophysiology measures related to emotions felt presenting multimedia stim-uli. Often researches focus on correlating physiological pat-terns with emotion self assessments, used as ground truth.
Brain activity, related to CNS, is directly related to emo-tions and many researches have been carried out in this field. EEG is among the most used measures in affective research and even if mechanisms related to emotions in the brain are still to be completely understood, research on EEG is now quite advanced. Psychophysiological studies underline how frontal brain lobes are directly related to emotion [8] [9]. EEG band power are the main features used as input for machine learning systems. Four main bands are commonly used, called alpha beta delta and gamma, based on different signal patterns ap-pearing during different brain activities. Signal classifications using these and other features have been adopted successfully, in particular Neural Networks [9] or gaussian processes[10]. Remarkable results have been obtained in [11], where posi-tive and negaposi-tive emotions are classified with Space Vector Machines achieving accuracies slightly below 90%. Magnetic Resonance Imaging has also been adopted to evaluate brain reactions to affective audio stimuli [12]: strong relationship have been found between sound emotional value and blood oxygenation in brain areas related to emotional reactions, as amygdala and prefrontal cortex.
As CNS manages all biological basic functions support-ing life like cardiovascular activity or respiration, emotion’s influence on biosignal is likely to be found also on PNS. Evidence of this assumption has already been found and different biosignals related to PNS have been measured in relation to emotions. These measures usually present the advantage of being less invasive than the ones of CNS. Car-diorespiratory activity is probably the most basic physiological activity related to emotions. Distinct patterns have been found and associated to basic emotions felt. In [13] researchers investigated cardiorespiratory activity during experiences of different emotions. Those emotions have been elicited asking subjects to disclose a personal strongly affective experience. Difference between electrophysiological patterns have been found using a multivariate analysis approach and the study underlines how peripheral physiological activity is associated with different emotions. Many other researches have been fo-cused to cardiovascular activity related to emotions, especially in medicine. A comprehensive review can be found in [14]. Another measure used is Galvanic Skin Resistance, expecially used for reactions to stress [15] but also related to cognitive load during certain tasks [16]. Electromyography has been used too in conjunction with GSR as in [17] or alone as with facial electromyography in [18] while participants judged emotional and neutral concepts. Recently pupil diameter has been used too [19]. Multimodal approaches in affective research have been approached too, using multiple electrophysiology mea-surements at the same time, as in [20]. This research provides also the collection of physiological signals online, providing a dataset consisting of multiple measurements as EEG, GSR, respiration amplitude, blood volume, face recordings and elec-trooculogram taken while users were watching audio-video stimuli.
As mentioned before, temperature is another monitored pa-rameter. Infrared thermography has been used to demonstrate reflexes due to emotional video stimuli [21]. In this case, the sympathetic vasoconstriction in forearms was monitored. A correlation with stimuli presentation was found, demonstrating local temperature changes. In detail, the video stimuli pre-sented a thriller scene and the temperature decreased during this stimuli. The same principle has been recently adopted with fingertip temperature to implement first steps toward an automatic recognition system [22].
The evaluations related to the cardiovascular system for emotional impact were only heart pulse and blood pressure of systemic circulation, . At the best of our knowledge until now blood flowmetry alone has never been used for multimedia affective research, as it has used only in coordination with thermal imaging [21]. Good results have been instead achieved for water taste stimuli in [7]. In this paper we want to explore the possibilities given by using blood perfusion monitoring in hands fingertip without thermal imaging.
III. LASER DOPPLER PERFUSION MONITOR Laser Doppler Perfusion Monitoring (LDPM) is a tech-nique used in medicine for studying the perfusion of blood in microcirculation of tissues. It is widely adopted for analyzing tissues damaged by heat as in burn assessment or in necrotic pathologies. In general, laser doppler velocimetry adopts the shift in the frequency of a low power laser’s reflected light
as a measure of the quantity and velocity of particles in fluids [23]. This is why it is also known as laser doppler flowmetry or velocimetry. The principle is the following: a laser light beam of a fixed wavelength is emitted toward the fluid, so that the incident light is reflected by particles in it. A receiver measures the light reflected at a fixed angle. Frequency of reflected light is shifted hitting moving particles due to the Doppler Effect. As part of emitted light is absorbed and diffracted, the measure takes into account light reflected by an area defined by the characteristics of the laser frequency and of the material under test. In our device’s probe, a 780 nm laser light is emitted 0.25 mm far from the receiver; considering the average composition of surface skin, we are able to measure blood perfusion 1 mm beneath skin. Blood perfusion is directly related to both the amount and speed of particles in the capillaries, and it’s influenced by many different factors, like position, age, temperature, health, heart rate and blood pressure. As these last physiological factors are ruled by the autonomous nervous system, we are investigating if this measurement links with users psychological reactions. LDPM shows fluctuations in flow’s speed. This allows to measure homeostasic reactions like vasoconstriction and also heart beats; in the first case sig-nal shows a decay due to lowering of flow, while in the second faster oscillations will be summed to the signal baseline. With more accuracy and sampling, also heart valves opening/closing can be seen. A deeper analysis of laser Doppler perfusion signal frequencies measurable from human skin is present in [24], also during thermal tests [25]. This measurement gives an absolute value - in Perfusion Units (PU) - of the irroration of tissue due to microcirculation. As said, perfusion is related to reflected light; the reflected light is related both to the velocity and quantity of particles. Two different measures are then available, called respectively Velocity and Concentration of Moving Blood Cells (CMBC). The perfusion is given by their product. At the moment, to the best of our knowledge, LDPM has been used in affective research with multimedia stimuli only once as a complementary measure, to check the presence of vasoconstriction due to a stimuli [21]. Recently skin blood flow has been monitored with LDPM in affective research for other kind of stimuli, notably tastes and odours of water [7]. In this work the main measurement adopted was infrared thermography on fingertip temperature and perfusion measurements where taken jointly LDPM and also blood pressure.
IV. METHODS
To evaluate LDPM technology for affective research we conducted an experiment aimed at collecting blood perfusion measures from users listening to affective sounds. We then tried to classify recorded signals respect to class of stimuli proposed. To do this, as it is one of the first studies of LDPM for affective stimuli, no reference methodology exists at the best of our knowledge. This is why, as a first approach, we adopted a similar methodology and data analysis as in a previous affective experiment we conducted adopting EEG; data has been collected within a broader multimodal joint research related to quality of experience in the scope of Qualinet community1[26]. That research adopted audio video
1European Network on Quality of Experience in Multimedia Systems and
stimuli as EEG technology has been deeply researched for affective purposes and interactions have been described in different conditions. Regarding the LDPM experiment instead we decided to use simple affective stimuli,as mechanisms underlying the relation between blood perfusion and emotions felt are not yet well known and described. We adopted a single modality - only audio - as we still don’t know if there is any effect regarding multimodality audio video. We’ve adopted the International Affective Digitized Sounds (IADS) database, provided under request by the NIMH Center for Emotion and Attention (CSEA) at the University of Florida [27] as done on others affective researches [28] [12]. This database consists of many different pure sounds without any speech -of different nature, evaluated subjectively for their emotional impact. The latest version of this database take into account 167 different sounds of 6 seconds length in average, rated each one from at least 100 participants. Emotional impact has been assessed with the Self Assessment Manikin (SAM), providing a rate in the PAD space. We selected a subset of this database to limit experiment duration, as longer times are more likely to cause stress and/or boredom to the user, impairing affective assessment. Subset has been constructed choosing sounds the more possibly spaced on the PAD space. Clustering and selection of representants has been adopted to restrict sound number, as done in [12]. Before clustering the space we restricted the number of samples selecting the ones with lower standard deviation in assessments. For clustering we adopted the KMean algorithm. At first we empirically choose 5 different regions in the PAD space looking at the sound distribution and selected the three sounds closest to cluster centroid to represent it; ANOVA analysis on the three separate dimensions has been run to avoid taking outliers of a cluster. As we do not have raw self assessment data - not provided with the IADS database - we adopted the procedure described in [29] using directly mean value and standard deviation of sounds evaluations. The whole procedure brought to underline two big group of sounds, that we indicate as A and B respectively, as shown in figure 1, of lower or higher affective impact. In any case, we rely completely on the effectiveness of chosen stimuli. We suppose that the user actually perceives the content as expected, eliciting emotions, but this could not be the case for all or a part of the stimuli.
Blood perfusion has been measured only via Laser Doppler, using a medical grade device made by Perimed, the PeriFlux System 5000 equipped with a PF 5010 LDPM unit. Data has been acquired through the official software provided, sampled at 125 Hz. Blood perfusion has been measured on left hand index fingertip; while it was possible to measure it also in other points, we’ve chosen this point as previous research conducted on hands temperature reaction to affective stimuli already showed perfusion changes in reaction to sympathetic responses. Probe was positioned at finger’s center.
For each test run we randomized cluster order presentation and sound order in each cluster, as we did not want bias introduced by presentation order or by any cumulative effect on emotion that can arise. We saved for each trial the order on a file in order to further process our data.
Each cluster, made of three representants, has been pre-sented once to each subject. A fixed amount of time has been waited before providing the next stimuli burst. The purpose
Fig. 1. IADS sound clustering; two main regions underlined
of this pause, is to relax the user before the next stimuli set. During pre-tests, we empirically determined that a pause of 10 seconds was in average enough to let the user relax and restore a baseline in physiological signals to start from. It has to be noticed that this baseline can differ from the one at the beginning, as the overall state of the user can change, although the randomization at the beginning mitigate possible bias or accumulation effects in the user. We noticed also that more seconds are not likely to restore this baseline easier, as fluctuations arise again. Our hypothesis is that a longer time can cause the user to focus on something else and this can provide measurable reactions on the user that can bias the experiment. For example, a longer period may induce the user to think about something wrong with the experiment or on how much time has passed and think on what he has to do next, causing a reaction dependent on his state of mind.
26 people, aged between 23 and 30, participated in the experiment. People have been previously informed about the experiment, the kind of stimuli used, the time required and the anonymity of results before participating. Only the exact content of stimuli and purpose of the experiment have not been revealed in order not to false reactions during listening. The experiments took place in a dedicated experiment room in controlled conditions; we’ve chosen an un-noisy environment and we used an high quality headset made by AKG. Audio volume was fixed on an audible level for all users and was not normalized as we relied completely on the sounds prepared in the IADS database. Temperature has been monitored, adopting a warm ambient with a temperature of 22 +- 1 C, as thermal factors such as core and skin temperatures impacts deeply on the sweat rate and skin blood flow [30][25]. We introduced the subject in this room approximately 6 minutes before starting the listening in order to allow them to adapt to this temperature; many parameters impacts on thermoregulation time, but researches show adaptation times inferior to this in similar conditions [30]. Moreover, we adopted this relax period because also physical activity impacts on perfusion value [31].
V. DATA ANALYSIS AND RESULTS
We started analysis adopting techniques already used in different electrophysiology measurements, notably as with our EEG experiment previously cited, as there is no literature regarding LDPM in detail for affective research. We focused our attention directly on the perfusion signal instead on only Velocity or CMBC signals as the first is related to both of them and we don’t know which one can be more representative of
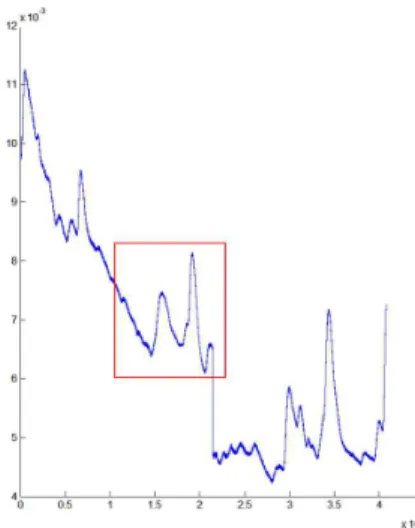
an emotion. Signals have been inspected manually in order to check for clear errors or impairments, as due to data commu-nication errors or probe shifts, ending in removing a user from the dataset as probe had a discontinuous contact with user’s finger. Other smaller impairments have been successively re-moved manually. Signals have been aligned cutting unneeded seconds from beginning and end of recordings, belonging to setup and post-test moments. This visual inspection showed also a large variation between signals, showing a different degree of reaction between users; only in few cases very small or no variations from baseline were present. It is not possible to say if this is only due to their personal variation in perfusion or to an higher reaction to stimuli. In some cases a slow ’fall-rise’ pattern is observed soon after a stimuli. However delay and amplitudes are strongly subjective; in any case no stimuli elicited a fall-rise pattern longer than 3 seconds until now. However, considering pattern features as mean, standard deviation or derivate, the analysis carried out did not underline a strong correlation stimuli/observed pattern. A first simple analysis to carry is to find if with only the LDPM we can detect the presence of a stimuli, that is to say if the stimuli perception provoked a variation on signals baseline.
Fig. 2. A fall rise pattern observed close after stimuli
To analyze mathematically perfusion signals evolution after a sound stimuli we the filtered heart rate components, visible on perfusion signal, and higher frequencies. Low frequency os-cillations are confirmed on Laser Doppler Flowmetry of blood [24] and our analysis shows 99% of the power distributed below 4 Hz. Hearth rate pulses have been removed with a notch filter as here we are not interested in heart pulse measure to our affective evaluation. Signals have then been low pass filtered, decimated and z-scored. Starting from previous observations we selected signal features to use on a machine learning algorithm. Our aim here is to check if we can discriminate between user state while listening to a sound belonging to cluster A or cluster B previously described. Signal has been windowed in order to separate reactions belonging to different sounds. Power of different frequencies have been extracted from perfusion signals based on proposed features in literature, related to other physiological responses, as in [9] [20]. We adopted in detail a multilayer perceptron, feedforward back-propagation, with one hidden layer, tuning it accordingly; 15%
of data has been used for the validation stage. Classification shows accuracy better than chance, as presented in confusion matrix in figure 3. Results are impaired mostly from erroneous classification of second cluster, relative to higher values in PAD space, as a low value one. The other one instead, although presents some misclassification, is better recognized. These results are less performing compared with the ones of our previously cited EEG experiment, from which we adopted methodology and data analysis. In that experiment, adopting as for LDPM two classes for low and high impact stimuli, we achieved an accuracy in correct classification of 82% for the first and 76% for the second class.
Fig. 3. Confusion matrix for LDPM classification; percentage of correct classification, for stimuli group low (A) and high (B) impact.
VI. DISCUSSION
Research on affective research, adopting different elec-trophysiological measurements, demonstrated notable results. However some challenges are still open. Different methodolo-gies may be suitable with different stimuli or subjects, as re-actions may be inherently different. Multiple technologies can be used even at the same time, as they can be complementary. These elements give space for improvements. In this paper we showed preliminary results on affective research investigating Laser Doppler perfusion monitoring. To the best of our knowl-edge, this is the first time this methodology is used alone for affective evaluations with multimedia stimuli. We conducted a test with affective stimuli recording LDPM, allowing us to take confidence with the instrument, the protocol and to gather a set of data measurements to work with, identifying main challenges. While results obtained are encouraging, lot of work is still to be done to reliably adopt LDPM alone with affective multimedia stimuli. Multiple elements in our experiment can contribute to this outcome. Choice of probe position and small variabilities of its position due to differences in users fingertips; circadian rhythms influencing blood pressure baseline; valence of affective content used has been previously evaluated from a different group of individuals, as those opinions may not reflect the actual perception of our subjects; stimuli length may be too restrictive. Measured reactions to stimuli showed high variability from user to user; this can be caused also to the fact that some stimuli elicit more powerful emotions if related to previous users experiences. Interestingly in fact, talking with users after tests, we discovered that some of them perceived stimuli more relevant as they made them think about personal experiences. This factor was not taken into account and should be considered in future works. However, although some effects can been taken into account as room temperature and user position, many others are difficult to control, as comfort degree felt by subject during the test and fatigue or participant current mood. In the end we are positively oriented to continue this study, comforted from works on
similar measurements and our preliminary results, also using it as a complementary measure for PNS. Future works should focus on solving problems spotted and study deeper fall rise patterns observed after stimuli.
REFERENCES
[1] R. W. Picard, “Affective Computing: From Laughter to IEEE,” IEEE Transactions on Affective Computing, vol. 1, no. 1, pp. 11–17, Jan. 2010. [Online]. Available: http://ieeexplore.ieee.org/lpdocs/epic03/wrapper.htm?arnumber=5565330 [2] P. Le Callet, S. M¨oller, and A. Perkis, “Qualinet White Paper on
Definitions of Quality of Experience, European Network on Quality of Experience in Multimedia Systems and Services (COST Action IC 1003), version 1.2,” 2012.
[3] A. R. Damasio, Descartes’ Error: Emotion, Reason, and the Human Brain. Putnam Publishing, 1994.
[4] P. M. A. Desmet, “Measuring emotions; development and application of an instrument to measure emotional responses to products.” in Funol-ogy: from Usability to Enjoyment, P. W. M.A. Blythe, K. Overbeeke, A.F. Monk, Ed. Kluwer Academic Publishers, 2003, pp. pp. 111–123. [5] P. Ekman, “Handbook of Cognition and Emotion, Basic Emotions,”
1999, no. 1992, ch. 3, p. 13.
[6] G. Chanel, C. Rebetez, M. B´etrancourt, and T. Pun, “Emotion assess-ment from physiological signals for adaptation of game difficulty,” Sys-tems, Man and . . ., vol. 41, no. 6, pp. 1052–1063, 2011. [Online]. Avail-able: http://ieeexplore.ieee.org/xpls/abs all.jsp?arnumber=5738690 [7] G. Haese, P. Humeau, F. D. E. Oliveira, L. E. Callet, and P. L. E.
Cloirec, “Tastes and odors of water - Quantifying objective analyses : a review (In Press),” Critical Reviews in Environmental Science and Technology, pp. 1–66.
[8] C. P. Niemic, A. Kirk, W. Brown, and D. Ph, “Studies of Emotion: A Theoretical and Emperical Review of Psychophysiological Studies of Emotion,” Journal of Undergraduate Research, pp. 15–18, 2002. [9] D. O. Bos, “EEG-based emotion recognition: The influence of visual
and auditory stimuli,” Emotion, 2006.
[10] M. Zhong, F. Lotte, M. Girolami, and A. L´ecuyer, “Classifying EEG for brain computer interfaces using gaussian processes,” Pattern Recognition Letters, vol. 3, pp. 354–359, 2008. [Online]. Available: http://www.sciencedirect.com/science/article/pii/S0167865507003303
[11] D. Nie, X. Wang, L. Shi, and B. Lu,
“EEG-based emotion recognition during watching movies,” Neural Engineering (NER), . . ., pp. 667–670, 2011. [Online]. Available: http://ieeexplore.ieee.org/xpls/abs all.jsp?arnumber=5910636
[12] M. Viinikainen, J. K¨atsyri, and M. Sams, “Representation of perceived sound valence in the human brain.” Human brain mapping, vol. 33, no. 10, pp. 2295–305, Oct. 2012. [Online]. Available: http://www.ncbi.nlm.nih.gov/pubmed/21826759
[13] P. Rainville, A. Bechara, N. Naqvi, and A. R. Damasio, “Basic emotions are associated with distinct patterns of cardiorespiratory activity.” International journal of psychophysiology, vol. 61, no. 1, pp. 5–18, Jul. 2006. [Online]. Available: http://www.ncbi.nlm.nih.gov/pubmed/16439033
[14] S. D. Kreibig, F. H. Wilhelm, W. T. Roth, and J. J. Gross, “Cardiovascular, electrodermal, and respiratory response patterns to fear- and sadness-inducing films.” Psychophysiology, vol. 44, no. 5, pp. 787–806, Sep. 2007. [Online]. Available: http://www.ncbi.nlm.nih.gov/pubmed/17598878
[15] S. Wu and T. Lin, “Exploring the use of physiology in adaptive game design,” 2011 International Conference
on Consumer Electronics, Communications and Networks
(CECNet), pp. 1280–1283, Apr. 2011. [Online]. Available: http://ieeexplore.ieee.org/lpdocs/epic03/wrapper.htm?arnumber=5768186 [16] N. Nourbakhsh, Y. Wang, F. Chen, and R. Calvo, “Using Galvanic
Skin Response for Cognitive Load Measurement in Arithmetic and Reading Tasks,” in OZCHI’12, Melbourne, Australia, 2012, pp.
1–4. [Online]. Available: http://sydney.edu.au/engineering/latte/docs/12-OzCHI-Narguess.pdf
[17] A. Nakasone, M. Ishizuka, and H. Prendinger, “Emotion recognition from electromyography and skin conductance,” in Proceedings 5th International Workshop on Biosignal Interpretation, 2005, pp. 219–222. [18] P. M. Niedenthal, P. Winkielman, L. Mondillon, and N. Vermeulen, “Embodiment of emotion concepts.” Journal of personality and social psychology, vol. 96, no. 6, pp. 1120–36, Jun. 2009. [Online]. Available: http://www.ncbi.nlm.nih.gov/pubmed/19469591
[19] P. Ren, A. Barreto, Y. Gao, and M. Adjouadi, “Affective Assessment by Digital Processing of the Pupil Diameter,” IEEE Transactions on Affective Computing, vol. 4, no. 1, pp. 2–14, Jan. 2013. [Online]. Available: http://ieeexplore.ieee.org/lpdocs/epic03/wrapper.htm?arnumber=6257357 [20] S. Koelstra, C. Muhl, M. Soleymani, J.-s. Lee, A. Yazdani,
T. Ebrahimi, T. Pun, A. Nijholt, and I. Patras, “DEAP: A Database for Emotion Analysis; Using Physiological Signals,” Affective Computing, . . ., pp. 1–15, 2012. [Online]. Available: http://ieeexplore.ieee.org/xpls/abs all.jsp?arnumber=5871728 [21] A. Kistler, C. Mariauzouls, and K. von Berlepsch, “Fingertip
temperature as an indicator for sympathetic responses.” International journal of psychophysiology : official journal of the International Organization of Psychophysiology, vol. 29, no. 1, pp. 35–41, Jun. 1998. [Online]. Available: http://www.ncbi.nlm.nih.gov/pubmed/9641246 [22] G. Shivakumar and P. Vijaya, “Emotion Recognition Using
Finger Tip Temperature: First Step towards an Auto-matic System,” ijcee.org, vol. 4, no. 3, pp. 252–255, 2012. [Online]. Available: http://www.ijcee.org/abstract/489-P005.htm http://www.ijcee.org/papers/489-P005.pdf
[23] F. Durst, A. Melling, and J. Whitelaw, Principles and practice of laser-Doppler anemometry, 1976.
[24] P. Kvandal, S. A. Landsverk, A. Bernjak, A. Stefanovska, H. D. Kvernmo, and K. A. Kirkebø en, “Low-frequency oscillations of the laser Doppler perfusion signal in human skin.” Microvascular research, vol. 72, no. 3, pp. 120–7, Nov. 2006. [Online]. Available: http://www.ncbi.nlm.nih.gov/pubmed/16854436
[25] R. Maniewski, P. Leger, P. Lewandowski, A. Liebert, P. Bendayan, H. Boccalon, L. Bajorski, and K. O. M¨oller, “Spectral analysis of laser-Doppler perfusion signal measured during thermal test.” Technology and health care : official journal of the European Society for Engineering and Medicine, vol. 7, no. 2-3, pp. 163–9, Jan. 1999. [Online]. Available: http://www.ncbi.nlm.nih.gov/pubmed/10463305 [26] K. D. Moor, F. Mazza, I. Hupont, and M. R´ıos, “Chamber QoE A
Multi-instrumental Approach to Explore Affective Aspects in relation to Quality of Experience (In Press),” Proc. SPIE, Human Vision and Electronic Imaging, 2014.
[27] M. Bradley and P. Lang, “The International Affective Digitized Sounds (2nd Edition; IADS-2): Affective ratings of sounds and instruction manual,” . . . FL, Tech. Rep . . . , 2007.
[28] C. M¨uhl and E. van den Broek, “Multi-modal affect induction for affective brain-computer interfaces,” in Affective Computing and Intelligent Interaction, 2011, pp. 235–245. [Online]. Available: http://www.springerlink.com/index/G425M87105021T38.pdf
[29] B. Cohen, “Calculating a factorial ANOVA from means and standard deviations,” . . . Statistics: Statistical Issues in Psychology, Education, . . ., 2002. [Online]. Available: http://www.tandfonline.com/doi/abs/10.1207/S15328031US0103 04 [30] N. Kondo, N. Taylor, and M. Shibasaki, “Thermoregulatory
adaptation in humans and its modifying factors,” vol. 13, pp. 35–41, 2009. [Online]. Available: http://ro.uow.edu.au/cgi/viewcontent.cgi?article=1232&context=asdpapers [31] H. D. Kvernmo, A. Stefanovska, M. Bracic, K. A. Kirkebø en,
and K. Kvernebo, “Spectral analysis of the laser Doppler perfusion signal in human skin before and after exercise.” Microvascular research, vol. 56, no. 3, pp. 173–82, Nov. 1998. [Online]. Available: http://www.ncbi.nlm.nih.gov/pubmed/9828155