HAL Id: inserm-02904647
https://www.hal.inserm.fr/inserm-02904647
Submitted on 22 Jul 2020
HAL is a multi-disciplinary open access archive for the deposit and dissemination of sci-entific research documents, whether they are pub-lished or not. The documents may come from teaching and research institutions in France or abroad, or from public or private research centers.
L’archive ouverte pluridisciplinaire HAL, est destinée au dépôt et à la diffusion de documents scientifiques de niveau recherche, publiés ou non, émanant des établissements d’enseignement et de recherche français ou étrangers, des laboratoires publics ou privés.
qualitative data in health outcomes research
Fatoumata Fofana, Pat Bazeley, Antoine Regnault
To cite this version:
Fatoumata Fofana, Pat Bazeley, Antoine Regnault. Applying a mixed methods design to test satura-tion for qualitative data in health outcomes research. PLoS ONE, Public Library of Science, 2020, 15 (6), pp.e0234898. �10.1371/journal.pone.0234898�. �inserm-02904647�
RESEARCH ARTICLE
Applying a mixed methods design to test
saturation for qualitative data in health
outcomes research
Fatoumata FofanaID1,2*, Pat Bazeley3, Antoine Regnault4
1 Patient-Centered Outcomes, ICON plc, Lyon, France, 2 UMR INSERM 1246, SPHERE « methodS in
Patients-centered outcomes and HEalth ResEarch », University of Nantes, University of Tours, Nantes, France, 3 Western Sydney University, Sydney, Australia, 4 Modus Outcomes, Lyon, France
*ffofana.cisse@outlook.com
Abstract
Saturation, a core concept in qualitative research, suggests when data collection might end. It is reached when no new relevant information emerges with additional interviews. The aim of this research was to explore whether a mixed methods design could contribute to the demonstration of saturation. Firstly, saturation was conceptualized mathematically using set theory. Secondly, a conversion mixed design was conducted: a set of codes derived from qualitative interviews were quantitized and analyzed using partial least squares (PLS) regression to document whether saturation was reached. A qualitative study conducted by other researchers prior to this work (i.e. none of the present authors was involved in this study) was used to test saturation using PLS regression. This illustrative qualitative study aimed to investigate the impact of Clostridium difficile infection (CDI) on nurses’ work in the hospital and the results were published elsewhere (Guillemin et al. 2015). Semi-structured interviews were conducted with 12 nurses. Saturation was characterized by the cumulative percentage of variability accounted for by PLS factors. After 12 interviews, this percentage was 51% which suggests that saturation was achieved at least on main themes. Two main themes identifying similarities in the experience of nurses caring for patients with CDI were identified: Organization/Coordination of the working day and Time-consuming work. Although dependent on the coding of qualitative data, PLS regression of quantitized data from qualitative interviews generated useful information for the determination of saturation.
Introduction
Background
The determination of an adequate sample size to appropriately address a research question is a fundamental aspect of the data collection process in any context, qualitative or quantitative. In quantitative research, adequate sample size is determined using an inferential statistical frame-work, based on assumptions on type I and II error control. In qualitative research, the concept of saturation, also known as ‘data saturation’, has been proposed as the solution to determine
a1111111111 a1111111111 a1111111111 a1111111111 a1111111111 OPEN ACCESS
Citation: Fofana F, Bazeley P, Regnault A (2020)
Applying a mixed methods design to test saturation for qualitative data in health outcomes research. PLoS ONE 15(6): e0234898.https://doi.org/ 10.1371/journal.pone.0234898
Editor: Adam T. Perzynski, The MetroHealth
System and Case Western Reserve University, UNITED STATES
Received: June 6, 2019 Accepted: June 4, 2020 Published: June 19, 2020
Copyright:© 2020 Fofana et al. This is an open access article distributed under the terms of the
Creative Commons Attribution License, which permits unrestricted use, distribution, and reproduction in any medium, provided the original author and source are credited.
Data Availability Statement: All relevant data are
within the manuscript and its Supporting Information files.
Funding: This work was conducted as part of FF’s
PhD program. The PhD was supported by the ‘Conventions Industrielles de Formation par la REcherche’ (CIFRE) program (n˚ 2012/0326) from the French National Association of Research and Technology (‘Association Nationale de la Recherche et de la Technologie’ [ANRT]). Modus Outcomes provided funding for the payment of
an adequate sample size. Morse defined saturation as “data adequacy” which means that satu-ration is reached when data collected is sufficient to cover the themes of interest and that col-lecting further data will not bring new relevant information [1]. Saturation is commonly documented through a saturation grid which consists of a simple report of the occurrence of a theme (displayed in a row) elicited during each interview (displayed in a column) in a tabular format [2]. In the grid, saturation is considered reached when the column for the current inter-view is empty, suggesting that no new themes have been elicited [2]. Over the last few years, there has been a growing interest in methods for determining sample size in qualitative research and researchers have proposed various approaches to operationalize saturation or to come up with an adequate sample size to reach saturation [1,3–15]. Some have proposed quantitative methods to address the saturation question. Tran et al. used a mathematical model developed for ecological studies to extrapolate the accumulation of themes and to help researchers determine the point of data saturation in studies with open-ended questions [13]. van Rijnsoever used data resampling with a simulation approach to explore the sample size required to reach theoretical saturation [15]. Lowe et al. proposed a mathematical model for both quantifying saturation (by describing the progress of theme acquisition) and estimating the number of observations required to achieve a specified level of saturation [6].
Mixed methods research (MMR) can be defined as “research in which the investigator col-lects and analyzes data, integrates the findings, and draws inferences using both qualitative and quantitative approaches or methods in a single study or program of inquiry”[16]. MMR has been increasingly used in health outcomes research over the past years for different pur-poses [17]: for example, to explore the benefit-risk balance from the patient perspective in rare diseases [18]; to generate information to support the interpretation of patient-reported out-come (PRO) scores [19,20]; to capture the patient’s and family’s voice in natural history stud-ies for orphan drug development [21]; or to create fit-for-purpose PRO measures [22,23]. Besides, MMR is recognized as a useful method to generate patient-centered evidence by regu-latory agencies [24].
MMR offers a variety of study designs that are used depending on the research question. In the health outcomes field, one of the most common mixed methods designs is the convergent parallel design [25,26]. The convergent parallel design is used when the researcher wants to conduct study conceptualization (i.e. defining the research question), data collection, data analysis from both qualitative and quantitative strands independently but concomitantly [25,
27]. Ultimately, the two sets of results are merged and then interpreted to draw an overall con-clusion. In our research, we used a convergent parallel design including data transformation. This type of design is called a conversion mixed design [28], a multistrand parallel design in which mixing of qualitative and quantitative approaches occurs when one type of data is con-verted (qualitized or quantitized) and then analyzed both qualitatively and quantitatively [29]. Quantitizing coded qualitative data is usually achieved by considering the codes as variables, and counting either presence/absence for each case, or the number of occurrences for each case.
The objective of this study was to explore whether a conversion mixed design using a quan-titative approach could contribute to the determination of saturation in qualitative research, based on a new analysis of data from an existing qualitative study.
Presentation of the illustrative qualitative study
Existing data from a qualitative study were used to address our objective. This qualitative study aimed to investigate the impact of theClostridium difficile infection (CDI) on nurses’
work in the hospital.Clostridium difficile is a common source of antibiotic-associated diarrhea
publication fees. The funder of the illustrative qualitative study did not play any role in the study design, quantitative data analysis, decision to publish, or preparation of the present manuscript. The specific roles of the authors are articulated in the ‘author contributions’ section.
Competing interests: The authors declare that they
have no competing interests. At the time of the research, FF and AR were employees of ICON plc (formerly Mapi), which was paid by the funder to carry out the illustrative qualitative study. This does not alter authors’ adherence to PLOS ONE policies on sharing data and materials.
Abbreviations: CDI, Clostridium difficile infection;
MMR, Mixed Methods Research; NI, Nurse Interview; PLS, Partial Least Squares; PRO, Patient-Reported Outcomes.
and leads to nosocomial infection [30]. Semi-structured interviews of 12 nurses (six in France and six in the US) were carried out with the support of an interview guide. Nurses included in the study worked in an intensive care ward in the hospital or in a nursing home and had man-aged up to 60 cases of CDI in the year prior to the interview [30]. The qualitative researchers identified 67 themes spontaneously elicited from nurses during their interviews (S1 Table). In their published paper, the qualitative researchers followed the principle of data saturation to justify adequate sample size, using the following definition of saturation: “Saturation is consid-ered to have been attained for a concept when no new concepts or relevant information emerges with additional interviews” [30].
Materials and methods
Mathematical conceptualization of saturation
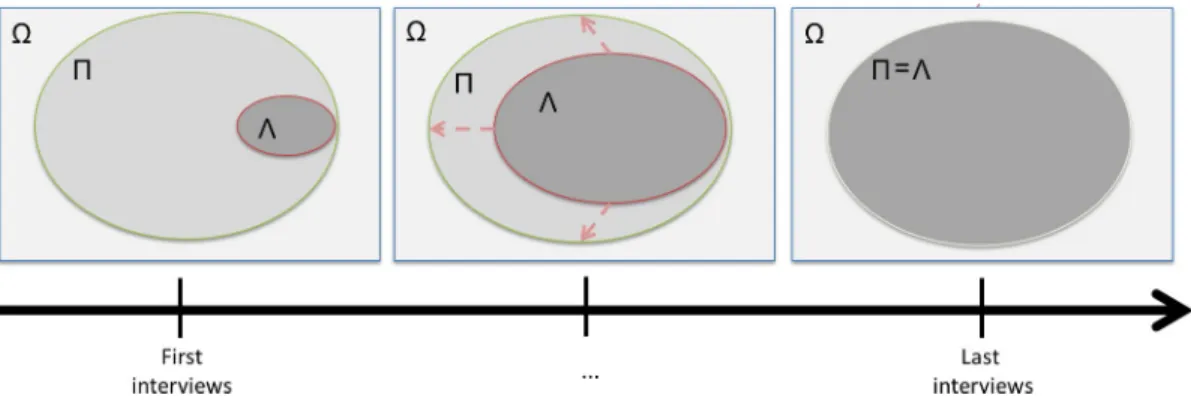
We started by conceptualizing saturation in a quantitative framework. For this purpose, the focus was shifted from sample size to number of themes and set theory was used (Fig 1). It was assumed that a universe of themes exists (O) in which there is a subset of themes of interest regarding the research question (P). During the interviews, there is a set of relevant themes that are elicited from interviewees (Λ), which grows as more interviews are conducted. In this framework, saturation is reached whenΛ = P. In this quantitative framework, a theme is con-sidered relevant if it brings a meaningful contribution in the answer to the research question.
Application of the conversion mixed design to the saturation question
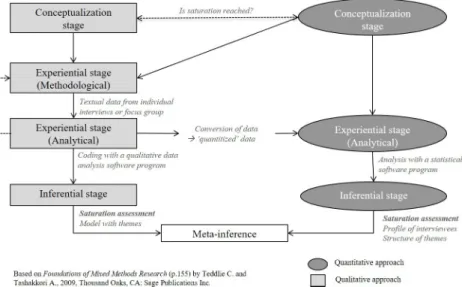
The schematic illustration of the conversion mixed design used for our research question is displayed inFig 2. The qualitative and quantitative approaches are presented in parallel. The common research question that both strands are addressing is: “Is saturation reached?”Qualitative strand for investigating saturation. The qualitative strand that was used in
the Guillemin et al. (2015) study on which this one is based followed a standard process to address the question of saturation [30]. Qualitative data were collected using the sequential order of the interviews and analyzed thematically, i.e. coded by the qualitative researchers, with saturation being declared when no new themes were forthcoming. Personal communica-tion with the first author of the paper (Dr. Guillemin), revealed that saturacommunica-tion had been dem-onstrated using a saturation grid. The coding process of the qualitative interviews was undertaken with the assistance of a qualitative data analysis software program (Atlas.ti).
Quantitative strand for investigating saturation. In our study, existing qualitative data
were quantitized to be used in the quantitative strand. Codes for each case were converted into
Fig 1. Schematic modeling of saturation in qualitative research using set theory. O = Universe of themes; P = Set of
targeted themes;Λ = Set of relevant themes elicited during interviews.
numerical data with the help of the qualitative data analysis software program [31,32]. The data conversion consisted in counting the codes used for each theme elicited during the inter-views, recording the number of times each was mentioned for each interview. This database was then used for the statistical analysis. In our study of saturation, partial least squares (PLS) regression was applied to allow the mathematical conceptualization of saturation as defined above to be operationalized. PLS regression is a statistical technique that models relationships between a set of dependent variables (Y) and a set of independent variables or predictors (X) [33–36]. PLS regression is known to be robust to both small sample size and high collinearity among the independent variables [37,38], which are often a problem when using quantitized data from interviews. The principle of PLS regression is to extract from X and Y a pair of latent components called PLS factors denoted (t,u), for which their covariance is maximal (t is orthogonal) [33]. PLS regression is sometimes described as a combination of principal compo-nent analysis (PCA) and linear multiple regression [33]. Several outputs are available for inter-pretation from PLS regression. First, the cumulative percentage of variation in themes
explained by PLS factors is an indicator comprised between 0 and 100 that can be interpreted as an R-square. Second, the correlation-loading plot is a graphical representation of the space defined by PLS factors in which can be presented both the observations and the variables. It also displays the correlation between the input X- and Y-variables and the PLS factors. [34,
35]. Third, the PLS ti/uiscore plot is the projection of the observations in the X-space (score ti)
and in the Y-space (score ui) according to the PLS factor i. It shows how well the Y-space
cor-relates with the X-space [34].
For the purpose of investigating saturation with PLS regression, the interviews were split into two blocks of interviews, categorized sequentially: the first block is composed of a large part of the interviews conducted (i.e. the first 75% interviews) and the second block comprised the remaining interviews. The objective is to estimate the difference between the set of themes of interest regarding the research question (P) and the set of relevant themes elicited during the interviews (Λ) by the difference between the first interviews and the last interviews (Fig 1). If the content of the first interviews explains largely the content of the last interviews, then this means that only marginal new additional information (themes) emerged from the last
Fig 2. Graphic illustration of the conversion mixed design adapted to the question of saturation. The qualitative
strand was completed prior to and independently of the present work.
interviews and that saturation was achieved. This PLS regression model can be written as fol-lows:
ðXjþ1. . .XnÞ ¼ ðX1. . .XjÞBPLSþE
Where:
■ Xjcorresponds to the vector of the number of times each theme is coded in the j-th
interview
■ BPLSis the vector of regression coefficients
■ E is the matrix of residuals
This model expresses the regression of the themes elicited in the set of last interviews (set of Xj+1-Xn) by the themes elicited in the set of the first interviews (X1-Xj). The PLS model was
performed using SIMCA software (formerly SIMCA-P) [39].
Meta-inference phase
The final stage in the conversion mixed design, as in any parallel mixed methods design, is the meta-inference based on combining or comparing the results of the two strands: in this case, whether the results provided by the quantitative strand regarding saturation are supportive to those obtained from the qualitative strand.
Results
Qualitative strand results
The authors of the qualitative analyses, which were reported earlier elsewhere, considered that saturation had been reached and that an understanding of how CDI affected nurses’ work was comprehensively captured at the end of the 12 nurse interviews (NIs) [30].
Quantitative strand results
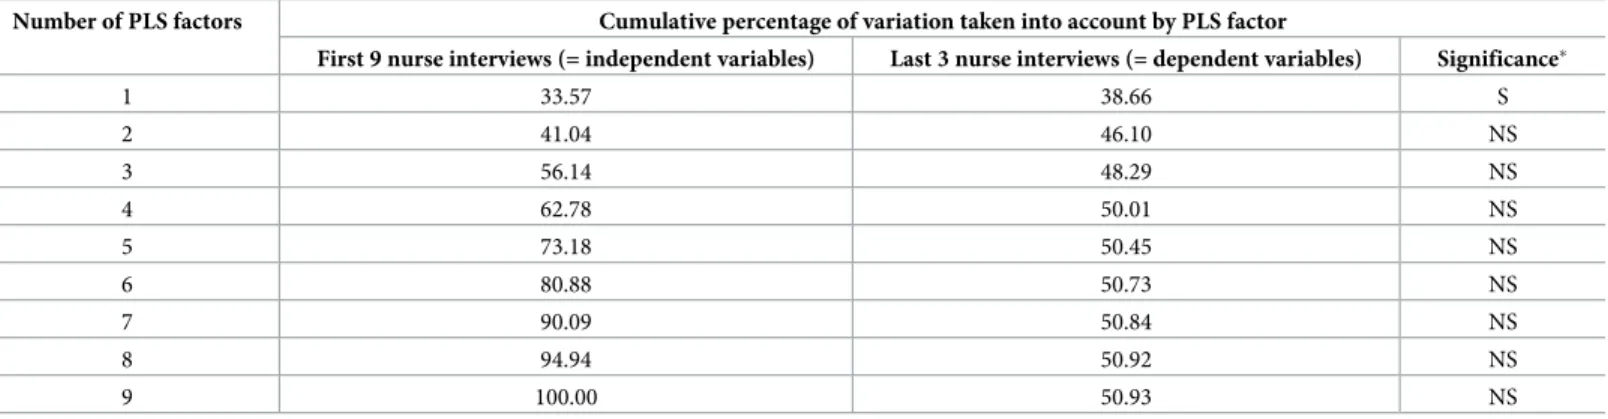
PLS regression was performed to link the block of the themes elicited in the last three NIs to the block of the themes elicited in the first nine NIs. The PLS factors summarizing all the themes from the first nine NIs explained 51% of the variability of the themes from the last three NIs (Table 1). Only the first PLS factor contributed at a significant level according to cross validation for both the block of themes of the first interviews and last interviews: it explained 34% of the variability of the first nine NIs and 39% of the variability of the last three NIs. For this first PLS factor, the underlying structure covering the themes elicited in the first set of NIs was predicting the underlying structure of the last NIs: this supports the conclusion that saturation was reached, at least on the main themes covered by that factor (see details below). A main theme was defined as a theme that was the most frequently elicited by nurses during their interviews and emerged as critical for nurses. Each of the other PLS factors also contributed roughly equally to the explanation of the total variability of the first nine NIs and marginally the last three NIs.
Combination of qualitative and quantitative strand results
(Meta-inference)
Both quantitative and qualitative results suggested that saturation was reached in this illustra-tive qualitaillustra-tive study. PLS regression showed that saturation was reached for at least main themes while qualitative results suggested that saturation had been reached.
Additional quantitative findings from the PLS regression analysis of the
quantitized qualitative data
PLS regression also allowed a more detailed exploration of the structure of the themes and the definition of profiles of the NIs, based on the first two PLS factors that captured most of the variability of the data. The association of the two blocks of NIs was observed using the correla-tion-loading plot of the two first PLS factors (Fig 3). The graph showed the association between the first nine NIs and the last three NIs: the closer NIs are on this plot, the more similar is their experience when caring for patients with CDI. Three groups of NIs were identified from the correlation-loading plot, which we called Group 1 (representing between 50% and 75% of explained variance), Group 2 (representing between 50% and 75% of explained variance) and Group 3 (representing between 25% and 50% of explained variance) on the graph. Nurses within each of these three groups shared common experience when caring for patients with CDI. Additionally, at least one NI of the last three NIs was present in each of the groups, which reinforces the evidence of saturation.
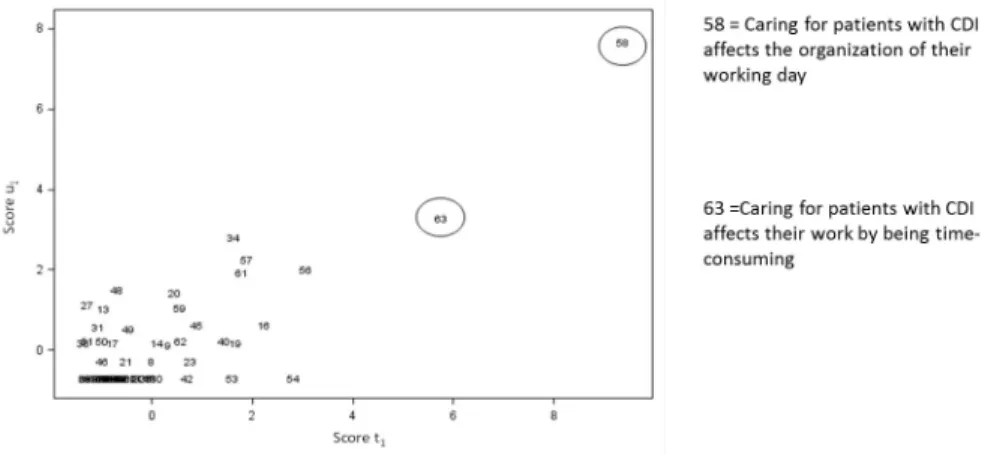
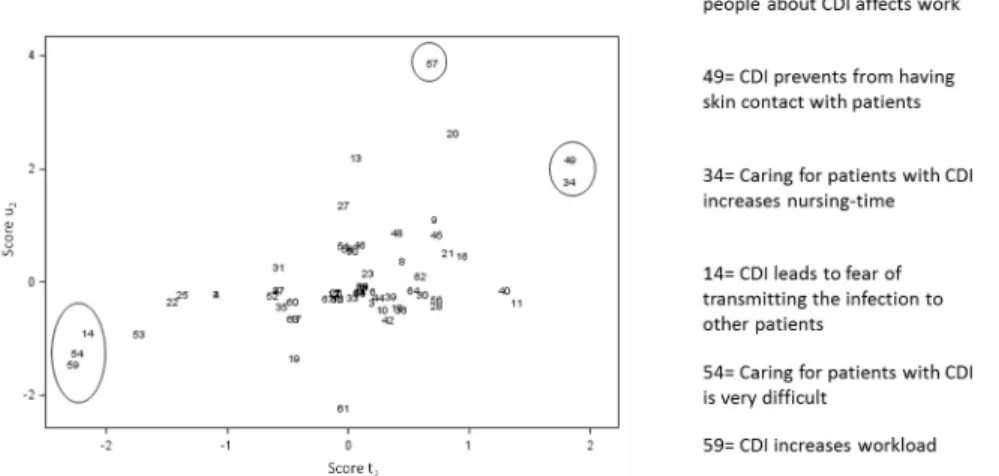
The interpretation of PLS regression requires the interpretation of what drives the creation of PLS factors: in our case, what are the themes that were contributing the most to the creation of these factors. This can be represented by the scatter plot of the projections of the themes in the space of PLS factors (Figs4and5). These figures, as a complement to the correlation load-ing plot, came to the followload-ing findload-ings: crucial themes for nurses from Group 1 and Group 2 were that caring for patients with CDI affected the organization of their working day (theme n ˚58 –Fig 4) and also affected their work by being time-consuming (theme n˚63 –Fig 4). NIs from Group 3 emphasized that caring for a patient with CDI increased their nursing-time (theme n˚34 –Fig 5) and prevented them from having skin contact with patients (theme n˚49 –Fig 5).
Discussion
The objective of our study was to explore whether a conversion mixed design could contribute to the determination of saturation in qualitative research. In the illustrative qualitative study, results showed that saturation had been reached after 12 interviews [30]. Our quantitative results corroborated in part this conclusion as we showed that saturation was reached for at least the main themes (i.e. themes that were the most frequently elicited across the NIs) in the
Table 1. Cumulative percentage of variation of the first nine nurse interviews and the last three nurse interviews taken into account by PLS factor (N = 67).
Number of PLS factors Cumulative percentage of variation taken into account by PLS factor
First 9 nurse interviews (= independent variables) Last 3 nurse interviews (= dependent variables) Significance�
1 33.57 38.66 S 2 41.04 46.10 NS 3 56.14 48.29 NS 4 62.78 50.01 NS 5 73.18 50.45 NS 6 80.88 50.73 NS 7 90.09 50.84 NS 8 94.94 50.92 NS 9 100.00 50.93 NS
�Significance was determined by cross validation atα = 0.05; S = significant; NS = non-significant
first nine NIs. PLS regression results showed that the theme-based factors for first nine NIs were able to explain 51% of variability in the last three NIs. By nature, interviews generate rich and complex information and explaining more than half of the between-interview variance in the themes elicited in this context is considered satisfactory. Besides, the first PLS factor, which explained respectively 34% and 39% of the variance of respectively the first NIs and the last
Fig 3. Correlation-loading plot of the relationships between nurse interviews overlaid with the themes in the 2 PLS factors space (N = 67). NI = Nurse Interview; Legend: Outer circle is the unit circle and indicates 100% of
explained variance. Inner circle indicates 25% of explained variance. Numbers represents all the themes elicited during nurse interviews.
https://doi.org/10.1371/journal.pone.0234898.g003
Fig 4. Projection of the themes in the space of the predictor score (t1) and the response variable scores (u1) according to the first PLS factor (N = 67).
three NIs, was significant according to the cross validation test. This shows that this solid, rep-licable factor covered a similar proportion of the variance in the two sets, which reinforces the indication of saturation being reached. Finally, in the correlation-loading plot, none of the three last interviews was an outlier compared to other interviews (which would have signified completely different interview content). The concordance of the results regarding saturation between the statistician and the qualitative researcher in this study strengthens our confidence in saturation being reached. While there are no absolute standards as to what constitutes an acceptable level of explanation of variance when using multivariate data analyses, 51% would generally be considered acceptable, especially as the first factor was found to be significant according to the cross validation test. We invite researchers who are willing to conduct similar work to compare their results with ours and we are hoping that accumulated evidence will help set standards for statistical analyses on qualitative data.
Since Morse pointed out that “there are no published guidelines or tests of adequacy for estimating the sample size required to reach saturation” [1], several researchers have attempted to address the gap in guidelines on how to operationalize saturation, as noted earlier. On one hand, these researchers included mainly theoretical considerations regarding the operationali-zation of saturation and proposed a benchmark to determine a priori when saturation might be reached [3,4,14]. Judgements about repetition of themes do not offer true operational solu-tions to qualitative researchers when they have to make a decision on saturation while quanti-tative approaches may lack generalizability as they may be context-specific (dependent on the research question or the targeted population for example) or based on strong assumptions that may not hold in actual qualitative research settings [5,11]. Our approach differs in that it offers a process that can be applied by a qualitative researcher to their own data to provide guiding information on when saturation is achieved. Other researchers who applied a quantitative approach to the question of saturation either used techniques that required a large number of interviews (more than 100) [13,15] or techniques that assumed statistical independence of observations (i.e., across interviews) [6], neither of which are reasonable in most qualitative research contexts.
Our solution based on a mathematical conceptualization of saturation using test theory and quantitative multivariate analysis of quantitized data used frequencies (i.e. numerical data) of the themes as input to quantitative analyses instead of binary occurrence (Yes/No). These
Fig 5. Projection of the themes in the space of the predictor score (t2) and the response variable scores (u2) according to the second PLS factor (N = 67).
frequencies were obtained through conversion using qualitative research software outputs to capture the frequency of occurrence of the theme while also providing information about how meaningful the theme was for the interviewee. This conversion of qualitative data into quanti-tized data does not come without assumptions: the frequency of a theme is seen as indicative of the importance of the theme for the interviewee but reduces the meaning of the theme into a fixed and single dimensional notion [40]. We acknowledge that this choice can be chal-lenged: 1) the frequency of the theme elicited may be driven by the course of the discussion and the speaking style of the interviewee, and 2) the use of frequencies distances from the typi-cal method of identifying saturation by the qualitative researcher. The possibility to adapt the quantitative multivariate analysis, especially the PLS regression, to analyze occurrence instead of frequency of themes could be further investigated.
Besides of the type of data used, other factors influence when the saturation has been reached. These include the research question which is of extreme importance, the interviewee characteristics, the relevant information obtained from each interviewee, the sampling strat-egy, the qualitative method used and how the data have been analyzed qualitatively [41]. In particular, the level of detail used in the coding exercise (“granularity” or unit of information) is at the core of the qualitative data conversion and is therefore critical for the interpretation of the results of the quantitative analysis. The smaller the unit of information (i.e. being captured by the code, with consequently a greater number of codes being used), the more difficult the demonstration of saturation will be. In addition, the initial coding strategy may be changed while the interviews happen, and some themes of special interest can be more developed, with always finer details and always more specific codes. As quantitative methods use the codes as input, their outputs, such as the percentage of variance explained for example, will be impacted by the granularity of the codes. However, as statistical methods such as PLS regression are designed to summarize information in large datasets, they might allow disentangling true information from noise and therefore be able to reliably inform decision on saturation even when the granularity of codes is small.
Our conceptualization of saturation requires different sets of information. For its operatio-nalization, these sets need to be estimated. For this purpose, we split the data from the inter-views into two blocks: the first three quarters of the interinter-views (i.e. the first nine NIs) constituted the first block and was presumed to represent the knowledge established by the research; the second block (i.e. the last three NIs) was constituted of the remaining quarter of the interviews and potentially represented new information. This split was done using the chronological order of interviews because the common sampling and analytical approach in qualitative research allows for emergence of new themes and the possibility that the coding may change over time, building on the experience of the qualitative researcher. This therefore meant that the most stringent test possible regarding the potential for differences in themes for the two groups was applied. Also, it was decided to use a group of interviews to characterize the new information and not a single interview (i.e. the very last one) because a single inter-view might be a complete outlier. Other specifications of our proposed approach are possible (e.g. different splits into interview blocks through an iterative process) and should be explored to determine the most appropriate way to provide supportive evidence on saturation.
For the quantitative strand of our MMR, PLS regression allowed our conceptualization of saturation to be operationalized, but it also provided useful additional information on the qualitative data by identifying interviewee profiles based on the themes they expressed. PLS regression features provided a detailed typology of NIs and the pattern of themes for both first and last NIs. For example, the various PLS outputs indicate that the two NIs from Group 1 (NI8 and NI9) and one nurse from Group 2 (NI10) were similar, despite being in different
groups, because each expressed the theme n˚58 (caring for patients with CDI affected the orga-nization of their working day) as something critical to them during their interview.
We focused on qualitative studies using individual interviews for data collection and the-matic analysis for analytical methodologies [30]. These are the typical features of a qualitative study in the health outcomes field. Further investigation will be needed to investigate whether our research can be applied in different qualitative research settings, with different qualitative data collection methods (e.g., focus groups, observations, logs, audiovisual material) or differ-ent qualitative analytical methodologies (e.g., grounded theory, phenomenology).
Finally, our research provides an application of MMR in the health outcomes field. We demonstrated how a conversion mixed design can provide additional insight on saturation in qualitative research. This expands the toolbox of MMR solutions to address health outcomes research questions. This example, in which a quantitative technique helps inform a typical qualitative question, also shows that qualitative and quantitative researchers can benefit from working closely together and comparing their perspectives. Doing so can lead to innovative solutions for the questions they routinely face in their research.
Conclusion
Our proposed conversion mixed design, applying PLS regression to data collected in a qualita-tive study, operationalizes a formal mathematical conceptualization of the core concept of sat-uration in qualitative research and allows additional supportive, quantitative evidence on saturation to be generated. In our case study, not only did our MMR approach strengthen the demonstration of saturation, it also provided useful substantial information on the research question. Hence, this application of conversion mixed design opens interesting perspectives for the exploration of data generated by qualitative research in the health outcomes field.
Supporting information
S1 Table. Themes elicited from the nurse interviews and used in the PLS regression analy-sis. NI = Nurse interview; Cdiff = Clostridium difficile infection.
(XLSX)
S1 Appendix. Quick guide to PLS regression model using SIMCA software.
(DOCX)
Acknowledgments
The authors gratefully acknowledge Sanofi Pasteur for allowing us to use their data for this present research. The authors also gratefully acknowledge Angelique Bonnaud-Antignac for her participation in the design of the present research and for bringing her expertise in qualita-tive research. The authors also wish to thank Isabelle Guillemin for providing additional details for the illustrative qualitative study, Benoit Arnould for providing insight in the present research and Michel Tenenhaus for his assistance in applying the PLS regression to our quali-tative data.
Author Contributions
Conceptualization: Fatoumata Fofana, Antoine Regnault. Data curation: Fatoumata Fofana.
Investigation: Fatoumata Fofana.
Methodology: Fatoumata Fofana, Pat Bazeley, Antoine Regnault. Resources: Fatoumata Fofana.
Supervision: Fatoumata Fofana, Antoine Regnault.
Validation: Fatoumata Fofana, Pat Bazeley, Antoine Regnault. Visualization: Fatoumata Fofana.
Writing – original draft: Fatoumata Fofana.
Writing – review & editing: Fatoumata Fofana, Pat Bazeley, Antoine Regnault.
References
1. Morse JM. The significance of saturation. Qualitative Health Research. 1995; 5(2):147–9.
2. Brod M, Tesler LE, Christensen TL. Qualitative research and content validity: developing best practices based on science and experience. Qual Life Res. 2009; 18(9):1263–78.https://doi.org/10.1007/ s11136-009-9540-9PMID:19784865
3. Francis JJ, Johnston M, Robertson C, Glidewell L, Entwistle V, Eccles MP, et al. What is an adequate sample size? Operationalising data saturation for theory-based interview studies. Psychology and Health. 2010; 25(10):1229–45.https://doi.org/10.1080/08870440903194015PMID:20204937 4. Guest G, Bunce A, Johnson L. How many interviews are enough? An experiment with data saturation
variability. Field Methods. 2006; 18(1):59–82.
5. Hennink MM, Kaiser BN, Weber MB. What Influences Saturation? Estimating Sample Sizes in Focus Group Research. Qual Health Res. 2019; 29(10):1483–96.https://doi.org/10.1177/1049732318821692
PMID:30628545
6. Lowe A, Norris AC, Farris AJ, Babbage DR. Quantifying thematic saturation in qualitative data analysis. Field Methods. 2018; 30(3):191–207.
7. Mason M. Sample size and saturation in PhD studies using qualitative interviews. Forum Qualitative Sozialforschung / Forum: Qualitative Social Research. 2010; 11(3).
8. Morse JM. Determining Sample Size. Qualitative Health Research. 2000; 10(1):3–5.
9. Onwuegbuzie AJ, Leech NL. A call for qualitative power analyses. Quality & Quantity. 2007; 41(1):105– 21.
10. Sandelowski M. Sample size in qualitative research. Res Nurs Health. 1995; 18(2):179–83.https://doi. org/10.1002/nur.4770180211PMID:7899572
11. Saunders B, Sim J, Kingstone T, Baker S, Waterfield J, Bartlam B, et al. Saturation in qualitative research: exploring its conceptualization and operationalization. Quality and Quantity. 2018; 52 (4):1893–907.https://doi.org/10.1007/s11135-017-0574-8PMID:29937585
12. Tran VT, Porcher R, Falissard B, Ravaud P. Point of data saturation was assessed using resampling methods in a survey with open-ended questions. J Clin Epidemiol. 2016; 80:88–96.https://doi.org/10. 1016/j.jclinepi.2016.07.014PMID:27492788
13. Tran VT, Porcher R, Tran VC, Ravaud P. Predicting data saturation in qualitative surveys with mathe-matical models from ecological research. J Clin Epidemiol. 2017; 82:71–8 e2.https://doi.org/10.1016/j. jclinepi.2016.10.001PMID:27789316
14. Turner-Bowker DM, Lamoureux RE, Stokes J, Litcher-Kelly L, Galipeau N, Yaworsky A, et al. Informing a priori Sample Size Estimation in Qualitative Concept Elicitation Interview Studies for Clinical Outcome Assessment Instrument Development. Value in health: the journal of the International Society for Phar-macoeconomics and Outcomes Research. 2018; 21(7):839–42.
15. van Rijnsoever FJ. (I can’t get no) saturation: a simulation and guidelines for sample sizes in qualitative research. PloS one. 2017; 12(7):e0181689.https://doi.org/10.1371/journal.pone.0181689PMID:
28746358
16. Tashakkori A, Creswell JW. The new era of mixed methods. Journal of Mixed Methods Research. 2007.
https://doi.org/10.1177/1558689807302453PMID:23785307
17. Regnault A, Willgoss T, Barbic S, International Society for Quality of Life Research Mixed Methods Spe-cial Interest G. Towards the use of mixed methods inquiry as best practice in health outcomes research. J Patient Rep Outcomes. 2017; 2(1):19.https://doi.org/10.1186/s41687-018-0043-8PMID:29757311
18. Bharmal M, Guillemin I, Marrel A, Arnould B, Lambert J, Hennessy M, et al. How to address the chal-lenges of evaluating treatment benefits-risks in rare diseases? A convergent mixed methods approach applied within a Merkel cell carcinoma phase 2 clinical trial. Orphanet J Rare Dis. 2018; 13(1):95.
https://doi.org/10.1186/s13023-018-0835-1PMID:29914528
19. Arbuckle R, Staunton H, Sully K, Tomkins S, Khindri S, Svedsater H, et al. Use of Both Qualitative and Quantitative Methods to Estimate Meaningful Change Thresholds for Key Endpoints in Pediatric Asthma Trials. Value in Health. 2019; 22(3):340–7.https://doi.org/10.1016/j.jval.2018.09.2845PMID:
30832972
20. Coon CD, Cappelleri JC. Interpreting change in scores on patient-reported outcome instruments. Ther-apeutic innovation & regulatory science. 2016; 50(1):22–9.
21. Parker S, Olivier S, Chakrapani A, Giugliani R, Heron B, Muschol N, et al. Capturing the MPS IIIA patient and family voice in orphan drug development to appreciate what is important in managing the disease and improving quality of life. Molecular Genetics and Metabolism. 2019; 126(2):S115.
22. Cleanthous S, Strzok S, Pompilus F, Cano S, Marquis P, Cohan S, et al. Addressing the targeting range of the ABILHAND-56 in relapsing-remitting multiple sclerosis: A mixed methods psychometric study. Mult Scler J Exp Transl Clin. 2018; 4(2).
23. Strzok S, Cleanthous S, Pompilus F, Cano SJ, Marquis P, Cohan S, et al. Development of a gait module to complement the 12-item Multiple Sclerosis Walking Scale: a mixed methods study. Mult Scler J Exp Transl Clin. 2018; 4(2).
24. U.S. Food and Drug Administration (FDA). Patient-Focused Drug Development: Collecting Comprehen-sive and Representative Input Guidance for Industry, Food and Drug Administration Staff, and Other Stakeholders 2018. Available from:https://www.fda.gov/downloads/drugs/
guidancecomplianceregulatoryinformation/guidances/ucm610442.pdf.
25. Creswell JW, Plano Clark VL. Designing and conducting mixed methods research. Thousand Oaks, CA: SAGE Publications Inc.; 2007.
26. Curry L, Nunez-Smith M. Mixed methods in health sciences research—A practical primer. Thousand Oaks, CA: SAGE Publications Inc.; 2015.
27. Guevel MR, Pommier J. [Mixed methods research in public health: issues and illustration]. Sante Publi-que. 2012; 24(1):23–38. PMID:22730607
28. Tashakkori A, Teddlie C. Handbook of mixed Methods in social behavioral research. Thousand Oaks, CA: Sage Publications Inc.; 2003.
29. Teddlie C, Tashakkori A. Foundations of Mixed Methods Research. Thousand Oaks, CA: Sage Publi-cations Inc.; 2009.
30. Guillemin I, Marrel A, Beriot-Mathiot A, Doucet C, Kazoglou O, Luxemburger C, et al. How do Clostrid-ium difficile infections affect nurses’ everyday hospital work: a qualitative study. Int J Nurs Pract. 2015; 21(Suppl. 2):38–45.
31. Bazeley P. Integrating analyses in mixed methods research London: SAGE Publications Ltd 2018.
32. Sandelowski M, Voils CI, Knafl G. On Quantitizing. Journal of Mixed Methods Research. 2009; 3 (3):208–22.https://doi.org/10.1177/1558689809334210PMID:19865603
33. Abdi H. Partial Least Squares (PLS) Regression. 2011.
34. Eriksson L, Johansson E, Kettaneh-Wold N, Wold S. Multi- and Megavariate Data Analysis. Umea, Sweden: Umetrics; 2001.
35. Martens H, Martens M. Multivariate Analysis of quality: An introduction. Chichester: John Wiley & Sons; 2001.
36. Tenenhaus M. La re´gression PLS: the´rorie et pratique. Paris: Technip; 1998.
37. Tenenhaus M, Pages J, Ambroisine L, Guinot C. PLS methodology to study relationships between hedonic judgements and product characteristics. Food quality and preference. 2005; 16(4):315–25.
38. Wold S, Ruhe A, Wold H, Dunn I, WJ. The collinearity problem in linear regression. The partial least squares (PLS) approach to generalized inverses. SIAM Journal on Scientific and Statistical Computing. 1984; 5(3):735–43.
39. Sartorius—Umetrics Suite. SIMCA [29 March 2020]. Available from:https://umetrics.com/products/ simca.
40. Sivesind KH. Structured, qualitative comparison. Quality and Quantity. 1999; 33(4):361–80.
41. Kerr C, Nixon A, Wild D. Assessing and demonstrating data saturation in qualitative inquiry supporting patient-reported outcomes research. Expert Rev Pharmacoecon Outcomes Res. 2010; 10(3):269–81.