7th ASAE CONFERENCE, HANOI
2011
AN ANALYSIS THE VALUE CHAIN OF FRESH MILK IN
THE NORTH OF VIETNAM - THE CASE STUDY IN SONLA
Bui Thi Nga(a)MA, Tran Huu Cuong(b)(*)PHD. Assoc Prof, Philippe Lebailly(c)PHD. Prof
(a) Student, University of Liège, Belgium
(b) Faculty of Accounting and Business Management, Hanoi University of Agriculture, Vietnam (c) Gembloux Agri Bio Tech, University of Liege, Belgium;
ABSTRACT
Vietnam locates in the most active region (Asia), where gains the highest economic growth rate and highest milk consumption in the world. Milk growth rate is higher than almost other agricultural products in the past 10 years in this region (Nancy, 2008). Vietnam is also one of the highest milk productivity in the Asia. Milk consumption in Vietnam is increasing rapidly (Nancy, 2008). However, the dairy industry in Vietnam is currently able to meet only 22 percent of domestic demand; the remaining amount has been imported from overseas suppliers and producers (VOV News/VNA, 2008). In addition, the linkages among the actors and stakeholders in the value chain of milk in the North of Vietnam are very weak. It leads to low effective in the production of the whole chain. This paper based on semi-structure, standard questionnaires and PRA method to collect data of dairy farms in Sonla province, of milk collecting centres, of dairy plan and of milk distributors in 2008-2010. The findings show that dairy plan is the most powerful actor in the chain and it drives the whole chain. The value added of the chain is distributed unequally among determinants in the bias orientation to the non-farmer (non-producer). Opportunity cost of land, capital, and family labor in farm does not include when they calculate their benefits, thus it is not reflect the real situation and their value added would be much lowers. Weak linkages among participants in the chain with stakeholders and insufficient supports discourage farmers to develop their production.
ARTICLE CONTENT
INTRODUCTION ... 4
1. SAMPLING AND DATA... 5
2. MILK MARKET IN VIETNAM... 7
2.1 MILK CONSUMPTION... 7
2.2 MILK PRODUCTION... 9
2.3 IMORT QUANTITY OF MILK... 11
2.4 MILK PRICE... 13
3. VALUE CHAIN – A NEW APPROACH TO STIMULATE MILK PRODUCTION: THE CASE STUDY IN SONLA ... 14
3.1 DAIRY MILK PRODUCTION IN MOC CHAU... 15
3.2 THE MILK CHAIN IN MOC CHAU AND THE FUNCTION OF ITS ACTORS... 19
3.3 MILK DISTRIBUTION CHANNEL... 21
3.4 VALUE CHAIN OF MILK... 22
4. CONCLUSION AND POLICY IMPLICATION ... 23
I
I
N
N
T
T
R
R
O
O
D
D
U
U
C
C
T
T
I
I
O
O
N
N
Dairy is becoming one of the most important ways to achieve sustainable development for agriculture in Vietnam (Bogdan Krol, 2008). Milk from cow is a good and important source for improving the nutrition and health of Vietnamese. Since agriculture is mostly seasonal, there is a possibility of finding employment throughout the year for many small farmers and agricultural labourers through dairy farming. In addition, milking is almost produced daily; it generates stable income for them. The surplus fodder and agricultural by-products are gainfully utilised for feeding the cow. The manure from cows provides a good source of organic matter for improving soil fertility and crop yields. The bio gas from the dung is used as fuel for domestic purposes such as cooking and running engines, drawing water from well.
However, milk production in Vietnam is facing many difficulties, especially in the integration era. Their production is affected by fluctuated output price; high competition from imported milk; high and increasing price of input factors (Viet, 2008). Situation of unsecured food safety and loosen quality control in Vietnam recent years (for instance: Melamine) led to a reduction in social beliefs which in turn led to the fluctuation in milk consumption. This discourages them to improve the quality and quantity of milk production.
This study analyse the milk market in Vietnam based on the microeconomics aspect to see how could be done to improve the domestic milk production through the promoting the whole value chain of fresh milk; find out the key actor, functions and linkages of actors and stakeholders along the milk chain; see how the value added of the chain distributes among determinants in the chain and how to increase the value added and benefits for dairy farmers.
1
1
.
.
S
S
A
A
M
M
P
P
L
L
I
I
N
N
G
G
A
A
N
N
D
D
D
D
A
A
T
T
A
A
The choice of study sites was based on the condition of dairy milk production in Vietnam. Vietnam has a tropical monsoon climate with average relative humidity of 84-100%. Vietnam also suffers from many natural disasters such as storms, flood, drought yearly. The natural condition is not favor of dairy industry. Thus, dairy cow in Vietnam has concentrated on provinces in two main regions Northern and Southern region where are suitable to raise cow as presented in figure 1.
Figure 1 The study site
Source: GSO, 2011; Dairyvietnam.org.vn
Sonla is chosen to study as it is the main dairy cow development province in the North. This province accounts for nearly one third in term of numbers of dairy cow and occupies nearly a half in term of milk production in the Northern region. It ranks the third in the top 10 provinces that have the largest numbers of head cow in Vietnam1. In Sonla, most of dairy cows have been grown in Moc Chau. This district accounts for around 80% total
1
The first rank belong to HCMC, the second is Long An. Sonla ranks the third, then following by Tuyen Quang, Ha Tay (Hanoi nowaday), Binh Duong, Binh Dinh, Lam Dong and Thanh Hoa
Northern region: 16992 heads cow; 37344 Sonla: 5136 heads cow; 16887 tons milk
head cow and over 90% milk quantity in Sonla. It is also a well-known place of dairy husbandry and milk production in Vietnam. It has a trademark named “Moc Chau milk”.
A sample of 50 dairy households/farmers (hereafter called dairy farmers) was surveyed in this study. Surveyed farms are chosen to represent the general milk production in the region. Farms were classified into three types. The first is small farm size who grows less than 10 dairy cows. The second is medium farm size who grows from 10 to 15 cows. The third is large farm size that is defined to be more progressive in dairy production and has more than 15 cows.
The selection sample was based on the status of farm which was represented the total dairy situation in the region such as herb size, economic situation, milk yield, etc. The numbers of investigating farms account for 11% total dairy farmers and 10,2% total heads cow in the region. The average farm size in the investigated sample is 13 milky cow, approximately the average number of 12,44 milky cow in the region. The average large farm size of investigating farms is 28%2. The average numbers of dairy cow in investigated farms of medium size and small size are 42%3and 30%4, respectively.
The study also surveyed 3 over 8 milk collecting centers in the region; 1 over 1 dairy plan and 4 middle men, 3 distributors.
In order to collect the primary data for this study, four field trips had been taken place. The first one was carried out in May 2008 to collect overview and qualitative information of the study site. The second field trip was conducted in July 2009 to define the specific study areas (which place? Which unit? which villages) and choose dairy households, collectors, distributors. The main results of this step was able to describe the characteristic of the chain actors, flow of information, flow of products, supporting systems. After this trip, three sets of questionaire and some basic interview guideline were performed. The third field trip
2
The average for large size group in the region is 26% 3
The average for medium size in the region is 45% 4
occurred in April 2010 to test the questionnaires. This step helped to establish the official questionnaire: After testing the survey, certain corrections were done to finalize the questionnaires for the survey.
The fourth trip was the main survey and carried out in July and August 2010 to collect data in farms, milk collectors and distributors through standard questionnaires. The questionnaire is performed to collect information about socio-economic status and characteristics of chain actors; information on milk production, milk flows; Market and linkages for milk production, and social-economic issues related to improved milk production.
Data in dairy plan were collected through orientated interview with leaders of the dairy plan and their reports. Informal conversational interview was used to gain an overall insight of different problems in the target study sites. PRA/RRA method are applied to dairy farmers, local officers and extension workers to collect socio-economic, production experiences as well as extension network for dairymen.
Beside primary data, secondary data are collected from many sources of previous studies, statistic census from the Statistical offices and Department of agriculture and rural development from district, provincial and national levels; from other national and international projects which have been implemented in the study areas, etc.
2
2
.
.
M
M
I
I
L
L
K
K
M
M
A
A
R
R
K
K
E
E
T
T
I
I
N
N
V
V
I
I
E
E
T
T
N
N
A
A
M
M
2
2
.
.
1
1
M
M
i
i
l
l
k
k
c
c
o
o
n
n
s
s
u
u
m
m
p
p
t
t
i
i
o
o
n
n
The economy of Vietnam has grown gradually over time from the Doi Moi5 (innovation). Since 2005, Vietnam has become the second country in Asia who gained the fastest economic growth rate of exceeded 8 percent per year (GSO6, 2011; Nancy, 2008)7.
5
In 1986 6
General Statistic Office of Vietnam (GSO)
Thank to the government’s commitment to market liberalization and further reforms of the legal, financial and institutional systems, the development of Vietnam has become amazing facts of the world. In 2010, the Gross Domestic Products (GDP) of Vietnam at current price was 1658.4 billion Vietnamdong (VDN) increased 3.75 times (was 516.57 billion VND at constant price8, increased 1.9 times) compared to those of 2000 (GSO, 2011)9. GDP per capital rose from 5.7 million VDN (402 USD) in 2000 to 19.3 million VND (1064 USD) in
2009
(
GSO, 2011), resulted in the increase in the Vietnamese living standard. The highincome growth rate has stimulated the milk consumption in Vietnam. Vietnam became one of the countries that have the highest milk consumption growth rate in the Asia region, just ranks after Chine (figure 2).
Figure 2Milk consumption in comparison with the increase in income in the period of 1996-2006 Source: Nancy, 2008
The quantity of milk consumption throughout country went up quickly. Within 20 years from 1990 to 2010, it increased 41 times. In 1990, Vietnameses consumed only 31 thousand tons milk. On average, each Vietnamese consumed 0.5 kg milk a year. In 1995, total milk consumption of Vietnam was 260 thousand tons, and milk consumption per capital
8
At constant price 1994 9
At: http://www.gso.gov.vn/default.aspx?tabid=388&idmid=3&ItemID=9897, consulted on 29/08/2011
Mongolia India US Phillippine Asia NZ China Vietnam -2 0 2 4 6 8 10 12 14 16 0 2 4 6 8 10
Income growth rate Milk consumption growth rate
went up to 3.6 kg per head. In 2000, total milk consumption was 460 thousand tons and per capital was 5.9 kg per head. The amount continuously rose and achieved 8 and 14.8 kg per capital in 2005 and 2010, respectively.
0 200 400 600 800 1000 1200 1400 1990 1995 2000 2005 2010 1 0 0 0 t o n n e
Figure 3 Milk consumption 1990-2010
Source: Nancy, 2008; GSO, 2011; FAOSTAT, 2011.
2
2
.
.
2
2
M
M
i
i
l
l
k
k
p
p
r
r
o
o
d
d
u
u
c
c
t
t
i
i
o
o
n
n
The numbers of dairy cow and quantity of milk production in Vietnam increased steadily over years in the period of 2000-2010 (figure 4). From 2000 to 2004, the numbers of dairy cow increased quickly at average growth rate of nearly 30% per year from 35 thousand to 95.8 thousand heads. There are two reasons of this rapidly enlarge in numbers of cow. The first reason was due to the rapidly increasing demand for milk over that period. The second one was thank to the implementation of the Resolution 09 and Decision 16710. This strategy has created condition and opportunity for development in Vietnam. It stimulated and promoted the Vietnamese farmers to raise cows. The farmers bought dairy cow to grow and kept their newborn calves for future milk production.
10
In 2000s, there was a breakthrough of dairy development in Vietnam with the appearance of Resolution No.09/2000/NQ-CP promulgated on the 15th
of June, 2000 and the Government Decision No.167 dated October 26, 2001. The Resolution had created a new policy condition for expanding the dairy herd to 100,000 milking cows and production of 300,000 tons fresh milk yearly. The Decision built a production and development strategy for dairy cattle for period 2002-2010. This strategy defined the targeted areas for raising dairy cow in Vietnam including 10 provinces in the North, 5 provinces in the Central Coastal region, 4 provinces in the Central Highlands and 7 provinces in the South.
Beside the accumulated increase in the numbers of domestic dairy cow, at the starting point of these Resolution and Decision’s implementations, numbers of imported dairy cow also increased very fast from 192 heads cow in 2001 to 5581 heads in 2003 (USDA, 2005). These imported cows also contributed to the rapidly increase in the numbers of dairy cow that period.
In 2005 and 2006, the growth rate of dairy cow was 8.7% per year. In 2007, many provinces observed the failure in dairy program because of massive development of dairy cow in almost provinces. This situation resulted in the inefficient milk production due to the low technique, less experience and infovorable conditions. Dairy cows in somewhere became a burden for many farmers as they could not repay their bank loan. In many regions in Vietnam at that time, the dairy cow keepers had to sell out or turned from dairy cow into beef cow. As a result, the quantity of cow reduced. With the restructure of dairy program, accompany with the increasing quickly in the demand for milk; the numbers of dairy cow recovered from 2008 until now. In 2010, Vietnam had 128.5 thousand heads. On average, numbers of dairy cow increased 14.85% per year during last decade.
0 50 100 150 200 250 300 350 2000 2001 2002 2003 2004 2005 2006 2007 2008 2009 2010
Dairy cow (1000 head) Quantity of dairy milk (1000 tonne)
Figure 4Quantity of dairy cow and milk production in Vietnam 2000-2010 Source: FAOSTAT, 2011; NIAH, 2011
Quantity of fresh dairy milk also augmented in the same period (figure 4). In 2000, total dairy milk production in Vietnam was only 51,458 tons but in 2010, it was 6 times higher with the amount of 306,662 tons. Because of the increase in numbers of head cow, the amount of milk production in the period 2000 - 2005 went up quickly at average growth rate of more than 30% annually. Although the numbers of head cow decreased in 2007, the amount of milk production still went up at nearly 10%. The explanation was due to the higher experience in cow rising of the farmers and the exploitation of many dairy cows at the highest productivity period. On average, milk production increased 20.45% per year in the last decade.
2
2
.
.
3
3
I
I
m
m
o
o
r
r
t
t
q
q
u
u
a
a
n
n
t
t
i
i
t
t
y
y
o
o
f
f
m
m
i
i
l
l
k
k
Although the quantity of milk production in Vietnam increased gradually overtime, the milk supply can not satisfy the very quickly enhance in the demand for milk. Amount of milk consumption is much higher in comparision to the quantity of production (figure 5). Dairy output could only satisfy 28% in 2009 and 25% in 2010 of total consumption (GSO, 2011). The difference between the consumption and production amount had been fulfilled by the imported value.
Milk production vs consumption
0 200 400 600 800 1000 1200 1400 1990 1995 2000 2005 2010 1 0 0 0 t o n Milk production Milk consumption
Figure 5 Milk consumption versus production per capital 1990-2005
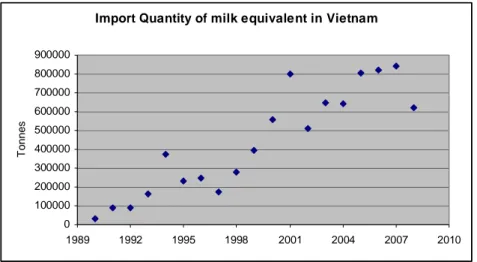
Although there seemed cycle fluctuations, the import quantity of milk equivalent in Vietnam tends to increase over time (figure 6). The import quantity increased quickly from 34 thousand tonnes in 1990 to 372.8 thousand tonnes in 1994. Athough there was any evident but this situation might be explained by the facts of normalization and establishment of relation between Vietnam and United States. The number reduced to 233.7 thousand tonnes in 1995 because of the low economic development. After a litle recover in 1996 to 247 thousand tonnes, it felt down to 175.8 tonnes in 1997, may be under the indirected impact of Asian crisis. After that, the import quantity went up quickly to 800.5 thousand tonnes in 2001. From 2002, the numbers went down to 513 thousand tonnes. This could be affect by the dairy strategy (Resolution 09 and Decision 167). However, the dairy growth was lagged because it took time to milk a cow while the demand for milk increased quickly. Thus the quantity of milk imported went up again from 2003 to 2007.
Import Quantity of milk equivalent in Vietnam
0 100000 200000 300000 400000 500000 600000 700000 800000 900000 1989 1992 1995 1998 2001 2004 2007 2010 T o n n e s
Figure 6 Import quantity of milk equivalent in Vietnam 1990-2008 Source: FAOSTAT, 2011
In 2008-2009, there was a melamine milk crisis in the Asia region, the customers in general and Vietnamese customers in particular reduced their amount of consumption because they were worried and afraid of health affected. Besides, some companies had cheated domestic customers by imported cheap dry milk and skemmed dry milk (the highest
milk imported value to Vietnam) then reconstituted into fresh milk and pasturised milk to sell at high price in the market in the the same period. This led to the quickly reduction in the imported value of milk in these years.
In the market of imported milk products, New Zealand is the largest dairy exported country to Vietnam, account for nearly one third market share. Holland ranks the second and followed by United State, Malaysia, Australia and Thailand. Six these large exported countries account for around 70% market share (HBBS, 2010). The situation of foreign domination in the milk martket sometime led to the manipulation of milk price in Vietnam.
2
2
.
.
4
4
M
M
i
i
l
l
k
k
p
p
r
r
i
i
c
c
e
e
There were different points of view on milk price in Vietnam. Some researchs stated that consumers’ milk price in Vietnam is on top of the world (Luan, 2008, IFCN, 2004). Some others proved that there was no evidence of the highest price, and showed that prices in Vietnam were within the range of neighboring countries (Jonathan, 2010)11. However, from these analyses, it is the fact that, the retail or consumers’ price in Vietnam is relatively higher compared to the producers’ price; compared to other agricultural goods and compared to the income. Farm – gate price varies considerably among different processors (Nancy et al, 2006). Result from IFCN (2004) and Patrice (2008) research showed that the Energy Corrected Milk price paid in Vietnam was constant for a decade and was lower than that of Thailand and Bangladesh and slightly lower than in India but higher than price in Pakistan. Moreover, the milk markets in Vietnam are imperfect competitive. It is difficult for consumers to access to complete information about the products that they buy. The control of product quality and safety by government agencies is deficient (Jonathan, 2010).
11
He compared the milk price of Ho Chi Minh to that of Changhai, HongKong, Jakarta, Kuala Lampur, Singapore and Bankok. Although there was not clear evidence that price in Vietnam is higher than that in those countries but, I think that, relative price in Vietnam is higher because all of these study sites have higher income per capital compared to Ho Chi Minh.
Vietnam had already issued a regulation on price registration and control in 201012in order to reduce or stabilize prices of many products including dairy products. The policy makers believes that dairy companies raise powdered milk prices because of too much expense on advertising and promotion. However, results from Jonathan study (2010) reported that price registration and control would not lower or stabilize the prices. He pointed out two reasons for his statement. First, the unexpected immediate impact of the new policy would be to increase prices because dairy companies have raised prices before the implementation date of the new circular to avoid the need to re-register prices when the policy comes into effect. The second reason was the high administrative costs of registering input, output, wholesale and retail prices thus dairy companies will not pass these additional costs on to consumers. However, we do hope that this regulation is the opening point for future success in control the milk price in Vietnam.
With the exceeded, high and increasing demand for milk, Vietnam has to import a lot of milk yearly. This not only will lead to low social resources allocation but also make Vietnam depended on the foreign market. This is disadvantage for both domestic producers (dairymen) and customers, as well. Thus, it is really significant to develop domestic production for overcome this situation.
3
3
.
.
V
V
A
A
L
L
U
U
E
E
C
C
H
H
A
A
I
I
N
N
–
–
A
A
N
N
E
E
W
W
A
A
P
P
P
P
R
R
O
O
A
A
C
C
H
H
T
T
O
O
S
S
T
T
I
I
M
M
U
U
L
L
A
A
T
T
E
E
M
M
I
I
L
L
K
K
P
P
R
R
O
O
D
D
U
U
C
C
T
T
I
I
O
O
N
N
:
:
T
T
H
H
E
E
C
C
A
A
S
S
E
E
S
S
T
T
U
U
D
D
Y
Y
I
I
N
N
S
S
O
O
N
N
L
L
A
A
It is obviously unable to develop the dairy individually in Vietnam because milk market in Vietnam does not develop fully (Jonathan, 2010). The dairy farmers cannot sell all of their milk without any help of milk collectors, milk processors (dairy plant) and distributors. Therefore, promote the whole chain of milk will be an effective and sustainable approach to develop dairy industry in Vietnam,
12
On August 12, 2010 the Ministry of Finance issued Circular 122/2010/TT-BTC on the registration and regulation of prices. The new regulations, which come into effect on October 1, 2010, cover a range of key consumer and producer goods, including milk and milk powder; (http://vbpq.mof.gov.vn/download.aspx?Docmain_ID=31730).
3
3
.
.
1
1
D
D
a
a
i
i
r
r
y
y
m
m
i
i
l
l
k
k
p
p
r
r
o
o
d
d
u
u
c
c
t
t
i
i
o
o
n
n
i
i
n
n
M
M
o
o
c
c
C
C
h
h
a
a
u
u
Moc Chau started to raise cow in 1958 with only 10 cow; productivity 4 kg per day per cow and produced 12 tons milk a year (Anh et al., 2009). Numbers of cow, milk yield and production increase rapidly and continously yearly.
Table 1Major data of dairy milk production in Moc Chau Year No of HHs/ farms Total head cows (cow) Total dairy cows (cow) Fresh milk production (1000 tonne/year) Average milk yield (kg/cow/ day) Average farm size (head cow/farm) 2008 503 4,579 4,154 12,507.5 16.9 9,10 2009 491 5,735 5,237 19,675.7 20.21 11,68 201013 483 6,396 5,907 22,111.5 20.38 13,24
Source: Department of production and business14
The numbers of dairy farmers decreased from 2008 (503 farms) to 2010 (483 farms). In comparison to 2008, the numbers of farm reduced 2.4% in 2009. The numbers continued reducing 1.65% in 2010 compared to 2009. These decreases can be explained by three main reasons. The first is the reduction in the land areas in the region. Since 2009, this region has spent a large land area for a new administration building and for implementing the Japanese project. Secondly, some farms have to stop their production because of the lack of human resources15. Thirdly, because dairy farming is really hard working and capital insentive, some small farm linkage together to become greater farm in order to exploit the economy of scale.
Dispite the reduction in the numbers of farms, the quantity of dairy cow milk increased in the same period at the average annual growth rate of 11 to 20%. The average herb size increased 11 to 22% because the farmers expand their production by keeping the new born calves. At the same time, the milk yield went up 8 to 16% per year thank to the training and technical supports. The herb size in this region is larger than many other regions
13
By June 2010
14
Moc Chau milk and bread Joint stock Company
15
in Vietnam and is considered to be large enough to exploit the economy of scale. This inturn pushed up the amount of milk output from 11 to 36%. The growth rate of dairy production in this region seems really good.
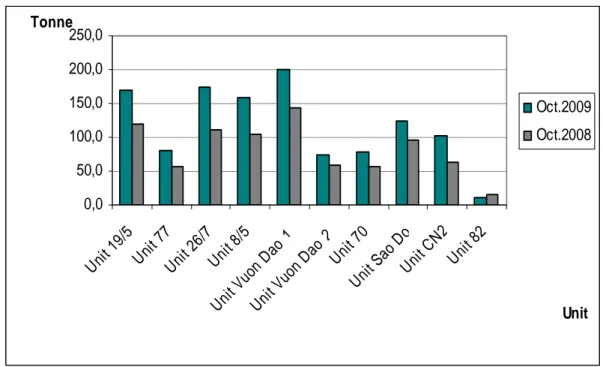
There are 10 production units in this region (figure 8). Unit Vuon Dao 1 is not only the largest unit in term of numbers of head cow but also in term of amount of milk production. Its output account for 17% total milk production in the region. Uit 19/5 is the second among largest milk production unit with 170 tons in October, 2009. The quantity of milk production increased in all of the Units in the region at high growth rate, except Unit 82. On average, 9 Units grew at 43% per year. Unit CN2 had the highest growth rate at 62%, followed by Unit 26/7 (55%); Unit 8/5 (51.8%) while unit 82 decreased 26.5%.
Bibliography
Figure 7 Milk production by units
Source: Department of production and business
It is the fact that Moc Chau has a very good natural condition for dairy cow development. At altitude 1050m higher than the sea level, Moc Chau highland has the temperate weather with the average cool climate of around 200C. It is good condition for
0,0 50,0 100,0 150,0 200,0 250,0 Uni t 19/ 5 Uni t 77 Uni t 26/ 7 Uni t 8/5 Uni t Vuo n D ao 1 Uni t Vuo n D ao 2 Uni t 70 Uni t Sao Do Uni t CN 2 Uni t 82 Unit Tonne Oct.2009 Oct.2008
dairy farming. After a longer time of dairy farming than almost other regions in Vietnam, Moc Chau is famous of fresh milk and tea production recently.
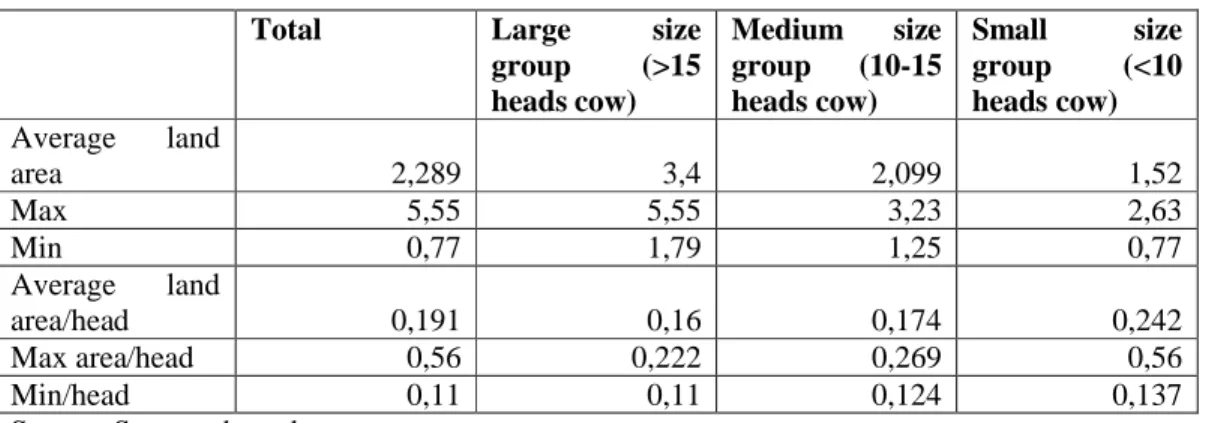
The land area for raising cow in this region is much wider than most other regions in the North of Vietnam. The land area of dairy farm by the time of investigating is presented in table 2.
Table 2 Land areas of farms (ha)
Total Large size
group (>15 heads cow) Medium size group (10-15 heads cow) Small size group (<10 heads cow) Average land area 2,289 3,4 2,099 1,52 Max 5,55 5,55 3,23 2,63 Min 0,77 1,79 1,25 0,77 Average land area/head 0,191 0,16 0,174 0,242 Max area/head 0,56 0,222 0,269 0,56 Min/head 0,11 0,11 0,124 0,137
Source: Surveyed results
There is a difference in land area among different herb size groups in Moc Chau. Average land area of large size group is larger than those in the medium size group and small size group. On average, a large size group has twice land as the small ones. However, the average land area per head cow in the large size group is at least. One cow in the large size group has only 0.16 ha, smaller than those of medium and small size group. The small size group has the largest land area per cow. The maximum land area per cow in large size group is less than a haft of those in small size group.
This situation can be explained by two reasons. The first reason may be, the large size group has more experience and produces more efficiency than those of the other groups. The second reason could be, the large size group can exploit the economy of scale in term of land area. When they increase the herb size, their land area for cow will be reduced and the production becomes more efficiently.
Although Moc Chau has been experienced for raising cow for more than 50 years (from 1958), the most experience of surveyed farmers are around 20 years. Before 1991, cows were raised in state-own coorperative farms. In 1989, a trying sample of 5 farms was assigned to farmers for raising cow at their farms. In 1991, with the stimulation of the success in 1989’s sample, 15 other farms were assigned to raise cow at farm level. Since then, the dairy cows were distributed to farmers to rise at their farm. Before 2001, dairy cow did not develop because of low consuming level. At that time, Moc Chau did not process milk. They collected milk from farmers and then deliver to Vinamilk. While the milk consumption in Vietnam was increasing, Sonla still faced difficulty in consuming their milk because it was too far from the center with difficult access and deficient cooling system. The first decade of 21stcentery observed the quickly increase in the demand for milk, especially fresh milk. The increasing in demand had stimulated milk production. In 2001, a thousand of HF dairy cows had been imported from Australia to rise in Moc Chau. At first, due to the large land area 1 ha was supposed to grow 2 cows. Then 3 cows, 5 cows and now it is popular for raising 7 cows per ha. Some farms has density of 10 cows/ha.
Total investigating farm is 50 with total 651 head cows (account for 11% total farm and 10.2 % total head cow). The average farm size is 13 milky cows per farm. The farms are classified into three groups based on the number of head cow as showed in table 10.
Table 3 Farm size
Total Large size group Medium size group Small size group Average farm size 13,02 21,29 12 6,73 Max 35 35 15 9 Min 2 16 10 2
Source: Surveyed results
Large farm size includes 14 farms and accounts for 28%. The maximum farm size in term of head cow has 35 head cows. The average number of head cow in this group is 21.29. The least farm has 16 head cows. Medium size consists of 21 farms which accounts for
largest proportion at 42% total surveyed farms. The average head cow in this group is 12. Small size contains 15 farms and account for the rest 30% of farms. On average, each farm in this group has 6.73 head cow. The least farm has only 2 cows.
In the survey farms, there is more than a haft of milky cows, the rest are female calves. The proportion of milky cow is higher than that of female calves in large size group. But in medium and small size group, the proportion of female calves is higher. This happens because the small and medium sizes are trying to expand their herd size. While the large size cannot expand their size because of the limitation in resource, especially land resource.
3
3
.
.
2
2
T
T
h
h
e
e
m
m
i
i
l
l
k
k
c
c
h
h
a
a
i
i
n
n
i
i
n
n
M
M
o
o
c
c
C
C
h
h
a
a
u
u
a
a
n
n
d
d
t
t
h
h
e
e
f
f
u
u
n
n
c
c
t
t
i
i
o
o
n
n
o
o
f
f
i
i
t
t
s
s
a
a
c
c
t
t
o
o
r
r
s
s
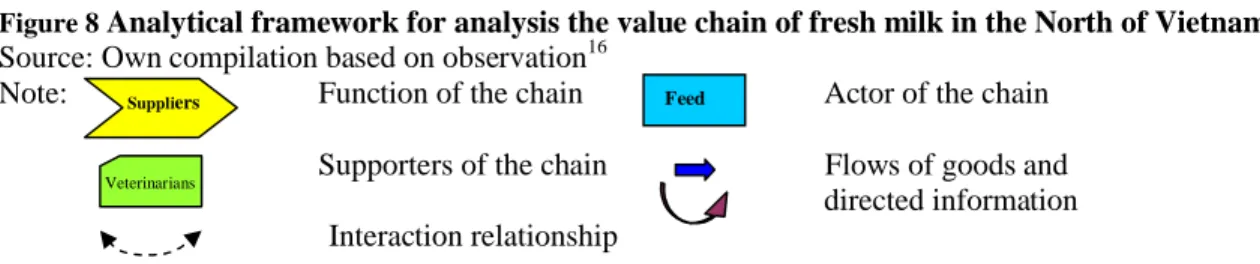
There is one major supplier of heifers, grasses, feed, proteins, etc for dairy farmers in the region. This supplier is belong to Moc Chau Company and has very close relationship to the dairy plan. Besides, there are some small and insiginicant private input suppliers for dairy farmers. Similarly, there is only one company, the DeLaval, supplied machineries to farmers. Although there are some local blacksmiths and mechanists supplied some machinery, most of machineries for milking production are supplied by the DeLaval.
Producers
Suppliers Bulk and
cooling Processing and packaging Transport & distribution Feed, Heifers
Machines… Dairy men
Milk collectors Wholesaler Shop agents Show room
Dairy
plant
Projects and NGOs: - Vietnam Belgium Dairy Project - JICA projects - MARD projects
Policy framework:
- National law and policy - Decrees, - Decisions - Guidance documents Supporters: Veterinarians Sanitary epidemiologi Consumers: - Domestic consumers - Foreigners Internationa Middle men - Small shop Retailers
Figure 8Analytical framework for analysis the value chain of fresh milk in the North of Vietnam Source: Own compilation based on observation16
Note: Function of the chain Actor of the chain
Supporters of the chain Flows of goods and directed information Interaction relationship
Totally there are 482 dairy farmers holding 5907 dairy cows who produced 22 thousand tons of fresh milk per year17. They are the main and the key actors in the chain of milk. They play a very important role in the chain as they create goods and thus create the chain. All other actors depend on their operation. Thirteen milk collecting centers or milk collectors in the region are under the control of the dairy plan. Officially, they work independently to the dairy plan and receive their income. But inofficially, they are almost belonging to the Moc Chau Company. The most powerful actor in the milk value chain is the dairy plan. They are the decision making actor for the chain. They link dairy farmers with input suppliers, milk collectors and distributors as well. They also impose impacts on both wholesalers and retailers. They push the whole chain. In the distibution stage, there are many participants named small milking shops, milk cake shops, some showrooms and supermarkets and many agents and retailers.
The chain is supported by many relevant stakeholders. There are some organisations and projects from BTC, JICA, MARD, DARD, NIAH support for the dairy farmers. The major supports are cow raising technique, training course for food preparation. Some organisations provide financial support such as ASODIA. These supports are very useful for dairy farmers.
However, financial institutions such as Agri Bank, Policy and Social Bank, etc almost do not provide them loan for raising cow or provide with very complicated administrative
procedures. It is difficult for them to enhance their production. The education institutions
16
The symbol based on Valuelink methodology
17
By the time of surveyed July 2010
Veterinarians
almost do not provide them knowledge and skills. Except some extentioners and veterinarians from the dairy plan, the local extentioners and veterinarians do not provide farmers services to solve their specialised practice problems such as how to over come the diseases, to protect their cows from harsh conditions, to prevent them from natural disarster, etc. Vietnamese government and local authorities provide them the environment to produce milk through decision, resolution, directive, decrees, etc. But it is seemed that these decisions do not sufficient to control the milk market and to protect the producers from vulnerable (Jonathan, 2010).
3
3
.
.
3
3
M
M
i
i
l
l
k
k
d
d
i
i
s
s
t
t
r
r
i
i
b
b
u
u
t
t
i
i
o
o
n
n
c
c
h
h
a
a
n
n
n
n
e
e
l
l
Figure 9 Milk distribution channel
Source: Surveyed results
Milk from dairy farmers in Moc Chau is collected mostly by collecting centers (98.5%). The rest is partly used for their auto comsumed (1%) and the other part collected by retailers or milk shops within local region. All of milk at the collecting centers will be transferred to dairy plan in Moc Chau. There, they process, pasturize and package into mainly fresh milk, a small proportion of milk cake and yogurt. Except 1.1% of fresh milk is directly
Milk from Dairy farmers
Consumers
Retailers/ Distributors
Dairy plan
Processing and packaging
Collecting centers 98.5%
Retailers, milk shop 0.5% Own using 1 % Wholesalers, showroom, supermarket 97.9 % 1.1% Schools, companies 1 % 30% 70%
tranferred to retailers or distributors, almost milk is provided to wholesaler, showroom, supermarket. The wholesaler will provide directly to the customer (30%) or through retailers (70%).
3
3
.
.
4
4
V
V
a
a
l
l
u
u
e
e
c
c
h
h
a
a
i
i
n
n
o
o
f
f
m
m
i
i
l
l
k
k
Additional turnover count on a kg of milk
Research shows that the income received by farmers equal to 35% of the total income of the whole chain while their financial cost that they invested was the largest proportion, from 40 to 50% total cost of the chain. Turnover that dairy plan received almost a haft of turnover of the whole chain.
Value added count on a kg of milk Dairy farmers Milk Collectors Dairy plan Distributors 0.4526-0.4739 1.2632-1.3267 0.4553-0.4761 1.1579-1.2061 Additional turnover (USD) 34.1-35.7 95.2-100 34.3-36 87.3-91 Share (%) Dairy farmers Milk Collectors Dairy plan Distributors 0.168-0.215 0.116-0.211 0.024-0.050 0.249-0.356 Value added (USD) 19.22-24.6 3-6 28.5-40.7 13.3-24.1 Share of value added (%)
Value added seems distributed unequally among actors along the chain. The farmers, who spend the most of investment, received only one fifth the total value added of the whole chain. The dairy plan received one third and almost the rest was belonging to the distributors. In term of value added in comparison to the expense, distributors are the most benefits actor as they spend the least and gain the high value added.
One more thing should to be noted that all the investment in dairy plan or distributors, both the financial investment, labor cost or opportunity cost have almost been calculated in the cost and price. While in farms, their mixed income and value added included both hard and long time working family labor and high opportunity cost of capital. Labors, especially family labor in dairy farms have to work very early in the morning (from 4 a.m or 4.5 a.m) and still work until 8 p.m. Even some farmers have to work until 10 p.m or later. Substracting the time for meals and relax, normally they have to work 12 to 14 hours per day. That is really unfair not to calculate their labor cost or opportunity of labor cost.
Moreover, the capital used to invest in one milky cow is around 20 to 60 million VND depending on the breed, age and time of buying and raising the cow. The opportunity cost for the capital is not included in the cost. Thus, if these costs can be fully calculated in the farmers’ production cost, their mixed income as well as their value added would be much lower.
4
4
.
.
C
C
O
O
N
N
C
C
L
L
U
U
S
S
I
I
O
O
N
N
A
A
N
N
D
D
P
P
O
O
L
L
I
I
C
C
Y
Y
I
I
M
M
P
P
L
L
I
I
C
C
A
A
T
T
I
I
O
O
N
N
Vietnam has no tradition in dairy cow development but dairy is becoming one of the most important ways to achieve sustainable development for agriculture in Vietnam. A breakthrough for dairy development in Vietnam is the appearance of Resolution 09 and the Government Decision 167. Although there was some critical on the strategy development based on this Decision, it helps to stimulate the dairy industry in Vietnam to develop.
The GDP per capital increased rapidly in Vietnam last decade results in a rise in the Vietnamese living standard. The in turn stimulated the milk consumption in Vietnam. The steady growth in quantity of milk production can not satisfy the large amount of demand. Vietnam had to import a large amount of milk from abroad. The situation of foreign domination in the milk martket sometime led to the manipulation of milk price in Vietnam. Thus, it is necessary to develop the domestic value chain of milk.
Dairy farmers are the main and the key actors in the chain of milk as they create the goods and thus create the chain. However, the most powerful actor in the milk value chain is the dairy plan. They are the decision making actor for the chain and they push the whole chain. Research shows that the income received by farmers was low in comparison to their cost. Dairy plan received nearly a haft of turnover of the whole chain. Value added seems distributed unequally among actors along the chain. The farmers received only one fifth, the dairy plan received one third and almost of the rest belong to the distributors. Distributors are the most benefits one in term of value added. The real value added received by dairy farmers would be much lower if they count their opportunity cost of land and family labor.
In order to develop the chain of milk in Vietnam, improve the benefit for the dairy farmers, and especially increase their value added, some suggestions are given as follows:
First, in order to increase the value chain of fresh milk in general and and value added for farmers in particular, the value added of the whole chain must be improved. The local and national government should concentrate their consideration to dairy plan because they are the key element to push up the chain. When the value added of the whole chain upgrade, mechanisms for the rights of farmers should be focus for their better role and benefits.
Second, social dialogue among actors and stakeholders in the chain should be considered and taken place. This will facilitate and enhance the role of farmers to ensure their
better benefit. It also creates a good linkage from actors and stakeholders in the chain, thus in turn promote the whole chain.
Third, it is necessary to provide dairy farmers tools to monitor their production in order to achieve better efficiency. They need to know the way to calculate their real value of production. Some basic tools should be provided to them such as book keepings, advises, monitors…
Finally, in order to develop the domestic dairy milk production, it is really necessary for dairy farmers to receive more supports from the local and national government. The government should provide not only a good environment for dairy producers, for domestic dairy plans but also provide suitable tools to control the market milk price, milk quality to ensure and protect them from vulnerable.
B
B
i
i
b
b
l
l
i
i
o
o
g
g
r
r
a
a
p
p
h
h
y
y
1. Bogdan K. , 2008, Dairy sustainable development: From production to consumption, Presentation at the Workshop on Strategy for Vietnam Dairy Industry: Discuss the public and private roles, Hanoi.
2. FAOSTAT (2011), Data of Vietnam, FAO Statistics Divisions.
http://faostat.fao.org/site/569/DesktopDefault.aspx?PageID=569; http://faostat.fao.org/site/535/DesktopDefault.aspx?PageID=535#ancor
3. GSO (2009.1), “Annual Statistic Year Book 2008”, Statistic Publisher, Hanoi, Vietnam
4. GSO (2009.2), Press release: Socio-economics statistical data nine first months of 2009, http://www.gso.gov.VN/default.aspx?tabid=388&idmid=3&ItemID=7363, consulted 24/12/2009 5. GSO (2011), “Summary results of the Vietnam household living standard survey 2010”,
http://www.gso.gov.vn/default_en.aspx?tabid=483&idmid=4&ItemID=11148, consulted 12/08/2011
6. HBBS. (2010), Vietnam Dairy Industry report, 1st Quarter, 2010,
http://www.ors.com.vn/reports/2/Report_Industry.aspx?CateID=-1&ParentIn=202&Key=dairy, consulted on 02/08/2011
7. Nancy B. et al (2006), Review, analysis and dissemination of experiences in dairy production in Vietnam, AVSF/ACI/FAO final report.
8. Nancy M. (2008), “FAO vision for the Dairy Development in Asia”, Conference on Dairy Strategy in Vietnam, Hanoi, 30-31/10/2008.
9. NIAH (2011), Vietnam Animal husbandry, Scientific and Technological Publishing house, Hanoi, Vietnam
10. Nguyen Tai Anh (2009) 1et al., Moc Chau Sonla Plantation: 50 years foundation and growth, Sonla.
11. USDA Foreign Agricultural Service (2005). Vietnam Livestock and Products, Update 2004. USDA Foreign Agricultural Service, September 2005.
12. Viet T. D, 2008, Competitive position of Vietnam and Asia in Global Dairy industry, Presentation at the Workshop on Strategy for Vietnam Dairy Industry: Discuss the public and private roles, Hanoi.
13. VOV News/VNA (2008), http://english.vovnews.vn/Home/A-development-strategy-for-dairy-industry-under-discussion/200810/12063.vov, consulted 10/11/2008
14. Jonathan Pincus (2010), Milk Price Registration and Regulations in Vietnam: Will it Lower Milk Prices? POLICY CASE STUDY, Harvard Kenedy School- Fulbright Economic Teaching Program, October, 2010.
15. Luan Le Van Cao (2008), Fresh Grass to Fress milk, JACCAR Equity Research – Vietnam. http://reports.jaccarequityresearch.com/reports/report/369-Fresh-Grass-To-Fresh-Milk.html 16. IFCN (2006), The economics of milk production in Hanoi, Vietnam, with particular Emphasis on
Small scale Producers, PPLPI working paper No. 33
http://www.ifcnnetwork.org/media/pdf/DR10-Extract-lowres.pdf, consulted 20/09/2009
17. Patrice Gautier (2008), Smallholder Dairy in Vietnam, Study and Presentation on behalf of FAO within the project “Improved Market Access and Smallholder dairy farmer Participation for Sustainable Dairy Development” (CFC/FIGMDP/16FT)