Validation Process for CFD Simulations of Wind Around Buildings
Prof. Sigrid REITER
LEMA, University of Liège, Belgium
ABSTRACT
Our study is based on a great number of CFD (computational fluid dynamics) simulations to evaluate wind comfort at the pedestrian level. This article explains the method used to validate our CFD simulations carried out with the FLUENT software. This validation is based on a comparison between our simulated results and wind tunnel tests for three different building contexts: a single building, the interaction between two buildings and an urban situation. This validation allowed us to optimize the choice of various modelling parameters: grid resolution, turbulence model, etc. From this study, we worked out guidelines for numerical wind modelling in order to quantify wind discomfort levels. This article highlights the fundamental importance of validating CFD simulation tools from a configuration and a type of flow as close as possible to the subject of our researches or applications.
1. INTRODUCTION
In modern cities, there are more and more high constructions and complex forms which can involve significant problems of wind discomfort around these buildings. Our study is based on CFD (computational fluid dynamics) simulations carried out with the FLUENT software to evaluate wind comfort at the pedestrian level. This article explains the method used to validate our CFD simulations. This validation is based on a comparison between our simulated results and wind tunnel tests.
Wind tunnel tests give wind relevant results and stay a reference for new methods’ validity investigations. Working with physical models makes you able as well to study some precise location as to test different hypothesis. Limitation of wind tunnels is such tools scarcity, especially when big enough tunnels are needed for investigations on urban models, and the choice of a limited number of measurement points in the models.
Computational fluid dynamics simulations programs are also very powerful tools for modelling the wind around buildings. They have a huge advantage over wind tunnel tests: they give a quantitative and qualitative wind flow representation of the whole volume simulated and not only in a few specific points related to the presence of measure instruments. Unfortunately, accuracy of the results of these tools must still be proved, especially when working on complex turbulent air flows as we do in the field of wind flows around buildings. Therefore, urban applications of CFD’s developments are still at the beginning.
It is important to take time to analyze the performance of CFD simulations compared to results of wind tunnel tests in order to assess their scientific validity and promote the best settings and options of CFD simulations programs. This article describes the validation process used for the FLUENT software.
2. CFD SIMULATIONS 2.1 Boundary conditions
Various dimensions of the simulation volume are recommended in the literature:
• The blocking ratio should not exceed 3% (Baetke & al 1990). The blocking ratio is the ratio between the buildings vertical surfaces exposed to the wind and the surface formed by the height and width of the simulated field which is generally the air inlet surface in the simulation.
• A blocking ratio less than 3% is recommended, even for large groups of buildings. The shape of the section of the simulation volume should preferably follow that of the buildings vertical surface exposed to the wind.(Franke & al 2004)
• The minimum length of the simulation field is 5 * min (L, 2H) upstream of the building and 8 * min (L, 2H) downstream of it, taking L equal to the length of the building and H equal to its height. (Blocken & al 2003)
• The minimum dimensions of the simulation field are: 5H upstream of the building, 5H on each building side, 5H above it and 15 H downstream of the building. For a complex of buildings, the height H is the height of the highest building: Hmax. (Hall 1997)
• A rule frequently used for tests in wind tunnel : boundary limits of the simulation volume must be located at a distance at least equal to 6H and preferably 10 H. (Franke & al 2004).
To avoid that boundaries influence the results of the wind simulations, it is wise to choose the greatest possible simulation volume. But on the other hand, the simulation field is limited by the mesh size and the computing time that follows.
For all our simulations, we chose the following dimensions:
• For the height and width of the simulation field, the blocking ratio should not exceed 3%.
• The shape of the section (width x height) of the simulation field should preferably follow that of the buildings surface exposed to wind.
• The length of the simulation volume extends upstream of buildings over a distance of 10H and downstream over a distance of 16H.
The buildings surrounding the main public spaces must be modeled precisely: for these buildings, anything more than 1m wide should ideally be represented in the simulation. The buildings farther from the studied area can be represented by simplified blocks. (Franke & al. 2004).
A good mesh requires great precision. The mesh should be highly refined at pedestrian level and in areas where strong wind gradients are planned. Adapting the mesh is an effective way to model accurately separation and attachment flow details without too many calculations. (Meroney & al 1999, Kim & Boysan 1999).
Various papers recommend the following boundary conditions for the simulation limits (Baetke et al 1990 ; Hall 1997 ; Blocken & al 2004 ; Francke & al 2004) :
• symmetries on the edges and the upper surface of the volume,
• "outflow" or a condition of zero pressure for the surface by which air leaves the simulation volume. The "outflow" boundary condition imposes a fully developed airflow at the exit, so it is important that the distance between building and exit is sufficiently long.
• a profile of wind speed varying with the height at the air entrance of the simulation field.
According to them, we used the symmetries and outflow boundaries for our simulations. During this validation of FLUENT, the wind profiles used depend on the wind tunnel tests to which our simulations are compared.
For treatment of areas close to “wall” surfaces such as ground or buildings facades there are two calculation models in FLUENT. Considering the complexity of our simulations, the choice of the "wall function" model is the most appropriate because the mesh can be more coarse if you use it than with the "two-layer approach". (Fluent 2008)
For studies of wind comfort at pedestrian level, it is necessary to use smooth surfaces (ie whose height roughness is zero) for buildings and ground, in order to be able to refine the mesh along these walls.
When the wind speed is low, thermal effects (temperature of the atmosphere, hot surfaces,…) can influence air movements. We did not take account of these thermal effects in our study for three reasons:
• these effects affect only low speed air movements and therefore they have no real impact on people’s comfort in relation to the wind.
• this is a normal practice for engineering aerodynamics to make this assumption.
• take account of these thermal movements would increase sharply our already complex simulations.
It would be interesting to analyze in a further research some of these thermal effects, such as breezes generated by the urban heat island effect or air movements that link urban parks and their built context.
All these assumptions and boundary choices for CFD simulations were applied on all our simulations in this validation process of the FLUENT software.
2.2 Turbulence models
The turbulent flows are characterized by a fluctuating velocity field. In practice, these fluctuations can be very small-scale and high frequency movements. They are therefore impossible to model directly with today's computers. However, the equations of fluid mechanics can be averaged to withdraw the smallest fluctuations, using a modified set of equations that can be solved numerically. These transformed equations include additional variables that have to be be resolved by a turbulence model.
There are two major groups of turbulence models:
• RANS models (Reynolds-averaged Navier-Stokes models) • LES models ( Large Eddy Simulation models).
The equations of the RANS models calculate the transport equations only for the average quantities of the air flow, for which all the turbulence scales are simulated. Among these models, we find the standard k-ε model and its variations as well as RSM (Reynolds Stress Model).
Until now, it is essentially the standard k-ε model and its adaptations that are used in the CFD simulations of wind engineering. Unfortunately, we know for a long time that this turbulence model is not appropriate for an accurate calculation of airflow around buildings (Murakami 1998). The RSM (Reynolds-stress model) methods were designed to yield better results than their predecessors for many complexities of the flow around buildings, such as stagnation areas, strong pressure gradients, separation flow, very curved movements, etc. (FLUENT 2008).
The LES (Large-eddy simulation) methods provide an alternative approach. When the turbulent air movements are wider than one simulation mesh, they are calculated with a time variable solution through a set of equations that filter the smallest eddies. Conceptually, the LES simulations are more desirable than the RANS methods for the study of wind around buildings because they solve precisely the large eddy and simulate only the smallest eddies. But it should be noted that LES applications are still experimental and that it is difficult to choose realistic boundary conditions for this type of simulations. Moreover, these methods require huge computing power, very tight mesh and long calculation time.
Moreover, the most common softwares in fluid mechanics applying to wind engineering do not offer yet full operating LES models in three dimensions. Our validation study of CFD simulations using the FLUENT software focuses therefore on the RANS turbulence models.
3. VALIDATION PROCESS
The data provided by experiments on a real site are impractical as a basis for validation because these data are generally measured on averages of 10 to 30 minutes because the actual weather rarely remains constant over 30 minutes. However, the CFD simulations based on RANS turbulence models give results of the airflow on an averaged time that is theoretically infinitely long. On the other hand, it is difficult to carry out experimental measurements on a site with high spatial resolution because it would imply too many measuring equipments. CFD simulations results must be validated from wind tunnel tests, which give more results for the same configuration that measures on a real site and are also based on the assumption of static boundary conditions. Finally, remember that wind tunnel is a technology used with great success for decades to assess precisely the problems of wind around buildings.
We carried out a validation of FLUENT as a tool for simulation of wind around buildings by comparing our simulated results with wind tunnel tests found in the literature. This validation was done in three stages:
• validation of FLUENT for the study of wind around a single building. • validation of FLUENT for the study of wind around a group of buildings. • validation of FLUENT for the study of wind in a dense urban environment. 3.1 Wind around a single building
Our FLUENT validation begins with the study of wind around a single building. The simulated configuration is a 80m long, 12m wide and 18m high building, drilled in its center by a passage (6m wide and 4m high) at the pedestrian level.
Fig. 1 : Simulation configuration for the validation of wind around a single building.
This configuration was selected because we can compare our simulations with the wind tunnel results that Wiren has published for the same built geometry (Wiren 1975). These wind tunnel measurements accurately quantify the wind discomfort effect generated at the centre of this passage at pedestrians level (2m high).
The total section of our simulation has a height of 108m and a width of 480m, which implies a blocking ratio of 2.8%. The shape of the section of the simulation volume is equivalent to the building facade exposed to the wind. The depth of our simulation volume measure 480m, of which 180m are located before the building. This is a very long simulation field, which corresponds to the more stringent limits found in the literature, namely a length of 10 H upstream of the building and a length of 16 H downstream.
The wind profile used in the simulation is a key element to obtain quality results. In this case, the wind speed profile at the entrance of our simulation volume has to be strictly equal to the profile used in the wind tunnel tests of Wiren to which our results will be compared. The wind profile that we used can be found in Wiren’s paper: U= 10 (z/2)0.125, where U is the wind speed, z is the height at which wind speed is calculated and the turbulence intensity of the wind is14% at pedestrian level. (Wiren 1975)
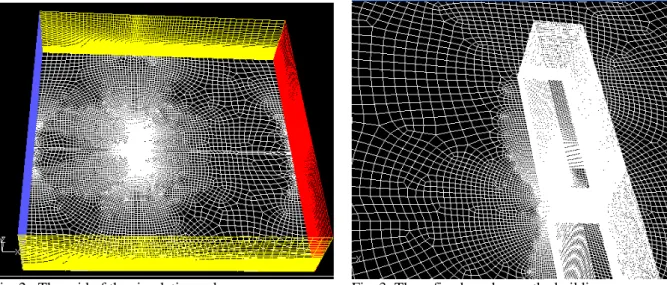
For the first simulation, the meshing accuracy reached 0.2m for the grid located on the upwind façade and inside the passage under the building. Our simulated grid was made up of 1 384 836 cells.
The left figure below shows the distribution of our simulation grid along the boundary surfaces of the simulation volume. The right figure shows a zoom of our simulation grid around the building. We see that the mesh is highly refined near the building.
Fig. 2 : The grid of the simulation volume. Fig. 3: The refined mesh near the building.
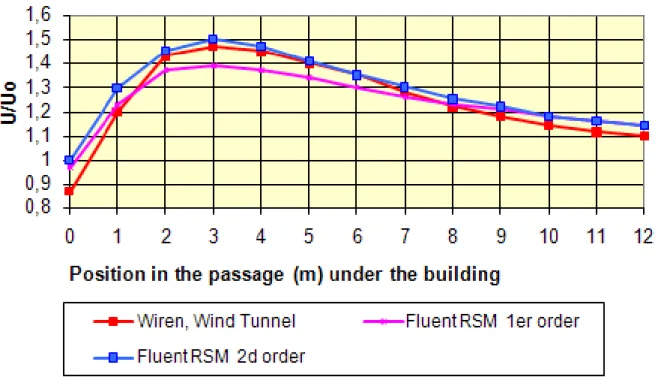
The ratio U/Uo is the ratio between the wind speed simulated at 2m high in this built configuration and the wind speed simulated at the same height without the presence of the building. The ratio U/Uo is representative of the acceleration or deceleration effect of the wind around the studied building. The graph below compares the values of the report U/Uo in the middle of this passage under the building simulated with various turbulence models of the FLUENT software (converged to the 2d order) and the results of a wind tunnel test of Wiren (Wiren 1975), at 2m high from the ground.
Fig. 4: comparison of the results simulated by various FLUENT turbulence models and a wind tunnel test
The standard k-ε turbulence model does not give a bad result in this case, in the sense that it shows that the passage is an uncomfortable place and that the maximum discomfort intensity lies in the first third of the passage. However, the position of maximum discomfort has not been simulated accurately compared to the wind tunnel measures. Moreover, the quantitative value of the discomfort simulated is undervalued compared to the real risk of discomfort. The standard k-ε turbulence model allows a first approximation of critical areas from the viewpoint of pedestrians wind comfort.
The k-ε Realizable model improves quantitatively the discomfort estimation compared to the standard k-ε model. However, this model predicts the maximum discomfort position with the same error as the standard k-ε model and still underestimates the value of maximum discomfort.
The Reynolds Stress model (RSM) gives remarkable quantitative results to assess pedestrians wind comfort in the passage under this building. This turbulence model does not only identify critical areas but also determines accurately the most critical position and the value of maximum wind discomfort. The RSM turbulence model should thus be used in all studies of wind comfort around an isolated building because it gives very good results for the distribution of mean wind speeds.
We compare below simulations results using the FLUENT RSM turbulence model converged respectively to first and second order. It is interesting to note that the RSM model converges very well for this type of geometry and a hexahedral-wedge mesh.
The slope of the discomfort curve is much better simulated by the second order than the first order. Moreover, the second-order simulation gives a maximum discomfort value much closer to the reference result of Wiren wind tunnel test.
Simulations with the other turbulence models ostensibly show that all FLUENT turbulence models produce significantly higher results when they are converged to the 2d order rather than the 1st one. It is worth mentioning that the problems of convergence reported in the literature for 2d order simulations (Blocken & al. 2003) are usually the result of a too inhomogenous mesh. With a “hexahedral-wedge” mesh highly refined at pedestrian level and around the buildings the second order simulations can converge smoothly.
Other simulations were conducted for the same configuration but with various building heights. Accuracy of results and conclusions are similar to the previous simulations.
Changing the simulation mesh showed us that a mesh size of 0.5m near buildings and wind critical areas is enough to keep the same order of accuracy to assess wind comfort of people around isolated buildings. Wider mesh limits the accuracy of results.
If we compare all our simulations made around isolated buildings, all the FLUENT RANS turbulence models converged to second order used to provide a quantitative accuracy of the maximum wind speed evaluation of 15% compared to a wind tunnel test. It is largely sufficient to estimate the critical areas around a building.
However, to determine the precise position of the highest wind speed areas as well as to assess accurately pedestrians discomfort risks, some models are better suited. We recommend second order simulations with the RSM turbulence model.
3.2 Wind around two buildings
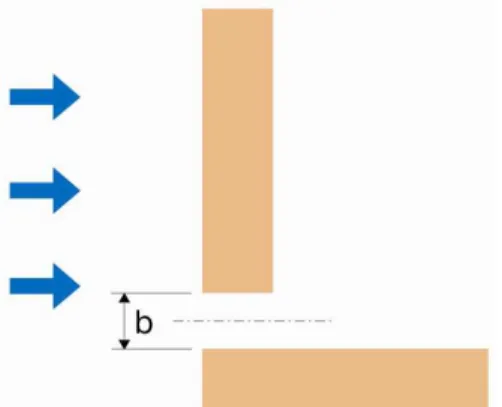
Our CFD validation continues with the study of wind around two buildings. The first simulated configuration consists of two buildings 18m high separated by a passage of 4m between them. The wind is blowing perpendicular to the front line formed by the two buildings.
On the basis of the FLUENT simulations validation assessing wind around an isolated building, we directly compared a simulation of this new configuration converged at the second order with the RSM turbulence model and results from Wiren wind tunnel test (Wiren 1975).
The mesh size along the facades and in the passage between the two buildings is 0.5m (based on the parametric study carried out for an isolated building). Discomfort levels are calculated at the center of the spacing between the two buildings.
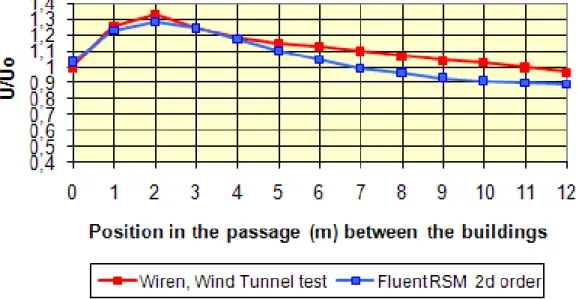
The figure below shows the respective results of our simulation and Wiren wind tunnel test at 2m high along the median line of the passage between buildings. The quantitative and qualitative results are very good. The highest wind speed is predicted with great precision both in its intensity as in its position in the passage. Error between simulated results with the RSM turbulence model of FLUENT software converged to the second order and measured values of wind tunnel test is less than or equal to 10% in this passage between buildings.
Fig. 7: comparison of simulated results (FLUENT-RSM-2d order) and measured values by wind tunnel test.
The simulation results with other RANS turbulence models lead to the same conclusions as the simulations around an isolated building. The simulations error in comparison to Wiren wind tunnel test is less than or equal to 15% in the passage between buildings for the standard k-ε model and the k-ε realizable model. Thus, error is smaller with the RSM model. Moreover, the highest wind speed position in the passage is located more accurately by the RSM model.
Simulations were also conducted to compare CFD modeling of the Venturi effect and wind tunnel tests. This other critical effect of wind between two buildings was simulated with the same accuracy. The difference between the predicted highest wind speed by modeling using FLUENT (RSM-2d order) and Wiren wind tunnel test is only a few percent. Moreover, the position of the maximum overspeed is very well simulated.
This validation study shows that mesh size of 0.5m along the facades exposed to wind and in the flow critical areas (for example the passage) is sufficient to evaluate people comfort around two buildings.
We can therefore say that FLUENT is a good tool for evaluating critical effects of wind around some buildings. FLUENT is validated both quantitatively and qualitatively for assessing wind speeds around two buildings. The model RSM converged to second order is the ideal turbulence model for the study of wind around small groups of buildings.
3.3 Wind in a dense urban situation
The third part of our CFD validation studies wind in a dense urban environment. The aim is to check FLUENT assessments accuracy in such complex built context. This validation work focuses on wind speed distribution in a dense urban area within a horizontal plane at 2m high. We compared our simulations with wind tunnel tests of Stathopoulos and Wu (Stathopoulos & Wu 1995). These experiments were carried out with an urban wind profile (a = 0.25), which was also used in our simulations.
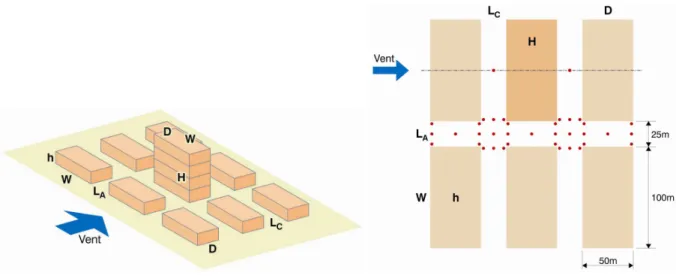
The figures below show the configuration studied and the position of the various measurement points in the wind tunnel tests (Stathopoulos & Wu 1995). The central building was modeled according to two different heights : the same height as the whole urban fabric (19m) and a height equal to four times the height of surrounding buildings (76m). The streets have a width of 25m. Buildings have an upwind width of 100m and a depth (along the wind) of 50 m.
Fig. 8 : Simulated configuration for a dens urban context. - Fig.9 : Measurement points in the wind tunnel tests
These simulations were conducted with 4 additional blocks upstream of the three blocks studied. This was done in order to define an urban environment as well as to better correspond to wind tunnel tests since Stathopoulos and Wu have also done so in their wind tunnel tests. There is 300m urbanized field (4 buildings + 4 streets) before the urban area analyzed.
The first simulation models urban buildings of the same height (19m). The mesh height is 0.5 m from the ground to 40m high. In the horizontal plane, the meshing grid is composed of 2mx2m cells in the area of wind speed analysis. The findings are as follows:
• Qualitatively, all turbulence models, converged to the second order, simulate very well the wind protective effect of such a built morphology.
• Quantitatively :
o For streets exposed to winds, RSM standard model predicts much better the
mean ratio U/Uo than the k-ε realizable model. The average relative error is 27% for the k-ε realizable model and only 8% for the RSM model.
o For streets sections sheltered from the wind, results given by the k-ε realizable
model and the RSM turbulence model are closer. The average relative error is 18% for the k-ε realizable model and 15% for the RSM model.
Therfore, we keep the RSM turbulence model converged to the second order as ideal model for simulating wind in dense urban environment of homogeneous height. Simulations made with all the RSM parameters available in FLUENT software show that results are slightly better with the parameter “wall reflection effects” (FLUENT 2008). But the RSM-standard model remains a good choice.
It should however be noted that errors of about 40% may appear locally, in specific points of the simulated field. This study allows us to conclude that we must consider such simulations as a tool for predicting average wind speeds in sections of streets or urban areas but not for determining accurate wind speed at a determined point within the urban areas.
Same exercise was conducted for this configuration with a high central building. The central building height was equal to 4 times the height of the other buildings: H= 4h with h=19m and H=76m. The mesh height is 0.5m from the ground to 120m high. In the horizontal plane, the meshing grid is composed of 2mx2m cells in the area of wind speed analysis.
The figure below shows the location of measurement points in the wind tunnel tests of Stathopoulos & Wu (Stathopoulos & Wu 1995). So these are the comparison points of our FLUENT simulations with wind tunnel tests.
The table below compares the average values of the ratio U/Uo at 2m high calculated with the measurement results of Stathopoulos & Wu wind tunnel test and our FLUENT simulations. There are five sections of streets represented with the following points groups: A1 to A7, B1 to B8, C1 to C7, D1 to D8, E1 to E8.
Simulation tools Mean U/Uo for A1 to A7 points Mean U/Uo for B1 to B8 points Mean U/Uo for C1 to C7 points Mean U/Uo for D1 to D8 points Mean U/Uo for E1 to E8 points Mean U/Uo for the whole urban area FLUENT with k-ε realizable (2d order) 0.43 1.54 1.46 0.66 1.17 1.05 FLUENT with RSM standard (2d order) 0.3 1.33 1.37 0.63 1.08 0.85 FLUENT with RSM - « wall reflection effects » (2d order)
0.32 1.25 1.28 0.51 0.81 0.84
Wind tunnel test 0.37 1.19 1.27 0.5 0.68 0.8
The results given by the k-ε realizable model are inadequate. For the RSM standard model, the average value across the whole urban area is good, with a relative error of 5% compared with the wind tunnel test. The RSM model with wall reflection effects provides still greater accuracy than the standard model for all sections of streets. The highest wind speed are well located for both versions of the model RSM. But the standard RSM model gives unexplained too high wind speeds for the points E1 to E8.
The highest U/Uo ratio measured in the 37 points is 1.7 for the wind tunnel test, 1.77 for the model k-ε realizable, 1.78 for the standard RSM model and 1.95 for the model RSM with wall reflection effects. The maximum overspeed is thus well modeled. The highest wind peed is simulated more accurately with the standard RSM model (error of 5%) than the RSM with wall reflection effects (error of 15%).
In the FLUENT software, the RSM turbulence model associated with the parameter “wall reflection effects” is specially adapted to wind in dense urban areas including inhomogeneous buildings heights. It gives good results for average wind speeds in each area and across the whole urban context. The relative error between measured values of the wind tunnel test and results of our simulations remains below 20% for all areas studied. For high wind speeds areas (Areas B and C) and for the average wind speed over the whole urban area, this error is limited to 5%. The highest wind speed simulated by this model within the 37 specified points is however 15% higher than wind tunnel measure.
Several grids have been tested to limit the size mesh. These tests show that this mesh size is the minimum necessary to obtain accurate simulation results. However, simulations conducted with horizontal mesh of 1.5m x 1.5m (in place of 2m x 2m) give even better results, without fundamentally change the previous conclusions.
The figures below show graphical results of our FLUENT simulations for this complex case of a dense urban area including a high building. The colored scale of the wind speeds simulated is the same for the horizontal and vertical planes.
Fig.11 : Wind speeds distribution in urban area : horizontal plane at 2m high.
From this validation, we can recommend the RSM model with the parameter wall reflection effects converged to the second order for urban situations with inhomogeneous buildings heights. We proved that a size mesh of 0.5m high applied on a height equal to 1.5 times the height of the highest building gives accurate results at pedestrian level. Our conclusion is that this type of built morphology can be successfully analyzed using the software FLUENT if the best calculation parameters and a sufficiently fine meshing grid are used.
We must consider such simulations as a tool for predicting average wind speeds in sections of streets or urban areas but not for determining accurate wind speed at a determined point within the urban areas. The areas with the highest wind speeds are well located but the exact position of the maximum wind speed can be locally displaced.
Architects and town planners do not need to know exactly the wind speed in a specific point to design comfortable public spaces but they need to know the areas protected from wind, those who will be exposed to it and those that will create discomfort for pedestrians. From this viewpoint, CFD simulations are validated to assess wind discomfort risks in urban areas and to help designing comfortable public spaces.
However, to explore the potential natural ventilation of buildings in urban areas or the influence of urban morphology on pollutants dispersion, CFD simulations presented in this article are not appropriate (Van Moeseke & al 2005, Blocken & al 2008). Such studies require therefore specific validation and probably the use of transient turbulence models.
This validation process has shown that our simulation results change significantly according to several parameters such as: urban geometry, mesh size, turbulence model, and so on. Parameters that are most suitable depend on the purpose of the CFD simulation (wind comfort, pollution dispersion, buildings ventilation …), on the type of wind flow analyzed, on the urban form and on the scale of the project. Thus, it is extremely important to achieve validation for CFD simulations from configurations and flow types as close as possible to the subject of our researches or applications.
4. GUIDELINES FOR NUMERICAL WIND COMFORT MODELLING
The biggest problem concerning the use of CFD simulations for the study of wind around buildings is currently the lack of evidence of the results validity and the lack of information on how to build CFD simulations. That is why we took the time to develop a validation process and to test it on FLUENT software. From this validation study, we worked out guidelines for numerical wind modelling in order to quantify wind discomfort levels.
We can now say that FLUENT is validated for assessing mean wind speeds around buildings provided that the following guidelines are met. These rules do not correspond to an optimization of all parameters described but their use ensures quality of CFD simulations.
The size of the simulation volume should match the following rules: • the blocking ratio should not exceed 3%.
• the shape of the section (width x height) of the simulation volume should preferably follow that of the buildings surface exposed to wind.
• the length of the simulation volume extends upstream of buildings over a distance of 10H and downstream over a distance of 16H, H being the height of the higher building.
• if it is possible to use a condition of symmetry, you should reduce by half the simulated field.
A good mesh requires great precision. The mesh should be highly refined at pedestrian level and in areas where strong wind gradients are planned. The size of the grid used for the simulations of this validation process runs between one million and two million cells. These grids include meshes of 0.5m high near ground and buildings and meshes of 10m to 20m high at the upper boundary.
For isolated buildings or small groups of buildings, we recommend a mesh size of 0.5m wide along facades exposed to wind and in area with strong wind gradients. For urban modeling, meshes of 0.5m high should be applied throughout the urban areas from the ground up to a height equivalent to twice the average height of low buildings or 1.5 times the height of the highest building. In horizontal plane, the grid should at least have mesh size of 2m x 2m wide but a finer mesh is always preferable.
We recommend the following boundary conditions for simulations of wind around buildings: • symmetries on the edges and the upper surface of the simulation volume.
• outflow for surface by which wind leaves the simulation. • a wind speed profile adapted to the urban environment modeled. • smooth ground and buildings (a zero roughness height).
• wall function model for the treatment of cells near solid walls.
From a qualitative point of view, all RANS turbulence models proposed in FLUENT simulate well the presence of high mean speeds around a single building or a small group of buildings as well as the wind protective effect of dense urban areas with uniformly low buildings. All turbulence models produce more accurate results when they are converged to the second order than the first one.
From a quantitative point of view, the RSM turbulence model should always be used for modeling wind comfort in urban spaces as it gives very good results for the evaluation of average wind distributions in the three built contexts studied in this paper: isolated buildings, small groups of buildings and dense urban areas. This model allows us to identify critical areas and quantify wind discomfort amplitudes. For simulations of isolated buildings or small groups of buildings, the RSM standard model of FLUENT gives excellent results. For simulations of a dense urban area, it is preferable to use the model RSM of FLUENT with the parameter “wall reflection effects” activated. This parameter is needed to accurately simulate the distribution of average wind speeds at pedestrian level for dense urban areas including tall buildings.
This validation study provides basis for carrying out simulations to assess wind comfort of pedestrians around buildings. The different conclusions obtained by analyzing several built contexts demonstrate however that it would be necessary to achieve the same type of validation study for other research topics, such as the evaluation of wind pressure on building facades for natural ventilation studies or the pollutant dispersion in urban areas for air quality studies.
5. CONCLUSION
Wind flow in complex urban zones is a very complex phenomenon to simulate. Scientific validations of CFD softwares are therefore necessary. The validation of FLUENT as a tool to study wind in urban areas was carried out by comparing results of simulations with tests in a wind tunnel. This validation process was done in three stages:
• validation of CFD simulations for the study of wind around a single building. • validation of CFD simulations for the study of wind around a group of buildings. • validation of CFD simulations for the study of wind in a dense urban environment.
Simulations results presented in this article show that FLUENT is a good tool for evaluating critical effects of wind around buildings from the viewpoint of pedestrians comfort. The software has been validated qualitatively and quantitatively for assessing mean wind speeds around an isolated building, around a small group of buildings, in a dense urban area with uniformly low buildings and in a dense urban area including a high building.
In addition, this validation process allowed us to define CFD simulations guidelines for numerical wind modelling in order to quantify wind discomfort levels. We studied and optimized the choice of various modelling parameters for wind comfort studies in the built environment: dimension of the simulation volume, size mesh, turbulence model, order of accuracy of the calculation scheme, etc.
This validation and CFD guidelines are an important basis for further scientific research in the study field of wind within the built context. The methodology developed in this article may be used in the future to continue this study of critical wind mechanisms in urban areas or to model more specific or complex configurations with CFD simulations.
The RSM (Reynolds-stress model) of FLUENT converged to the second order seems to be especially well suited to study wind comfort around buildings. A large grid (one million to two million cells) is needed with very fine mesh (0.5m high) along buildings facades, near the ground and in wind critical areas.
For isolated buildings and small groups of buildings, we showed that the RSM turbulence model converged to the second order gives accurate values of average overspeeds at pedestrian level with a relative error of 10% between the value measured at a specific point in a wind tunnel test and the value predicted at the same point by our CFD simulations. This relative error is reduced to a few percent (<5%) for the highest wind speed in the simulation field. The critical areas in relation to the wind are located very precisely through this type of simulations.
Considering the complexity of wind flow in dense urban areas, CFD modeling do not give a perfect equivalence of the mean air velocity in each specific point in such a built context. It should be noted that relative errors of 40% or even more between the value measured at a specific point in a wind tunnel test and the value predicted at the same point by our CFD simulations may occur locally.
However, following the guidelines given in this article for numerical wind comfort modelling we will get accurate mean results. It is important to take into account these simulations as a tool for predicting average wind speeds in sections of streets or urban areas but not for determining accurate mean wind speed at a determined point within complex urban areas. The relative error is less than 20% between the average speeds simulated and the average speeds measured in a wind tunnel for all sections of streets and for the whole urban area, within a dense urban area with low buildings as well as within an urban context including a high building. The average wind speeds modeled in the critical areas are predicted with an error limited to 5%. The highest wind speed generated at the foot of a high building located within a dense urban area is simulated with an error of 15%.The areas with the highest wind speeds are well located but the exact position of the maximum wind speed can be locally displaced.
This paper shows how numerical modelling is now a high-performance tool to work out useful guidelines for urban designers. However, it demonstrates also that the simulations parameters that are most suitable depend on the purpose of the CFD simulation (wind comfort, pollution dispersion, buildings ventilation …), on the type of wind flow analyzed, on the urban form and on the scale of the project. This article highlights the fundamental importance of validating CFD simulation tools from a configuration and a type of flow as close as possible to the subject of our researches or applications.
7. REFERENCES
BAETKE F., WERNER H., WENGLE H., Numerical simulation of turbulent flow over surface mounted obstacles with sharp edges and corners, Journal of Wind Engineering and Industrial Aerodynamics, 35, 1990, 129-147.
BLOCKEN B., ROELS S., CARMELIET J., Pedestrian wind conditions in passages through buildings- Part 1. Numerical modelling, sensitivity analysis and model validation, research report, Laboratory of Building Physics, KULeuven, 2003.
BLOCKEN B., ROELS S., CARMELIET J., Modification of pedestrian wind comfort in the Silvertop Tower passages by an automatic control system, Journal of Wind Engineering and Industrial Aerodynamics, 2004.
BLOCKEN B., STATHOPOULOS T., WANG X., Numerical evaluation of pollutant dispersion in the built environment: comparisons between models and experiments. Journal of Wind Engineering and Industrial Aerodynamics. 2008.
FRANKE J., HIRSCH C., JENSEN A.G., KRUS H.W., SCHATZMANN M., WESTBURY P.S., MILES S.D., WISSE J.A., WRIGHT N.G., Recommendations on the use of CFD in wind engineering, in: Urban Wind Engineering and Building Aerodynamics, COST Action C14, von Karman Institute for Fluid Dynamics, Rhode-Saint-Genèse (Belgique), 2004.
HALL R.C., Evaluation of modelling uncertainty. CFD modelling of near-field atmospheric dispersion. Project EMU final report, European Commission Directorate- General XII Science, Research and Development Contract EV5V-CT94-0531, WS Atkins Consultants Ltd., Surrey, 1997
KIM Sung-Eun, BOYSAN Ferit, Application of CFD to environmental flows, Journal of Wind Engineering and Industrial Aerodynamics, 81, 1999, 145-158
MERONEY Robert N., LEITL Bernd M., RAFAILIDIS Stillianos, SCHATZMANN Michael, Wind-tunnel and numerical modelling of flow and dispersion about several building shapes, Journal of Wind Engineering and Industial Aerodynamics, 81, 1999, 333-345, Elsevier.
MURAKAMI S., Overview of turbulence models applied in CWE-1997, Journal of Wind Engineering and Industial Aerodynamics 74-76, 1998, 1-24
STATHOPOULOS Th., WU H., Generic models for pedestrian-level winds in built-up regions, Journal of Wind Engineering and Industrial Aerodynamics 54/55 (1995) p.515-525 VAN MOESEKE G., GRATIA E., REITER S., DE HERDE A., Wind pressure distribution influence on natural ventilation potential for different incidences and environments densities. Energy and Building, 37 878-88p, 2005.
WIREN B.G., A wind tunnel study of wind velocities in passages between and through buildings, in: Proceedings of the 4th International Conference on Wind Effects on Buildings ans Structures, p. 465-475, Cambridge University Press, Heathrow, 1975.