Université du Québec
Institut National de la Recherche Scientifique
Centre Énergie, Matériaux et Télécommunications
NANOSTRUCTURED FUNCTIONAL METAL OXIDE-BASED
CATALYSTS FOR DIRECT ETHANOL FUEL CELLS
Par
Youling Wang, M.Sc.
Thèse présentée pour l’obtention
du grade de Philosophiæ Doctor, Ph.D.
en sciences de l’énergie et des matériaux
Jury d’évaluation
Président du jury et
Shuhui Sun
examinateur interne
Professeur à l’INRS-ÉMT
Examinateur externe
Sasha Omanovic
Professeur à l’Université de McGill
Examinateur externe
Dominic Rochefort
Professeur à l’Université de Montréal
Directeur de recherche
Mohamed Mohamedi
Professeur à l’INRS-ÉMT
ii
ACKNOWLEDGEMENTS
The work presented here was part of a long journey, during which I not only learned so much at the scientific level but also grew mentally and spiritually. Definitely, to pursue this path and to reach its end I received lots of supports from many people to whom I am very grateful.
First and foremost, I would like to express my sincere gratitude to my supervisor, Prof. Mohamedi Mohamed for offering me the opportunity to undertake my Ph.D. in his laboratory. Thank you for your patient guidance and consistent support throughout the Ph.D. period.
I am sincerely grateful to the jury members, Profs Shuhui Sun, Sasha Omanovic and Dominic Rochefort for agreeing to be the reviewers of this work and doing me the honor of being a member the evaluation juries of this thesis.
I would like also to thank my lovely, kind and helpful colleagues that shared their knowledge and experience and fruitful discussions throughout the experiments in our laboratory. Many thanks go to Amel Tabet-Aoul, Juan Carlos Abrego Martínez, Mouna Moumene, Maxime Gougis, Fatemeh Ataherian, Fatma Saidani, Zéhira Hamoudi and Haixia Wang.
I want to acknowledge other members from INRS and in particular, Mr Christophe Chabanier and Étienne Charette for their valuable and professional technical support and availability, as well as Mr. Jean-Philippe Masse from École Polytechnique Montréal for the time spent together on TEM.
Also thanks Mrs. Hélène Sabourin, Sylvie Richard, Michelle Marcotte and Hélène Tanguay for their professionalism and their kindness.
I would like to acknowledge the following organizations for their financial support: the China Scholarship Council (CSC), the Natural Sciences and Engineering Research Council of Canada (NSERC) and Fonds de recherche du Québec – Nature et technologies (FRQNT).
Last but not least, I’m deeply grateful to my parents, my younger brother, my other family members, and my friends for their love, understanding and constant support during the highs and lows of this long journey.
iii
ABSTRACT
Rising energy demands, depletion of fossil fuel reserves and environmental deteriorations, have spurred great interest in searching for energy conversion devices with high efficiency and low greenhouse gas emissions.Fuel cells powered by hydrogen (H2) or H-rich fuels (such as methanol, ethanol, ethylene glycol, etc.) have been regarded as promising alternative energy conversion devices to ease our concerns about fossil energy and the environment. Among various available fuels, ethanol becomes a more attractive fuel compared with H2 and other organic fuels. At room temperature, ethanol is in the liquid state and, unlike hydrogen, can be easily stored and transported using the current gasoline infrastructure with only slight modifications. Furthermore, it has more advantages than other liquid fuels including low toxicity, high energy density (8.0 kWh/kg), biocompatibility and wide availability from renewable resources like from sugar cane, wheat, corn, or even straw and algae. Despite these advantages, the use of ethanol in fuel cells and ultimately realizing the commercialization of direct ethanol fuel cells (DEFCs) are still being hampered by several challenges, especially the difficulties from the development of anode catalysts which are listed as follows: (i) high cost of electrocatalysts. Platinum (Pt) is the most commonly used catalysts for ethanol oxidation, but as Pt is scarce and expensive, the high loading of Pt in electrodes becomes a critical obstacle limiting the successful commercialization of DEFCs; (ii) sluggish electrochemical kinetics; (iii) low poisoning resistance to reaction intermediates (like COads); and (iv) difficulties associated with breaking the C-C bond in order to achieve the complete ethanol oxidation to CO2. Therefore, more active, selective and durable electrocatalysts have to be developed, and the preparation of multi-component (binary, ternary, or even quaternary) catalysts has been regarded as a promising strategy to meet the demands of the complicated process of ethanol oxidation.
So far, a great deal of effort has been centered on modifying platinum by adding transition metals (M: Ru, Sn, Mo, Pd, Ir, etc.) to form Pt-M binary catalysts. It was found that the added metal can definitely enhance Pt activity for alcohol oxidation by the bifunctional mechanism or electronic effect between Pt and foreign metals. Alternatively, the combination of nanostructured Pt with functional metal oxides (FMO: such as CeO2, SnO2, TiO2) has recently originated a distinctive class of electrocatalysts for DEFCs applications.The interaction between Pt and metal oxides was proved to have a critical influence on the chemisorption properties and ultimate catalytic behavior. Indeed, FMOs’ role has been claimed to improve Pt nanoparticles dispersion, and/or to supply hydroxyl species at lower potentials than Pt to accomplish the oxidative removal
iv
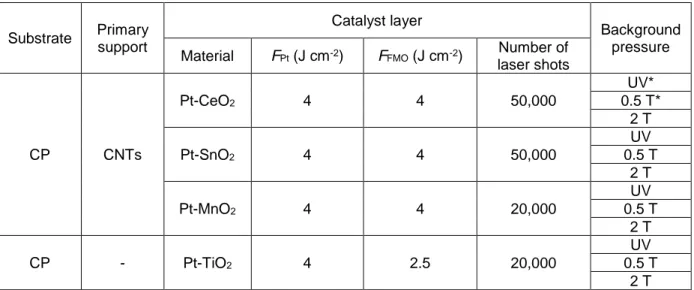
of COads (bi-functional effect), and/or to alter the electronic structure of Pt and thus lessens the adsorption strength of COads on Pt (the electronic effect). In this project, the work centers on developing advanced binderless, nanoarchitectured catalysts layers composed of the substrate (carbon paper, CP), the catalyst support (CNTs), Pt and FMO for DEFC applications. Two dissimilar materials (Pt and FMO) could be directly deposited onto the substrate by means of pulsed laser deposition. Four different FMOs (CeO2, SnO2, MnO2, and TiO2) have been selected and incorporated respectively in our binderless catalyst layer. It is well known that interactions of Pt with FMO can radically improve the catalytic performance of the Pt-FMO composites. In order to gain insight of the role of FMO in the catalytic behavior of Pt-based composites, FMO was incorporated into catalyst layer in two manners, namely layer-by-layer architecture and co-deposition architecture. The first architecture is fabricated by depositing Pt layer onto a layer of FMO. The second architecture is the co-deposition structure of Pt and FMO obtained by ablating both targets of Pt and FMO simultaneously. Furthermore, the optimization of each type of architecture was undertaken by varying the background gas pressure in the deposition chamber. Afterward, the prepared electrodes were firstly characterized by various physicochemical techniques including scanning electron microscopy (SEM), transmission electron microscopy (TEM) and high-resolution TEM (HR-TEM), X-ray diffraction (XRD), X-ray photoelectron spectroscopy (XPS), and micro-Raman spectroscopy. The electrocatalytic performance of synthesized electrodes towards ethanol oxidation was investigated by using cyclic voltammetry (CV), linear scanning voltammetry (LSV) and chronoamperometry (CA). Based on the results obtained, the correlation between physiochemical characterization and the electrochemical performance of corresponding Pt-FMO catalysts have been discussed and established. Specifically, as for the LOL structured catalyst layer, the porosity of the top Pt layer is varied with the morphologies of the underlying FMO layer which could be tuned by varying the gas background pressure. As a result, the catalytic performance of FMO/Pt towards EOR is affected due to the variation of the microstructure of FMO layer. Similarly, the gas pressure plays an important role on the physic-chemical properties of the co-deposits of Pt and FMO. The interactions between Pt and FMO have been found to be varied with gas pressure during deposition, and thus leading to different catalytic behaviors in the electrooxidation reaction for ethanol. Comparing the FMO-based catalysts of two different architectures, co-deposited catalysts exhibited superior EOR performance with respect to catalysts with LOL structure. This is mainly related to the higher interaction degree of Pt-FMO in co-deposited structure compared with LOL structure.
v
Based on the results of binary Pt-FMO catalysts, ternary catalysts composed of Pt, CeO2 and SnO2 were prepared in an attempt to further enhance the activity and durability with respect to that of binary catalysts. The catalytic activity of our optimized ternary catalysts under low potentials is enhanced compared with optimized CeO2 co-deposits but is still inferior to Pt-SnO2 co-deposits. Further optimization work needs to be carried out.
Furthermore, cathode catalysts for oxygen reduction reactions composed of Pt and FMO catalysts have been widely investigated, owing to the outstanding proton conductivity and the promoting effect of FMO demonstrated by the spillover phenomena of FMO to Pt. As is well known, synthesis method of catalysts plays a significant role in the catalytic properties of the resulting catalysts. Therefore, it would be an interesting study to examine the PLD-synthesized Pt-FMO catalysts for oxygen reduction reaction. In this doctoral project, it was found that the TiO2 films synthesized under different gas atmosphere dramatically increased the electroactive surface area of Pt and enhanced its electroactivity towards oxygen reduction reaction as compared with bare Pt electrode. Unfortunately, I could not complete studies on all synthesized FMO-based catalysts towards ORR due to the limitation of my Ph.D. period. However, the initial work presented in this thesis could intrigue further studies on PLD synthesized FMO-based catalysts towards ORR.
Youling Wang, étudiante Professeur Mohamedi Mohamed Directeur de recherche
vi
TABLE OF CONTENTS
ACKNOWLEDGEMENTS ... ii
ABSTRACT ... iii
TABLE OF CONTENTS ... vi
LIST OF FIGURES ... viii
LIST OF TABLES ... x
LIST OF ABBREVIATIONS ... xi
CHAPTER 1 INTRODUCTION and BACKGROUND... 1
1.1 General introduction ... 1
1.2 The background and problematics ... 3
1.2.1 What is fuel cell? ... 3
1.2.2 Types of fuel cells ... 5
1.2.3 Introduction of DEFCs... 8
REFERENCES ...13
CHAPTER 2 LITERATURE REVIEW ...15
2.1 Introduction to anode catalysts for DEFCs ...15
2.2 Ethanol oxidation on Pt-M bimetallic catalysts ...16
2.3 Ethanol oxidation on functional metal oxide–based catalysts ...20
2.3.1 CeO2–based catalysts ...22
2.3.2 SnO2–based catalysts ...24
2.3.3 TiO2–based catalysts ...27
2.3.4 MnO2–based catalysts ...29
2.4 Reaction mechanism of EOR ...31
2.5 Problematics of the electro-catalyst for EOR ...35
2.5 The objectives of the thesis ...36
2.6 Organization of the thesis ...36
REFERENCES ...38
CHAPTER 3 METHODOLOGY ...45
3.1 Material synthesis ...45
3.1.1 Chemical vapor deposition ...47
3.1.2 Pulsed laser deposition ...51
3.2 Structural characterizations of electrode materials ...58
vii
3.2.2 Transmission electron microscopy ...59
3.2.3 X-ray Diffraction Analysis (XRD) ...60
3.2.4 Micro-Raman spectroscopy ...62
3.2.5 X-ray photoelectron spectroscopy ...64
3.2.6 Atomic-force microscopy ...66
3.2.7 Neutron activation analysis ...68
3.3 Electrochemical characterization ...69
3.3.1 Electrochemical fundamental concepts ...69
3.3.2 Electrochemical techniques ...75
3.3.3 Experimental Procedures for the electrochemical measurement ...78
REFERENCES ...85 CHAPTER 4 PUBLICATIONS ...89 ARTICLE 1 ...91 ARTICLE 2 ... 118 ARTICLE 3 ... 140 ARTICLE 4 ... 157
CHAPTER 5 CONCLUSIONS AND PERSPECTIVES ... 175
5.1 Conclusions ... 175
5.2 Perspectives ... 180
APPENDIX ... 181
A: Résumé de la Thèse ... 181
viii
LIST OF FIGURES
Figure 1.1 World energy consumption by energy sources, 1990-2040 (quadrillion Btu) [3]... 2
Figure 1.2 Graphical illustration of the difference in energy conversion between fuel cells and traditional combustion processes [7]. ... 4
Figure 1.3 Ragone plot representing specific energy vs. specific power for traditional power source and electrochemical power sources [4]. ... 5
Figure 1. 4 Schematic diagram of a typical MEA in DEFCs [26]. ... 9
Figure 1.5 Schematic of an ideal polarization curve with the corresponding regions and ovepotentials [28]. ...11
Figure 2.1 j/E curves of DEFCs with Pt-based material as anode catalysts, compared to that of a H2 PEMFC with Pt catalysts as anode catalysts [19]. ...17
Figure 2.2 The crystal structure of CeO2. ...22
Figure 2.3 The crystal structure of SnO2. ...25
Figure 2.4 The crystal structure of TiO2 in phase: a) Rutile, b) anatase, c) brookite. ...27
Figure 2.5 Polyhedral representations of the crystal structures of different MnO2 and [MnO6] octahedron. ...30
Figure 2.6 Schematic of the global reaction mechanism for the electro-oxidation of ethanol on Pt electrodes in acidic medium [131, 139, 144]. ...32
Figure 3.1 The photos and SEM images with low and high magnifications of bare CP (upper row) and CNTs grown on CP (bottom row). ...46
Figure 3.2 The representation of two catalyst layer architectures containing Pt and FMO: (left) Layer onto layer structure, (right) Co-deposited structure. ...46
Figure 3.3 Schematic diagrams of SWCNTs and MWCNTs [6]. ...47
Figure 3.4 Schematic diagram of the CVD reactor for CNTs growth [13]. ...48
Figure 3.5 CNTs growth mechanism: (a) tip-growth model (b) base-growth model [13]. ...49
Figure 3.6 Schematic diagram (left) and photo (right) of CVD setup for CNTs growth. ...51
Figure 3.7 Schematic illustration of (a) PLD and (b) CBPLD setup. ...52
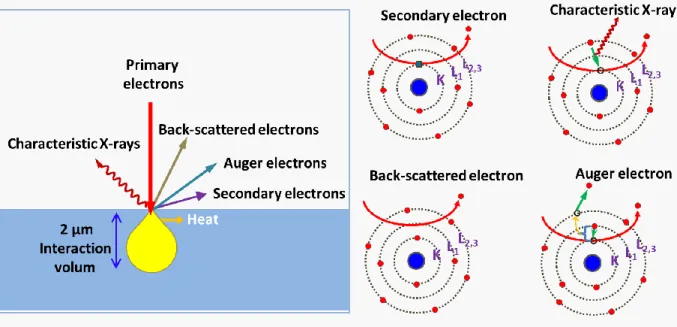
Figure 3.8 Signals generated from the interaction between SEM electron beam and specimen under study. ...59
Figure 3.9 Diagram illustration of the interaction of highly energetic electrons with matter ...60
Figure 3.10 Diffraction of X-ray by parallel planes of atoms in a crystalline material. ...61
Figure 3.11 Energy level diagram for Raman scattering (left) and the photo of Micro-Raman spectroscopy from Renishaw (right). ...63
ix
Figure 3.12 Schematic diagram of the photoemission process in XPS. ...65
Figure 3.13 Schematic diagram of AFM with (a) cantilever tip (b) scanner (c) laser beam deflection system and (d) feedback system. ...67
Figure 3.14 Schematic diagram representing the process of neutron capture by a target nucleus followed by the emission of gamma-rays [54]. ...68
Figure 3.15 Diagrams of (a) three-electrode setup and (b) three-compartment cell. ...71
Figure 3.16 (a) Potential-time wave applied for CV and (b) the resulting i-E curve. ...76
Figure 3.17 (a) Typical waveform of CA and (b) current –time response. ...77
Figure 3.18 Cyclic voltammogram of polycrystalline Pt electrode in 0.5 M H2SO4-Ar purged solution with a scan rate of 50 mV s-1. ...79
Figure 3.19 Cyclic voltammogram of CNTs/Pt electrode in 0.5 M H2SO4 + 1.0 M CH3CH2OH solution solution with a scan rate of 5 mV s-1. ...81
Figure 3.20 Chronoamperometric curve of CNTs/Pt electrode in 0.5 M H2SO4 + 1.0 M CH3CH2OH solution at an applied potential of 0.6 V. ...82
Figure 3.21 Electroactivity towards oxygen reduction reaction in 0.5 M H2SO4-oxygen saturated solution with a potential scan rate of 5 mV s-1. ...83
Figure 5.1 SEM micrographs of PLD-synthesized CP/(TiO2) and CP/(TiO2)/Pt samples. (a) CP/(TiO2)UV/Pt; (b) CP/(TiO2)10mTO2/Pt; (c) CP/(TiO2)0.5THe/Pt and (d) CP/(TiO2)2THe/Pt... 176
x
LIST OF TABLES
Table 1.1 The comparison of different types of FCs [8, 15]. ... 7 Table 1.2 The Volumetric and gravimetric energy densities of different small organic fuels [19, 20] ... 8 Table 3.1 The deposition conditions for co-depositions of Pt-FMO. ...57 Table 3.2 The deposition conditions for ternary catalysts. ...57 Table 5.1 The preliminary electrocatalytic results of optimized binary Pt-FMO catalysts towards ethanol oxidation. ... 178 Table 5.2 The preliminary electrocatalytic results of ternary Pt-CeO2-SnO2 catalysts towards ethanol oxidation. ... 179
xi
LIST OF ABBREVIATIONS
AA Acetic Acid AAL Acetaldehyde AFCs Alkaline Fuels Cells AFM Atomic Force Microscopy ASA Area Specific Activity Ag/AgCl Silver/Silver Chloride BE Binding Energy
CBPLD Cross-Beam Pulsed Laser Deposition CNF Carbon Nanofiber
CNTs Carbon Nanotubes CP Carbon Paper CV Cyclic Voltammetry
CVD Chemical Vapour Deposition DEFCs Direct Ethanol Fuel Cells
DEGFCs Direct Ethylene Glycol Fuel Cells
DEMS Differential Electrochemical Mass Spectrometry DFAFCs Direct Formic Acid Fuel Cells
DFT Density Functional Theory DMFCs Direct Methanol Fuel Cells
EELS Electron Energy Loss Spectroscopy EIA U.S. Energy Information Administration EMF Electromotive force
EOR Ethanol Oxidation Reaction
ESCA Electron Spectroscopy for Chemical Analysis ESA Electroactive Surface Area
FCC Face-Centered Cubic FCs Fuel Cells
FCEVs Fuel Cell Electric Vehicles FMOs Functional Metal Oxides
FTIR Fourier Transform Infrared spectroscopy FWHM Full Width at Half Maximum
xii GDL Gas Diffusion Layer
GS Graphene Sheet Hg/HgO Mercury/Mercury Oxide
HPLC High Performance Liquid Chromatography
HR-TEM High-Resolution Transmission Electron Microscopy IRRAS Infrared Reflection-Absorption Spectroscopy JCPDS Joint Committee for Powder Diffraction Standards KE Kinetic Energy
LSV Linear Scan Voltammetry MCFCs Molten Carbonate Fuel Cells MEA Membrane Electrode Assembly MOR Methanol Oxidation Reaction MWCNTs Multi-Walled Carbon Nanotubes NAA Neutron Activation Analysis
NMR Nuclear Magnetic Resonance spectroscopy ORR Oxygen Reduction Reaction
OCP Open Circuit Potential PAFCs Phosphoric Acid Fuels Cells PDF Powder Diffraction File
PEMFCs Polymer Electrolyte Membrane or Proton Exchange Membrane Fuels Cells PLAL Pulsed Laser Ablation in Liquid
PLD Pulsed Laser Deposition PSPD Position-Sensitive Photodiode RDE Rotating Disc Electrodes RDS Rate-Determining Step RF Roughness Factor
SAED Selected Area Electron Diffraction SEM Scanning Electron Microscopy
SERS Surface Enhanced Raman Spectroscopy SOFCs Solid Oxide Fuels Cells
STM Scanning Tunnelling Microscope SWCNTs Single-Walled Carbon Nanotubes TEM Transmission Electron Microscopy TOF Time of Flight
xiii WE Working Electrode
XPS X-ray Photoelectron Spectroscopy XRD X-Ray Diffraction
RE Reference Electrode
RHE Reversible Hydrogen Electrode CE Counter Electrode
SHE Standard Hydrogen Electrode NHE Normal Hydrogen Electrode SCE Saturated Calomel Electrode PTFE Polytetrafluoroethylene RDE Rotating Disk Electrode
1
CHAPTER 1 INTRODUCTION AND BACKGROUND
1.1 General introduction
Energy can be recognized as one of the most important pillars of our modern way of life. It is integral to our lives, it cooks our meals, keeps us warm, cools us down, lights our nights, propels our cars and connects us with others near and far. By far, the dominant sources of our consumed energy come from the combustion of fossil fuels which mainly refer to petroleum (crude oil), coal and natural gas. As is well known, fossil fuels are considered as non-renewable resources, since they don’t renew themselves at a sufficient rate within time frame meaningful to humans. Inevitably, they will eventually run out, which is an undisputed fact and is only a matter of time due to their finite reserves and human’s rising demand for energy. British Petroleum has reported in its 2016 statistical review of world energy that global proved reserves of oil, natural gas and coal are only respectively sufficient for 50.7, 52.8 and 114 years at the current production rate [1]. Except for the depletion concerns of fossil fuels, burning fossil fuels has caused a wide variety of environmental problems, such as global warming, air pollutions, acid rains, and so forth. The consequences of these environmental crises, in particular from the global warming due to excessive CO2 emission, are catastrophic and will ultimately affect the entire planet including human existence. The U.S. Energy Information Administration (EIA) has projected energy-related CO2 emissions over the period from 2012 to 2040 [2]. It has reported that the CO2 emissions are going to rise from 32.2 billion metric tons in 2012 to 35.6 billion metric tons in 2020, and to 43.2 billion metric tons in 2040. Much of the growth is contributed by high populated, developing countries including China and India, as a result of their fast-paced growth of energy demand. By 2040, developing countries account for approximately 60% of the world’s primary energy consumption due to their fast growth rates of economies and populations.
In response to the growing energy demand, the depletion of fossil fuels and the rapid deterioration of the environment, a dynamic change takes place in the energy supply. It is getting increasingly diversified, enabling us to reduce the excessive reliance on low efficient and high polluted traditional ones, in particular, the combustion of fossil fuels. In this context, exploring economically viable, clean and renewable energy is recognized as a long-term solution, and their developments are already underway. Based on the statistic of EIA’s energy projection report, renewable energy is regarded as the world’s fastest-growing source of energy that is increased
2
at an average of 2.6% per year, as shown in Figure 1.1 [3]. These sources include solar, wind, biomass (bio-ethanol), geothermal, hydropower, and so forth. Each of them exhibits their unique benefits and constraints. For example, solar and wind energy have abundant energy resources but they are intermittent and geographically restricted.
Figure 1.1 World energy consumption by energy sources, 1990-2040 (quadrillion Btu) [3].
Furthermore, electrochemical power sources including batteries, fuel cells (FCs) and electrochemical capacitors appear to be promising as power supplies for automotive, portable and stationary applications [4]. In the past decades, FCs have aroused tremendous attention due to their attractive features, such as the fuel flexibility, high energy density, high efficiency, low-to-zero CO2 emissions and quiet operation. FCs can be viewed as scalable power plants with wide applications ranging from transportation to stationary prime/backup power to portable electronics [5]. In 2014, the revenue from fuel cell (FC) system grew by around $ 1 billion, getting to 2.2 billion in sales. By 2014, the most viable market for FCs remains stationary distributed power that has been widely used for prime or backup power for residential and commercial operations [6]. As indicated in fuel cell technologies market report of 2014, nearly 10% of Fortune 500 companies currently use fuel cells for stationary or motive power generation [6]. As of 2015, reinforced by several countries’ FC-support policies, automakers such as Honda, Hyundai, and Toyota, started to deliver fuel cell electric vehicles (FCEVs) that are currently available to customers in numbers
3
of regions (U.S., Germany, France, the UK, South Korea, Canada) around the world. With the mass production of FCEVs and their expanding in vehicles markets, the cost of FCEVs is projected to keep decreasing and in turn, will accelerate FCEVs’ commercialization. As for portable power application, micro-FCs from the size of thumbnail to handhold even to small-bread-box-scale are able to meet different power requirements of various portable devices. To date, several companies such as Intelligent energy UPP, MyFC, Brunton and Neah power systems, sell hydrogen cartridges and micro fuel cell units that can give you power on the go. From a long-term disruptive vision, micro FCs are expected to be the personal power for the entire planet, which frees us from connections to electrical sockets and grids. To date, the micro fuel cell market is still in a nascent stage so we would need to see both incremental and breakthrough performance gains in order to arrive at this scenario.
1.2 The background and problematics
What has driven the above developments in FCs and what are the major challenges facing FCs today? Firstly, we need to know what exactly a FC is and how it works.
1.2.1 What is fuel cell?
A FC is a galvanic cell which, with the assist of catalysts, converts the chemical energy stored in a fuel directly into electrical energy through an electrochemical reaction between the fuel and an oxidant [5]. Taking the classic H2/O2 FCs as an example, in which H2 gas is the fuel and O2 gas serves as the oxidant. The overall reaction of H2/O2 FCs resembles the simple combustion reaction of H2, given in equation 1.1.
𝑂𝑣𝑒𝑟𝑎𝑙𝑙 𝑟𝑒𝑎𝑐𝑡𝑖𝑜𝑛: 2𝐻2 + 𝑂2 → 2𝐻2𝑂 + 𝐸𝑛𝑒𝑟𝑔𝑦 (𝐻𝑒𝑎𝑡 𝑜𝑟 𝑒𝑙𝑒𝑐𝑡𝑟𝑖𝑐𝑖𝑡𝑦) (1.1)
The hydrogen combustion reaction is an exothermic reaction. When igniting H2 in the air, the energy is released in a disorder explosion. Specifically, at the atomic level, H-H bonds and O-O bonds are broken, while H-O-O bonds are formed during the collisions between H2 molecules and O2 molecules. During the above bonding reconfiguration processes, the energy difference between the initial and final states is released within picoseconds which can only be recoverable in the form of heat energy. To produce electricity, the heat energy must first be transformed into mechanical energy and then converted into electrical energy. The multi-steps (shown in Figure
4
1.2) significantly lower the energy efficiency owing to the energy loss in each step and the Carnot cycle limitation of heat engine.
Figure 1.2 Graphical illustration of the difference in energy conversion between fuel cells and traditional combustion processes [7].
In comparison, FCs offer an alternative way to harness electrons during the processes of bonding reconfiguration between high-energy reactant and low-energy product, enabling to more efficiently convert the chemical energy of the fuel directly into electricity. FCs break the above overall reaction into two halves by using a membrane to keep two gases apart so that electron transfer is necessary to complete the bonding reconfiguration occurring over a greatly extended length scale. Briefly, on one side (anode), as shown in equation 1.2, H2 molecules lose electrons to form protons which travel across the membrane. On the other side (cathode), these protons react with O2 molecules and gain the electrons from the cathode to produce water as represented in equation 1.3.
𝐴𝑛𝑜𝑑𝑒 𝑟𝑒𝑎𝑐𝑡𝑖𝑜𝑛: 2𝐻2 → 4𝐻++ 4𝑒− (1.2)
𝐶𝑎𝑡ℎ𝑜𝑑𝑒 𝑟𝑒𝑎𝑐𝑡𝑖𝑜𝑛: 𝑂2 + 4𝐻++ 4𝑒− → 2𝐻2𝑂 (1.3)
In essence, both reactions on two electrodes take place on the surface of catalysts which enable to lower energy barrier of reactions and thereby improve the overall kinetics. The electricity can be produced by harnessing the electrons as they flow from the anode to the cathode via an external circuit. In FCs, the whole process excludes the conversion of heat to mechanical energy,
5
enabling high conversion efficiency up to 60%. This value is 2-3 times higher than that of the combustion reaction.
Compared with other electrochemical power sources, FCs are able to deliver much higher energy capacity as presented in Ragone plot (Figure 1.3). FCs work similarly to batteries, as both of them generate electricity through electrochemical reactions. However, FCs are not consumed when they generate electricity, which can be viewed as shells of factory that take fuels as raw materials and chunk out electricity as product. They can constantly and instantly supply power as long as fuel is continuously supplied in contrast to batteries needing longer time to be recharged.
Figure 1.3 Ragone plot representing specific energy vs. specific power for traditional power source and electrochemical power sources [4].
1.2.2 Types of fuel cells
At present, many types of FCs are currently under development. The most common classification of FCs is by the type of electrolyte employed in individual cells, mainly including five categories: polymer electrolyte membrane or proton exchange membrane FCs (PEMFCs), solid oxide FCs (SOFCs), molten carbonate FCs (MCFCs), phosphoric acid FCs (PAFCs) and the alkaline FCs (AFCs). The type of electrolyte determines the kind of electrochemical reactions taking place in FCs, the kinds of catalysts qualified, the fuel required, the operation temperature
6
range, and other factors. These characteristics, in turn, determine the applications for which each type of FCs is most suitable. A brief summary of these five FCs is given in Table 1.1.
Among these five main categories of FCs, PEMFCs are regarded as one of the most promising power sources in portable and transportation applications due to low operating temperature and rapid start-up features [8]. The essential part of the PEMFCs is known as membrane electrode assembly (MEA) which consists of two electrodes (anode and cathode) and a proton exchange membrane (such as Nafion ionomer) sandwiched in between. To get a desired electrical power, several MEAs can be combined together to form a fuel cell stack. With respect to fuels, there are varieties of choices which can be gaseous H2 or liquid H-rich organic molecules such as methanol, ethanol, formic acid and ethylene glycol, etc. Accordingly, based on the type of fuel used in the cell, PEMFCs can be further categorized into H2-PEMFCs [9], direct methanol FCs (DMFCs) [10, 11], direct ethanol FCs (DEFCs) [12], direct formic acid FCs (DFAFCs) [13] and direct ethylene glycol FCs (DEGFCs) [14], and so forth.
7
Table 1.1 The comparison of different types of FCs [8, 15].
Fuel cell type Common Electrolyte Operation temperature range (˚C) Charge
carrier Electrode reactions Applications
PEMFC Solid polymer (Nafion) 50 – 100 H+ Anode: 2𝐻2 → 4 𝐻++ 4𝑒− Cathode: 𝑂2+ 4𝐻++ 4𝑒− → 2𝐻2O
Backup power Portable power
Transportation
SOFC Yttria-stablized Zirconina
(YSZ) 600 – 1000 O 2− Anode: 𝐻2+ 𝑂 2−→ 𝐻 2𝑂 + 2𝑒− Cathode: 1 2𝑂2+ 2𝑒 −→ 𝑂2− Auxiliary power Electric utility Large distributed generation MCFC
Molten salt consisting of a binary or ternary mixture of lithium, potassium and/or
sodium carbonate 600 – 700 CO3 2− Anode: 𝐻2+ 𝐶𝑂3 2− → 𝐻2𝑂 + 𝐶𝑂2+ 𝑒− Cathode: 1 2𝑂2+ 𝐶𝑂2+ 2𝑒 −→ 𝐶𝑂 3 2− Electric utility Large distributed generation
PAFC Phosphoric acid soaked in
a matrix 150 – 200 H + Anode: 2𝐻2→ 4𝐻++ 4𝑒− Cathode: 𝑂2+ 4𝐻++ 4𝑒− → 2𝐻2O Distributed generation AFC Aqueous solution of potassium hydroxide soaked in a matrix 60 – 90 OH− Anode: 2𝐻2+ 4𝑂𝐻−→ 4𝐻2𝑂 + 4𝑒− Cathode: 𝑂2+ 𝐻2𝑂 → 4𝑒−+ 4𝑂𝐻− Military Space Backup power, transportation
8
1.2.3 Introduction of DEFCs
In the past few decades, DEFCs have attracted significant attention owing to the attractive attributes of ethanol [12, 16-18]. Ethanol, at room temperature and ambient pressure, is in liquid state and, unlike hydrogen, can be easily handled, stored and transported. In DEFCs, ethanol is not reformed into hydrogen gas but is oxidized directly. As shown in table 1.2, ethanol and other liquid fuels show much higher volumetric energy density than gaseous H2, which makes the system to be more compact and appears high potential application as power sources for portable devices, such as cellular phones, notebook computers, and portable power suppliers. In addition, the use of liquid ethanol enables to utilize the current gasoline infrastructure in contrast to spending a large sum of money on building hydrogen infrastructure.
Table 1.2 The Volumetric and gravimetric energy densities of different small organic fuels [19, 20]
Fuels Volumetric energy density (kWh L-1) Gravimetric energy density (kWh kg-1)
Hydrogen 0.18 (@1000 psi, 25 oC) -
Methanol 4.82 (100 wt.%) 6.09
Ethanol 6.28 (100 wt.%) 8.00
Formic acid 1.75 (88 wt.%) 1.74 [21]
Ethylene Glycol 5.87 (100 wt.%) 5.3
Compared with the most popular liquid alcohol (methanol), ethanol displays numerous advantages including less toxicity, higher theoretical energy density, biocompatibility and wide availability from renewable biomasses such as sugar cane, wheat, corn, straw, or even algae [22]. Brazil that is considered as the bioethanol industry leader and a policy model for other countries, has the world's first sustainable biofuels economy. In 2015, Brazil produced 7093 million gallons of ethanol, is the world’s second largest ethanol producer behind the United States [23]. Canada is a nation of renewable opportunity, and according to Natural Resources Canada [24], Canadian farmers grow millions of tons of crops every year that can be used to produce clean, renewable fuels in the form of bio-ethanol without hurting the nation's food supply. This huge energy source is equal to an annual supply of 436 million gallons of renewable fuels that are largely untapped today [23]. Thus, the rapid growth of bio-ethanol industry has laid a solid foundation for the development of DEFCs.
With respect to the performance of ethanol in FCs, ethanol oxidation shows similar kinetics to that of methanol at low temperatures. On the other hand, compared with methanol, ethanol has
9
smaller permeability through Nafion membrane [18, 25]. Therefore, ethanol presents a lower crossover rate than methanol and thus influences less severely on the energy conversion efficiency than methanol.
Figure 1. 4 Schematic diagram of a typical MEA in DEFCs [26].
As with other PEM-based FCs, the pivotal part of DEFCs is the MEA with a sandwich-like structure [8]. As depicted in Figure 1.4, a single MEA consists of a proton-exchange membrane in contact with an anode and a cathode electrode on either side. So far, the most mature, commercially available, performance-durability membrane employed for PEM-based FCs is Nafion® membrane made by DuPont which is in charge of transporting protons generated from
the anode to the cathode and spatially separating two electrodes. As for the anode and cathode electrodes, catalysts must be used for these reactions to occur effectively. The energy conversion efficiency of DEFCs largely depends on the catalytic performance of the catalysts on the anode and cathode. Till now, Pt-based catalysts are considered to be the most practical catalysts for both anode and cathode reaction in terms of both performance and durability.
In comparison to H2 oxidation, as shown in equation 1.4, the ethanol oxidation reaction (EOR) at the anode is a more complex, multiple-electron process. It involves the cleavage of C-H, C-O, and C-C bonds and the complete oxidation of ethanol delivers 12 electrons, surpassing 6 electrons in DMFCs and 2 electrons in H2-PEMFCs [27]. Resembling H2-PEMFCs, gaseous O2
10
is supplied to cathode of DEFCs, and oxygen reduction reaction (ORR) occurs by combining O2 with electrons and protons generated on the anode (equation 1.5) [22, 27]. As a result, the overall reaction of DEFCs is presented by equation 1.6, with the enthalpy change (Δ𝐻0), Gibbs free energy (Δ𝐺0), and equilibrium standard electromotive force (emf) of −1367.9 kJ mol-1, −1326.7 kJ mol-1 and 1.145 V, respectively [22, 27].
𝐴𝑛𝑜𝑑𝑒 𝑟𝑒𝑎𝑐𝑡𝑖𝑜𝑛: 𝐶𝐻3𝐶𝐻2𝑂𝐻 + 3 𝐻2𝑂 → 2𝐶𝑂2+ 12𝐻++ 12𝑒− 𝐸0= 0.084 𝑉 𝑣𝑠 𝑆𝐻𝐸 (1.4)
𝐶𝑎𝑡ℎ𝑜𝑑𝑒 𝑟𝑒𝑎𝑐𝑡𝑖𝑜𝑛: 3𝑂2 + 12𝐻++ 12𝑒− → 6𝐻2𝑂 𝐸0= 1.229 𝑉 𝑣𝑠 𝑆𝐻𝐸 (1.5)
𝑂𝑣𝑒𝑟𝑎𝑙𝑙 𝑟𝑒𝑎𝑐𝑡𝑖𝑜𝑛: 𝐶𝐻3𝐶𝐻2𝑂𝐻 + 3𝑂2 → 2𝐶𝑂2+ 3 𝐻2𝑂 𝐸0= 1.145 𝑉 𝑣𝑠 𝑆𝐻𝐸 (1.6)
Under reversible standard conditions, the theoretical energy efficiency defined as the ratio between the usable energy Δ𝐺0 and the total energy from the chemical reaction, Δ𝐻0, can be
determined with equation 1.7.
𝜂𝑡ℎ𝑒𝑜=
𝛥𝐺0
𝛥𝐻0× 100% =
1326.7
1367.9× 100% = 97% (1.7) Although the thermodynamic data of DEFCs is promising, the kinetics of ethanol oxidation is more difficult that leads to a high overpotential and a low current density. Under operating conditions, the cell voltage measured at a current density j becomes smaller than the equilibrium potential 𝐸0 as a result of three primary potential losses [28]. The actual cell voltage 𝐸𝑐𝑒𝑙𝑙 is
defined as [28]
𝐸𝑐𝑒𝑙𝑙 = 𝐸0− 𝛥𝐸𝑎𝑐𝑡𝑖− 𝛥𝐸𝑜ℎ𝑚𝑖𝑐− 𝛥𝐸𝑐𝑜𝑛𝑐 (1.8)
where 𝛥𝐸𝑎𝑐𝑡𝑖 is the activation loss or activation overpotential resulted from the need to move
electrons and to break/form chemical bonds in both EOR and ORR; 𝛥𝐸𝑜ℎ𝑚𝑖𝑐 is the ohmic loss
primarily due to material and interface resistances; 𝛥𝐸𝑐𝑜𝑛𝑐 is the concentration loss or
concentration polarization caused by the decrease in concentration of reactants on both the anode and the cathode as they are consumed in reactions. Figure 1.5 shows a typical polarization curve of a DEFC, displaying the above mentioned losses in potential. At low current densities, there is a sharp drop in potential and activation loss is the most important cause due to the sluggish kinetic rates of both EOR and ORR. To lower activation losses, more active catalysts are demanded on both electrodes. So far, Pt-based catalysts have been widely used as catalysts for both EOR and ORR in DEFCs [29]. At intermediate current densities, ohmic losses become more
11
pronounced. As current intensity keeps increasing, the cell voltage declines dramatically due to the mass transport limit of reactants accessible to the reactive sites in catalysts layers.
Figure 1.5 Schematic of an ideal polarization curve with the corresponding regions and ovepotentials [28].
Therefore, the potential efficiency must to be taken into account when calculate the overall efficiency of a DEFC. The potential efficiency is defined as follows:
𝜂𝑝𝑜𝑡𝑒𝑛𝑡𝑖𝑎𝑙=
𝐸𝑐𝑒𝑙𝑙
1.145 × 100% (1.9) For the complete oxidation reaction of ethanol to CO2, under operating conditions, the practical energy efficiency for a DEFC is defined as follows:
𝜂 = 𝜂𝑡ℎ𝑒𝑜 × 𝜂𝑝𝑜𝑡𝑒𝑛𝑡𝑖𝑎𝑙= 97% ×
𝐸𝑐𝑒𝑙𝑙
1.145 × 100% (1.10) Given 𝐸𝑐𝑒𝑙𝑙 of a DEFC is 0.5 V, the energy efficiency is 42%.
However, in addition to the aforementioned losses in efficiency, there are still other significant issues need to be addressed. For example, the problem related to the complicated reaction process of EOR and ORR occurring on anode and cathode, respectively. On the anode,
12
instead of complete oxidation to CO2 releasing 12 electrons, other by-products such as acetic acid and acetaldehyde are often yielded via incomplete reaction paths, leading to a considerable loss in energy efficiency. On the cathode, H2O2 is often formed other than H2O, further contributing to the decrease in energy efficiency. Another significant issue is the ethanol crossover effect [17], even though less severe than methanol. Ethanol crosses through the polymer membrane to the cathode, leading to the cathode experiencing a mixed potential as both EOR and ORR taking place at the same electrode. As a result, the cathode potential gets lower, causing a further decrease in the potential efficiency beside of the aforementioned three potential losses.
Therefore, how to overcome these efficiency losses become the main objectives and working directions for the study and development of DEFCs. Briefly, it includes exploring highly active, selective and durable catalysts for EOR and ORR; and developing high proton-conductive, stable membrane with low ethanol permeability. In the context of the present work, the materials which have been developed are Pt-based catalysts mainly for the EOR in acid medium. However, it is also within our interest to discover the potential application of synthesized catalysts of this doctoral project for ORR.
13
REFERENCES
[1] BP. BP Statistical Review of World Energy 2016, London, BP, (2016) pp. 7 (oil), p. 21(gas), p. 31 (coal) http://www.bp.com/energyoutlook (Accessed November 7th, 2016).
[2] U.S. Department of Energy, U.S. Energy Information Administration (EIA), Independent Statistics & Analysis. International energy outlook 2016, Washington, DC, (2016) pp. 5 http://www.eia.gov/forecasts/ieo/ (Accessed November 7th, 2016).
[3] U.S. Department of Energy, U.S. Energy Information Administration (EIA), Independent Statistics & Analysis. International energy outlook 2016, Washington, DC, (2016) pp. 9 http://www.eia.gov/forecasts/ieo/ (Accessed November 7th, 2016).
[4] M. Winter, R.J. Brodd. Chem. Rev., 104 (2004) 4245-4270.
[5] G. Hoogers. Fuel cell technology handbook, CRC press, Boca Raton, FL, 2003.
[6] U.S. Department of Energy, Office of Energy Efficiency & Renewable Energy, Fuel Cell Technologies Office. Fuel Cell Technologies Market Report 2014, Washington, D.C, (2015) pp. 13 http://energy.gov/eere/fuelcells/market-analysis-reports (Accessed November 7th, 2016). [7] S. Sun. DEVELOPMENT OF NOVEL NANOMATERIALS FOR HIGH-PERFORMANCE AND LOW-COST FUEL CELL APPLICATIONS PhD Dissertation in Mechanical and Materials
Engineering (The University of Western Ontario, London, Ontario, Canada) (2011) 263 p. [8] J. Zhang. PEM fuel cell electrocatalysts and catalyst layers: fundamentals and applications, Springer Science & Business Media, 2008.
[9] H.A. Gasteiger, S.S. Kocha, B. Sompalli, F.T. Wagner. Appl. Catal. B, 56 (2005) 9-35. [10] S. Basri, S.K. Kamarudin, W.R.W. Daud, Z. Yaakub. Int. J. Hydrogen Energy, 35 (2010) 7957-7970.
[11] V. Neburchilov, J. Martin, H. Wang, J. Zhang. J. Power Sources, 169 (2007) 221-238. [12] E. Antolini. J. Power Sources, 170 (2007) 1-12.
[13] X. Yu, P.G. Pickup. J. Power Sources, 182 (2008) 124-132. [14] A. Serov, C. Kwak. Appl. Catal. B, 97 (2010) 1-12.
[15] A. Brouzgou, A. Podias, P. Tsiakaras. J. Appl. Electrochem., 43 (2013) 119-136. [16] J. Friedl, U. Stimming. Electrochim. Acta, 101 (2013) 41-58.
[17] S. Song, P. Tsiakaras. Appl. Catal. B, 63 (2006) 187-193.
[18] M.Z.F. Kamarudin, S.K. Kamarudin, M.S. Masdar, W.R.W. Daud. Int. J. Hydrogen Energy, 38 (2013) 9438-9453.
14 Materials and Devices, John Wiley & Sons, 2010.
[20] J. Zhang, H. Liu. Electrocatalysis of direct methanol fuel cells: from fundamentals to applications, John Wiley & Sons, 2009.
[21] C. Rice, S. Ha, R. Masel, A. Wieckowski. J. Power Sources, 115 (2003) 229-235.
[22] S. Badwal, S. Giddey, A. Kulkarni, J. Goel, S. Basu. Applied Energy, 145 (2015) 80-103. [23] Renewable Fuels Association. World Fuel Ethanol Production.
http://ethanolrfa.org/resources/industry/statistics/#1454098996479-8715d404-e546 (Accessed November 7th, 2016).
[24] Natural Resources Canada,. Ethanol. http://www.nrcan.gc.ca/energy/alternative-fuels/fuel-facts/ethanol/3493 (Accessed November 7th, 2016).
[25] S. Song, W. Zhou, Z. Liang, R. Cai, G. Sun, Q. Xin, V. Stergiopoulos, P. Tsiakaras. Appl. Catal. B, 55 (2005) 65-72.
[26] C. Lamy, A. Lima, V. LeRhun, F. Delime, C. Coutanceau, J.M. Léger. J. Power Sources, 105 (2002) 283-296.
[27] C. Lamy, A. Lima, V. LeRhun, F. Delime, C. Coutanceau, J. Léger. J. Power Sources, 105 (2002) 283-296.
[28] C. Lamy, C. Coutanceau, J.M. Leger. Catalysis for sustainable energy production, (2009) 1-46.
15
CHAPTER 2 LITERATURE REVIEW
2.1 Introduction to anode catalysts for DEFCs
Catalysts play a significant role in the cost, performance, and durability of DEFCs. In terms of the catalytic performance and durability, Pt and Pt-based catalysts are the most commonly used and extensively investigated anode and cathode catalysts for DEFCs operated in acidic medium [1-8]. Due to the high cost and limited sources of Pt, reducing the loading of Pt in catalysts layer is of critical importance to overcome the cost barrier for the commercialization of DEFCs [8]. Therefore, in order to maximize the utilization of Pt, the most common approach is to disperse nanostructured Pt catalysts on high-surface-area support materials such as carbon black (e.g. Vulcan XC-72) [9, 10]. To date, Vulcan XC-72 supported Pt is widely used as anode and cathode catalysts in DEFCs. Indeed, Vulcan XC-72 support greatly improves the catalytic activity of catalysts. While over long term operation of FCs, it undergoes severe corrosion, causing the agglomeration, dissolution, and isolation of Pt nanoparticles, in turn largely impairing the performance and durability of DEFCs [5, 11].
It is well known that Pt as anode catalysts is very active towards C-H bonding cleavage and dissociative adsorption of ethanol, but it cannot accomplish the complete oxidation of ethanol to CO2 releasing 12 electrons by effectively breaking C-O and C-C bonds at low temperatures. Through incomplete oxidation of ethanol (2-electron and 4-electron oxidation), undesired by-products acetaldehyde (CH3CHO, AAL) and acetic acid (CH3COOH, AA) are formed, respectively. The incomplete oxidation of ethanol not only lowers the energy efficiency due to fewer electrons exchanged relative to the complete oxidation reaction, but also gives rise to acetate or (bi)sulfate that strongly adsorbs on the surface of catalysts and significantly affects the reactivity of the catalysts [12, 13]. In addition, Pt itself has low resistance to poisoning, since intermediate species such as COads could be strongly adsorbed on its surface, poisoning the catalysts and consequently leading to a sluggish reaction rate and even an irreversible degradation of the catalytic performance [14].
To address the above challenges in DEFCs, a great deal of work has been focused on exploring multi-component catalysts in comparison to pure Pt, aimed to obtain highly active, selective and durable catalysts. In recent years, many attempts have been made, such as combining Pt with non-noble transition metals to form binary/ternary catalysts, incorporating
16
transition metal oxides to Pt to form nanocomposite catalysts. A detailed literature review concerning the studies on Pt-transition metal (Pt-M) and Pt-transition metal oxides catalysts is elaborated in the following section. According to the scope of this thesis, catalysts applied in the acidic medium will be exclusively presented and discussed.
2.2 Ethanol oxidation on Pt-M bimetallic catalysts
With regard to Pt-based bimetallic catalyst for ethanol oxidation reaction, different transition metals have been introduced such as Ru [15-18], Sn [16, 19-24], Rh [18, 25], Au [26, 27], Mo [28] in order to enhance the activity, durability and selectivity of Pt. As in the case of the methanol oxidation, there are two widely accepted mechanisms to account for the improvement in catalytic performance for EOR: bifunctional mechanism [29, 30] and electronic (ligand) effect [1, 31, 32].
The bifunctional mechanism was proposed in the 70s by Watanabe and Motoo to explain the promotion of CO oxidation on PtRu catalysts [29]. According to bifunctional mechanism, two kinds of active sites are required for the EOR. One kind of active site on Pt surface is responsible for adsorbing and dissociating ethanol molecules. The other kind of active site on transition metals is for water adsorption and activation to provide oxygenated species (OH) at lower potentials. The OH species facilitate the oxidative removal of adsorbed carbonaceous generated on neighboring Pt sites, giving an enhanced catalytic performance. The whole process can be briefly depicted by equation 2.1 and 2.2 [10]:
𝑀 + 𝐻2𝑂 → 𝑀 − 𝑂𝐻 + 𝐻++ 𝑒− (2.1)
𝑃𝑡 − 𝐶𝑂 + 𝑀 − 𝑂𝐻 → 𝑃𝑡 + 𝑀 + 𝐶𝑂2+ 𝐻++ 𝑒− (2.2)
With regard to electronic effect, the presence of certain transition metals alters the electronic structure of Pt, which can be described as the change in the location of d-band center. According to the proposal of Nørskov and his co-workers, the shift of d-band center leads to the variation in the bond strength between reactive surface and adsorbates [33, 34]. A higher-lying d-band center with respect to the Fermi level indicates a more reactive surface which tends to bond with adsorbates more strongly, and conversely, a surface with a lower-lying d-band center tends to form weaker bonds with adsorbates. As for the EOR on pure Pt, a relatively high d-band center of Pt facilitates the dissociative chemisorption of ethanol molecules, giving rise to a higher coverage of CO species which are strongly bonded to active sites of Pt and thus rapidly poison
17
the catalysts. In the case of EOR on Pt-M (e.g. Ru, Sn) catalysts, a downshift of Pt surface d-band center could lower the adsorption energy of CO poisoning species, facilitating the removal of COads [35]. Whereas if the d-band center is too low, it would diminish the adsorption ability of Pt with ethanol molecules, and thus the reactive intermediates are too low to enable a high turnover rate of the EOR. Therefore, an optimal d-band center of a catalyst is required to achieve the highest catalytic activity. The location of d-band center of Pt-based catalysts is largely affected by the nature of foreign metal alloyed to Pt (or used to modify Pt) and the composition of alloy.
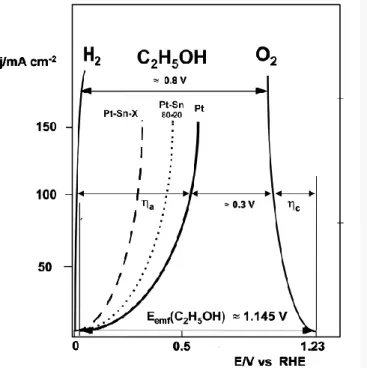
Among investigated Pt-based bimetallic electrocatalysts, Pt-Sn catalysts were found to be the most active catalyst for the EOR in acidic medium [14, 20-22, 36-39], which contrasts with the case of MOR in which PtRu catalysts are known to be the most effective one[40-42]. In single DEFC test, compared to pure Pt, the enhancement of Pt-Sn catalysts in electrocatalytic activity is demonstrated in Figure 2.1 [19]. At the current density of 100 mA cm-2, the overpotential of ethanol oxidation on pure Pt is about 0.6 V which is 200-300 mV higher than that on Pt-Sn bimetallic catalysts and can be further reduced on Pt-Sn-X (X: Ni) catalyst [1].
Figure 2.1 j/E curves of DEFCs with Pt-based material as anode catalysts, compared to that of a H2
PEMFC with Pt catalysts as anode catalysts [19].
Therefore, particular attention of the study of bimetallic catalysts is given to Pt-Sn based catalysts, including the main effect on EOR activity, the oxidation mechanism investigation on Pt-Sn. The catalyst composition, the degree of alloying and the content of Sn oxides were identified to be the main factors influencing the catalytic performance towards the electrooxidation of
18
ethanol [1]. However, so far there is no common agreement on the optimum conditions for Pt-Sn towards EOR. Sometimes, the results are even contradictory. Regarding the composition effect, Zhou and co-workers synthesized Pt-Sn/C catalysts with varied Pt:Sn atomic ratios (1:1, 3:2, 2:1, 3:1 and 4:1) and the optimum composition of Sn was in the range 33-40 at.% depending on the operating temperature [22, 43]. Similarly, Kim et al. prepared PtSn/C catalyst with the same variations in Pt:Sn ratio (Pt:Sn = 1:1, 3:2, 2:1, 3:1, 4:1) by reducing Pt salt and Sn salt precursors with borohydride and followed by freeze-drying procedure [44]. They found that the charge transfer from Sn to Pt could mitigate the poisoning of catalysts by partially filling Pt 5d band vacancies. PtSn/C with 33 at.% of Sn exhibited the highest current density for EOR with CV characterization. With an alcohol reduction process, Spinacé et al. reported Pt-Sn/C electrocatalysts with the Pt:Sn atomic ratio of 1:1 was better than two other compositions (1:3 and 3:1)[45]. Asgardi et al. prepared a series of PtSn catalysts with different Pt:Sn atomic ratio (1:1 and 3:1) by using formic acid, supported on two kinds of carbon materials, carbon Vulcan XC-72R and carbon nanofibers (CNF) [46]. It was found that Pt1Sn1 anodes exhibited higher activity toward EOR in half-cell experiments than Pt3Sn1, irrespective of support materials. The authors ascribed it to higher content of Pt3Sn1 crystallite phase in catalysts with Pt:Sn atomic ratio of 1:1 with respect to that of 3:1, which was determined by the extended lattice parameters from XRD. On the contrary, Lamy et al reported the optimum content of Sn for Pt-Sn catalysts in the range 10–20 at.% is much lower than the values reported by the above authors[38, 47]. Bommersbach et al. prepared Pt-Sn catalysts by using crossed beam pulse laser deposition (CBPLD) [24]. Four compositions were investigated, namely, Pt9Sn1, Pt3Sn1, Pt1Sn1, and Pt3Sn7. Pt3Sn1 displayed the best catalytic activity and durability characterized by cyclic voltammetry (CV) and chronoamperometry (CA) techniques. However, we still get conclude that compositions richer in platinum are favored for electro-oxidation of ethanol. The large range in the optimal composition of Pt-Sn catalysts towards EOR could be attributed to the preparation approaches. Song et al. have prepared two kinds of PtSn/C catalysts with different preparation procedures, a modified polyol approach and co-precipitation [37]. PtSn/C-a catalysts were prepared by the directly depositing Sn on Pt/C via a modified polyol process and PtSn/C-b catalysts were obtained by simultaneous deposition of Pt and Sn on the carbon supports via a co-precipitation process. From single DEFC tests, the cell using PtSn/C-b as anode catalysts displayed a higher electrocatalytic activity at high current density than that using PtSn/C-a, despite both catalysts showed a similar initial activity. The authors attributed the inferior performance of PtSn/C-a to a higher content of Sn oxides which led to higher internal cell resistance and part coverage of Pt active sites. Indeed, it has been reported by many groups that in most cases Sn in PtSn catalyst is present in two
19
states: non-alloyed oxidized state (Sn oxides), and alloyed metallic state which forms faced-centered-cubic (fcc) solid solution with Pt atoms. The content of Sn oxides and the degree of alloying have been reported to be of importance for the catalytic performance of binary Pt-Sn catalyst toward EOR. However, so far, controversial results regarding the effect of the degree of alloying on the EOR activity of Pt alloy catalysts have been reported. Colmenares et al. compared the EOR catalytic activities of polyol-type Pt/C, PtRu/C and Pt3Sn/C catalysts with those of commercial Pt/C, PtRu/C and Pt3Sn/C (E-Tek) catalysts[48]. All polyo-type catalysts displayed inferior performance than their commercial counterparts in terms of the mass activity and active surface area specific activity, which was ascribed to the lower alloying degree of Sn in polyol-type catalysts. In agreement with the observations of Colmenares, Zhu et al. reported that PtSn catalysts with high degree of alloying (denoted as PtSn/C-B) showed better EOR activity than that with low alloying degree (denoted as PtSn/C-EG) and the catalysts with only non-alloyed oxidized Sn (denoted as PtSnO2/C) [49]. They found that the PtSnO2/C catalyst could only enhance the EOR activity below 0.36 V due to readily forming OH species on SnO2 at lower potentials which is favorable for the removal of COads species, whereas catalyst with high alloying degree could promote the activity over the entire potential range owing to the changes in electronic and geometric structure. Similar results have also been reported by other researchers. Godoi et al. prepared Pt-Sn/C catalysts with varied amount of oxidized and alloyed form of tin but the identical overall composition (Pt:Sn=7:3) and nearly the same particle sizes (around 3 nm) [50]. In the absence of the composition and size effect, it was found that the Pt-Sn/C catalysts displayed an increase in EOR catalytic activity by increasing the amount of metallic Sn at the expense of the oxides, attributed to a more filled Pt d-band in PtSn alloy facilitating the effective removal of COads.
Conversely, Antoniassi et al. observed that the catalysts with higher content of Sn oxides displayed superior EOR performance than the PtSn catalysts with high alloying degree [51]. They observed almost 70% more power density on Pt3(SnO2)/C than Pt3Sn/C (alloy) electrode in single DEFC tests. The product distribution results evaluated with gas chromatography (GC) technique, indicated that Pt3(SnO2)/C catalysts had a higher selectivity for AA production (4 electrons releasing) while Pt3Sn/C mainly produced AAL by releasing 2 electrons. Alternatively, Jiang et al. prepared two types of catalysts with the same nominal Pt:Sn ratio, PtSnOx and PtSn alloy, by using a modified polyol approach [20]. From the results of chronoamperometry and single DEFC tests, PtSnOx catalysts better performed than PtSn alloy toward EOR. The authors deduced that the unchanged lattice constant of Pt in the PtSnOx catalyst enables the effective adsorption of ethanol, and simultaneously the SnOx in the vicinity of Pt could supply OH species which facilitate the removal of poisoning COads residues from Pt active sites. They also proposed that an ideal
20
PtSn anode catalyst for DEFCs should contain both PtSn alloy and PtSnOx components with optimum compositions. In similar, Colmati et al. have also demonstrated that the activity of Pt-Sn/C catalysts seems to be dependent on the amount of both non-alloyed and alloyed phase of Sn [52]. The DEFCs operating conditions (such as DEFC operation temperatures) affect the rate-determining step (rds) of EOR and thus the optimal content of each form of Sn are varied accordingly. They found that the oxidation of COads species was the rds at low temperatures of electrochemical experiments, and the presence of tin oxides were favorable to increase the DEFC performance by offering adequate OH species. Whereas at high temperatures, the rds was the dissociative adsorption of ethanol and/or the oxidation of AAL to AA: both reactions could be increased with the increase of the amount of alloyed Sn.
The discrepancies among various studies on Pt-Sn catalysts could be attributed to a variety of influencing factors such as size, crystallinity, shape, composition of the catalysts, the content of each kind of phase for Sn (alloyed or non-alloyed). Furthermore, different synthesize methods may also bring impurities such as organic solvent and reducing agent that affect the catalytic behaviors of catalysts as well. Besides, the electrochemical testing conditions such as temperature, concentration of ethanol, and so forth could also play a critical role in the catalytic performance of investigated catalysts. The complexity of ethanol oxidation process is another important reason. Regarding the oxidation mechanism of ethanol on Pt-Sn catalysts, conflicting results have also been reported, including reaction paths, product distribution, and so on.
From the studies on Pt-Sn binary catalyst, there is no question that the addition of Sn does improve the catalytic performance towards ethanol oxidation, lower reaction overpotential, and boost output energy. While a consensus gained from the research on Pt-Sn catalyst is that Pt-Sn cannot accomplish the complete oxidation of ethanol at low temperatures and low potentials, but helps to produce AAL and AA as main products through 2- and 4-electron transfer, respectively. It is crucial and necessary to develop novel catalysts that exhibit high activity and selectively for the EOR.
2.3 Ethanol oxidation on functional metal oxide–based catalysts
In addition to extensive studies on Pt-M catalysts, much effort has been made to explore novel Pt-based catalyst by introducing diverse functional metal oxides (FMOs) such as CeO2, SnO2, MnO2, TiO2, WO3, etc. As is well known, these FMOs are cheap and abundant compared with Pt, and thus the incorporation of high specific-surface-area FMOs could largely reduce the
21
cost of catalysts. Furthermore, these FMOs also possess the following important characteristics qualifying their potential applications in DEFCs:
1) High chemical and electrochemical stability under fuel cell operating conditions, reducing the agglomeration or coalescence of catalysts nanoparticles and thus increasing their durability.
2) The Strong interaction of catalyst nanoparticles with oxide supports (metal-support interaction, SMSI) could immobilize catalysts nanoparticles on the surfaces of support materials, preventing from the growth and sintering of catalyst nanoparticles, and could also alter the electron distribution of catalysts enabling to diminish the CO poisoning effect [53].
3) Readily forming abundant hydroxyl (OH) groups on their surfaces, which could promote the catalytic performance on the basis of bifunctional mechanism [54].
It has been reported that FMOs in DEFCs serve as support materials to increase the utilization of Pt, and/or as co-catalysts (promoter) to assist certain catalytic processes [10]. However, most FMOs have a low electronic conductivity which could be enhanced by Nano-structuring them or by combining them with highly conductive carbon materials to form composites or by doping foreign elements. In the composites, nanostructured carbons are considered as the primary supports, such as carbon nanotubes, graphene, mesoporous carbon, and so forth. FMOs are considered as the secondary supports which are generally used to promote and modify the primary supports [9].
In the following part, several FMOs are particularly chosen to be introduced in detail, including their structure, properties, emerging features relevant to the DEFCs application, and the studies conducted on Pt-FMOs systems for ethanol oxidations.
22
2.3.1 CeO
2–based catalysts
Figure 2.2 The crystal structure of CeO2.
CeO2, named cerium (di)oxide or ceria, is the most abundant rare earth oxide which exhibits a fluorite (CaF2) crystal structure (space group Fm3̅𝑚) with lattice constant a = 5.4113 Å. Figure 2.2 presents a unit cell of CeO2, where each cerium cation is coordinated by eight equivalent nearest-neighbor oxygen anions, whereas each oxygen anions is coordinated by four equivalent cerium cations [55].
Ceria is not only a technologically important functional material in the industry but also one of the most actively investigated materials in academia. From 1950 to 2015, the publication number concerning “CeO2” or “ceria” exceeds 26000 covering a wide range of applications including catalysis [53, 56-60], solid oxide fuel cells (SOFCs) [60, 61], photocatalysis [62, 63], oxygen sensors [64, 65], glass polishing [66], ultraviolet absorbent, ceramics, electrochromic thin-film application, environmental chemistry etc., owing to its diverse properties, such as electronic (high oxygen ion conductivity), optical (high refractive index, high transmission, violet and blue emission), mechanical (high adhesion, hardness, stability towards abrasion), etc. [55, 58]. Owing to the catalytic property, ceria is an important constituent in SOFCs and three-way catalysts in the automotive industry, which is considered to be mainly related to its exceptional redox property (oxygen storage capacity) and oxygen transport property (oxygen ion conductivity). Redox property refers to its ability to repeatedly pass through redox cycles rapidly while retaining its fluorite structure, which is related to the ease in forming and eliminating oxygen vacancies at the surface of solid ceria, endowing ceria a high oxygen storage property [55]. Specifically, when exposed to a reducing atmosphere at elevated temperatures (above 685 oC), CeO2 could be readily transformed into non-stoichiometric CeO2-x oxides (0 < 𝑥 ≤ 0.286) by forming a continuum
23
of oxygen-deficiencies accompanied by the reduction of Ce(IV) to Ce(III), which can be expressed following the Kröger-Vink notation as:
2𝐶𝑒𝐶𝑒× + 𝑂𝑂×→ 𝑉𝑂∙∙+ 2𝐶𝑒𝐶𝑒′ +
1
2𝑂2(𝑔𝑎𝑠) (2.3) where 𝐶𝑒𝐶𝑒×, 𝑂𝑂×, 𝑉𝑂∙∙, 𝐶𝑒𝐶𝑒′ represent cerium ions in the lattice, oxygen ions in the lattice, doubly charged oxygen vacancies, and cerium anions on the lattice site with single negative charge, respectively. On the contrary, under oxidizing conditions at lower temperatures, the partially reduced ceria can be re-oxidized back to CeO2 and remaining its fluorite structure. The non-stoichiometric form at elevated temperatures exhibits both electronic and ionic conduction, and ionic conduction becomes dominant at a temperature above 500 oC mainly due to increased oxygen vacancies. The concentration of oxygen vacancies is usually determined by using X-ray photoelectron spectroscopy (XPS) to compare the ratio of Ce3+ to Ce4+.
It has been reported that the concentration of oxygen vacancy defect in ceria plays an important role in the conductivity and the reactivity of ceria for different catalytic reactions such as the CO oxidation, SO2 reduction by CO. Compared with bulk material, there are high densities of interfaces in nanocrystalline ceria which substantially reduces the energetics for the formation of defects (oxygen vacancies), resulting in remarkably increased degrees of non-stoichiometry. As a consequence, nanostructured ceria displays an improved oxygen storage capacity and oxygen ion conductivity with respect to its bulk counterpart. These features appear to contribute to the unusual catalytic activity of nanostructured ceria.In the last decades, nanostructured CeO2 have been extensively studied either as co-catalysts or as modifier/promoter of primary carbon support materials of noble catalysts for electro-oxidations of small organic molecules (like CO, methanol, and ethanol) and the reduction reaction of oxygen in fuel cell (FC) applications. Pronounced improvements in catalytic activity and durability have been widely observed towards different electrocatalytic reactions including ORR [67], MOR [68-70], EOR [71, 72], and so on.
The promotion effect of CeO2 in Pt-CeO2 systems for catalytic reactions can be summarized as follows:
1) The strong interaction between Pt and ceria, not only inhibits the growth and sintering of Pt metal particles but also alters the electronic structure of Pt improving CO poisoning resistance, leading to the enhanced activity and durability of the catalysts. By combining density functions theory (DFT) calculations (theoretical study) and synchrotron-radiation photoelectron spectroscopy (experimental study), Vayssilov identified two types of oxidative metal-oxide interaction coexist when nanostructured CeO2 is in close contact
24
with Pt: (i) electron transfer from the Pt nanoparticle to the ceria, and (ii) activated oxygen transfer from ceria to Pt (called oxygen reverse spillover) [53]. They found the oxygen reverse spillover phenomenon is a nanoscale effect: it is operative on nanostructured ceria only, but not on the surface of ordered bulk ceria. Their finding rationalized the significant promotion on the catalytic activity of nanostructured ceria. Ou et al demonstrated the presence of strong metal-oxide interaction via electron energy loss spectroscopy (EELS) on Pt-CeO2/C catalysts, and the interaction was enhanced with the increasing of Pt:Ce atomic ratio [70]. They found that the redox reaction took place between Pt and CeO2, resulting in the formation of Ce1-yPtyO2-z - type solid solution. The microstructural and chemical features due to the interaction between Pt and ceria can account for the promotion effect of ceria on MOR.
2) According to bifunctional mechanism, OH groups could readily form on the surfaces of ceria, facilitating the removal of CO species generated by the ethanol oxidation on the neighboring Pt, leading to improved activity and durability of the catalysts.
3) In the presence of CeO2, catalysts show higher selectivity to CO2 for EOR. Neto et al. prepared PtSn/CeO2-C by an alcohol-reduction process and the best results were found on the catalyst with 15 wt% CeO2 which exhibits much higher EOR performance than the PtSn/C catalysts [72, 73]. Their Fourier Transform Infrared (FTIR) spectroscopy studies showed that the main products were CO2 and AA on PtSn/CeO2–C catalysts, in comparison to AAL and AA on PtSn/C catalysts [73].
2.3.2 SnO
2–based catalysts
SnO2, tin dioxide, crystallises in a tetragonal rutile structure (space group P42mnm) with lattice parameters: a = 4.738 Å and c = 3.187 Å [74]. As shown in Figure 2.3, the tin cations are surrounded by an octahedron of 6 oxygen atoms, and the oxygen anions form a trigonal planar coordination. SnO2 is commonly regarded as an oxygen-deficient n-type semiconductor with a wide band gap (ca. 3.6 eV for bulk at room temperature) [74]. Owing to its remarkable electrical, optical, and electrochemical properties, SnO2 is an important component in various applications such as solar cells, solid-state chemical sensors [75-77], lithium ion batteries [78, 79], and fuel cell applications [80-87].
![Figure 1.2 Graphical illustration of the difference in energy conversion between fuel cells and traditional combustion processes [7]](https://thumb-eu.123doks.com/thumbv2/123doknet/5385605.125128/17.918.174.750.169.503/figure-graphical-illustration-difference-conversion-traditional-combustion-processes.webp)
![Figure 1.3 Ragone plot representing specific energy vs. specific power for traditional power source and electrochemical power sources [4]](https://thumb-eu.123doks.com/thumbv2/123doknet/5385605.125128/18.918.194.727.357.774/figure-ragone-representing-specific-specific-traditional-electrochemical-sources.webp)
![Figure 1.5 Schematic of an ideal polarization curve with the corresponding regions and ovepotentials [28]](https://thumb-eu.123doks.com/thumbv2/123doknet/5385605.125128/24.918.200.721.166.590/figure-schematic-ideal-polarization-curve-corresponding-regions-ovepotentials.webp)
![Figure 2.5 Polyhedral representations of the crystal structures of different MnO 2 and [MnO 6 ] octahedron](https://thumb-eu.123doks.com/thumbv2/123doknet/5385605.125128/43.918.128.807.289.461/figure-polyhedral-representations-crystal-structures-different-mno-octahedron.webp)
![Figure 2.6 Schematic of the global reaction mechanism for the electro-oxidation of ethanol on Pt electrodes in acidic medium [131, 139, 144]](https://thumb-eu.123doks.com/thumbv2/123doknet/5385605.125128/45.918.225.702.372.605/figure-schematic-reaction-mechanism-electro-oxidation-ethanol-electrodes.webp)

![Figure 3.4 Schematic diagram of the CVD reactor for CNTs growth [13].](https://thumb-eu.123doks.com/thumbv2/123doknet/5385605.125128/61.918.155.766.461.776/figure-schematic-diagram-cvd-reactor-cnts-growth.webp)