The age-calibrated measured glomerular filtration rate improves living
kidney donation selection process
François Gaillard1,2, Marie Courbebaisse2,3, Nassim Kamar4,5, Lionel Rostaing6, Arnaud Del Bello4, Sophie Girerd7, Michèle Kessler7, Martin Flamant8,9, Emmanuelle Vidal-Petiot8,9, Marie-Noelle Peraldi9,10, Lionel Couzi11,12, Pierre Merville11,12, Paolo Malvezzi6, Benedicte Janbon6, Bruno Moulin13, Sophie Caillard13, Philippe Gatault14, Matthias Büchler14, Nicolas Maillard15, Laurence Dubourg16,17, Olga Roquet16, Cyril Garrouste18, Christophe Legendre1,2, Pierre Delanaye19,20 and Christophe Mariat15,20
1 Renal Transplantation Department, Assistance Publique-Hôpitaux de Paris (AP-HP), Necker Hospital, Paris, France; 2Paris Descartes University, Sorbonne Paris Cité, Paris, France;
3Physiology Department, AP-HP, Georges Pompidou European Hospital, and Institut National de la Santé et de la Recherche Médicale (INSERM), Unit 1151, Paris, France;
4Departments of Nephrology and Organ Transplantation, Centre Hospitalier Universitaire (CHU) Rangueil, Toulouse, France; 5INSERM U1043, Institut Fédératif de Recherche -BioMédicale de Toulouse, Université Paul Sabatier, Toulouse, France; 6Nephrology and Transplantation Department, CHU Grenoble, Grenoble, France;
7Nephrology Department, CHU Nancy, Nancy, France; 8Physiology Department, AP-HP, Bichat Hospital, Paris, France; 9Paris Diderot University, Sorbonne Paris Cite, Paris, France;
10Nephrology and Transplantation Department, AP-HP, Saint Louis Hospital, Paris, France;
11Department of Nephrology, Transplantation, Dialysis and Apheresis, Bordeaux University Hospital, Bordeaux, France;
12lmmuno ConcEpT, Centre National de la Recherche Scientifique (CNRS) Unité Mixte de Recherche 5164, Bordeaux University, Bordeaux, France;
13Department of Nephrology and Transplantation, Nouvel Hôpital Civil, Hôpitaux Universitaires de Strasbourg, Strasbourg, France; 14Nephrology Dialysis and Renal Transplantation Department, Centre Hospitalier Régional Universitaire Tours, and EA4245 Cellules Dendritiques, Immunomodulation et Greffes, François Rabelais University, Tours, France; 15Nephrology Dialysis and Renal Transplantation Department, Hopital Nord, CHU de Saint-Etienne, Jean Monnet University, Communauté d'Universités et Etablissements Université de Lyon, Lyon, France; 16Exploration Fonctionnelle Rénale et Métabolique, Hospices Civils de Lyon, Lyon, France;
17UMR 5305 CNRS/Université Claude-Bernard, Lyon I, Biologie Tissulaire et Ingénierie Thérapeutique, Lyon, France; 18Nephrology Department, CHU Clermont-Ferrand, Clermont-Ferrand, France; and
19Department of Nephrology, Dialysis, Transplantation, University of Liège (CHU ULg), Liège, Belgium
Recommendations on the glomerular filtration rate (GFR) threshold compatible with living kidney donation are not agreed upon. The recent KDIGO guidelines suggested a reset of the conventional cutoff value of 80 to 90 mL/min/1.73 m2. While GFR physiologically declines with age, it is unclear whether and how age should be taken into account for selecting acceptable pre-donation GFR. In this multicenter retrospective study encompassing 2007 kidney donors in France, we evaluated the impact of age using two threshold measured GFR (mGFR)s (80 and 90 mL/min/1.73 m2). Three groups of donors were defined according to baseline mGFR: below 80, 80-89.9 and 90 mL/min/1.73 m2 or more. Thirty-two percent of donors were selected despite an mGFR below 90 mL/min/1.73 m2. Donors with the lowest mGFR were significantly older (60 ± 9 vs. 47 ± 11 years) and this applied to both male and female donors. The lifetime-standardized renal reserve, defined as the pre-donation mGFR value divided by the expected number of remaining years of life, was similar irrespective of baseline mGFR groups. Similar results were obtained when eGFR was used instead of mGFR. Finally, in a subgroup of 132 donors with repeated mGFR five years after donation, the magnitude of mGFR decrease was similar in all groups (-34.3%, -33.9%, and -34.9% respectively). Thus, the decision to accept individuals with mGFR lower than 90 mL/min/1.73 m2 for kidney donation is highly dependent on the age of the candidate. Hence, threshold values lower than 90 mL/min/1.73 m2 are reasonable for older donors. Age-calibrated mGFR may improve efficiency of the selection process.
KEYWORDS: age; living kidney donors; measured GFR; threshold
Living kidney donation is the best treatment for end-stage renal disease (ESRD). Compared with deceased donor, kidneys from living donors provide better graft and patient survival.1 From the donor's point of view, living kidney donation has long been considered as having no significant impact on the risk of ESRD or mortality. However, in 2014, 2 independent studies unveiled a slightly increased risk of ESRD and mortality among living kidney donors compared with healthy nondonors.4,5 Even though relative ESRD risk increases after donation (compared with predonation), absolute ESRD risk of living donors, even after donation, remains significantly lower than that of the general population. Nevertheless, in a context of growing concern regarding long-term consequences of living donation, it was proposed to shift the paradigm of living kidney donor screening from a point-by-point analysis of eligibility to an integrated evaluation of ESRD risk.6-8 To date, 3 ESRD risk calculators are available to help clinicians communicate about ESRD risk and potentially guide the decision to accept or decline a potential living donor.6-8 A new screening strategy using ESRD risk calculators was formally accepted in 2017 by the Kidney Disease Improving Global Outcome group (KDIGO) in the new recommendations on living kidney donor screening.6,9
These guidelines recommend a glomerular filtration rate (GFR) of 90 ml/min per 1.73 m2 or greater to routinely accept a living kidney donor, whereas candidates with GFR lower than 60 ml/min per 1.73 m2 should not donate. In between, eligibility should be discussed using ESRD risk estimate, based on the locally defined acceptable ESRD risk threshold.6
This recommended acceptable predonation GFR value differs from previous thresholds found in the literature. 10-16 In 2009 a study supported the use of a GFR threshold of 80 ml/min per 1.73 m2 in living donors.3 In France, a GFR lower than 80 ml/min per 1.73 m2 or lower than 2 SDs for age and sex is a contraindication to donation.17 In 2011 the British Transplantation Society adopted age-dependent GFR thresholds varying from 80 ml/min per 1.73 m2 for young candidates to as low as 50 ml/min per 1.73 m2 for donors older than 80 years.11 This latest approach may seem physiologically sound given, on the one hand, the well-recognized relationship between age and GFR18-26 and, on the other hand, the uncertainty around the real pathogenicity of age-related GFR decline.20,23 To sum up, the recent KDIGO guideline recommends adoption of a new minimal GFR threshold of 90 ml/min per 1.73 m2 for kidney living donation. This threshold, higher than that routinely used in most countries, is not adjusted for age and may result in abusively restricting access to kidney donation for old but otherwise healthy candidates. Additionally, selection of donors with GFR below 90 ml/min per 1.73 m2 may, in clinical practice, already mainly be driven by age and therefore may not confer extra risk of postdonation ESRD.
With those considerations as a backdrop, we assembled a multicenter cohort of French kidney donors and sought to evaluate (i) the impact of different GFR thresholds on the practice of living donation, (ii) the relationship between age and GFR levels deemed acceptable for donation, and (iii) the functional consequences of donation for individuals with GFR below 90 ml/min per 1.73 m2.
RESULTS
Demographic characteristics of donors
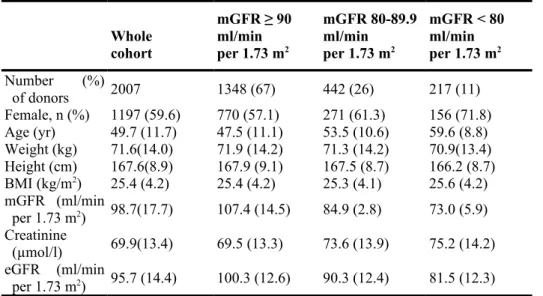
We included 2007 living kidney donors. In our cohort, 67% of donors had a measured GFR (mGFR) higher than 90 ml/min per 1.73 m2, 22% had an mGFR between 80 and 89.9 ml/min per 1.73 m2, and 11% had an mGFR lower than 80 ml/min per 1.73 m2. A majority of donors were female (59.6%). Mean (±SD) age was 49.7 ± 11.7 years, and mean mGFR was 98.7 ± 17.7 ml/min per 1.73 m2. Characteristics of the whole cohort and of donors according to baseline mGFR are presented in Table 1.
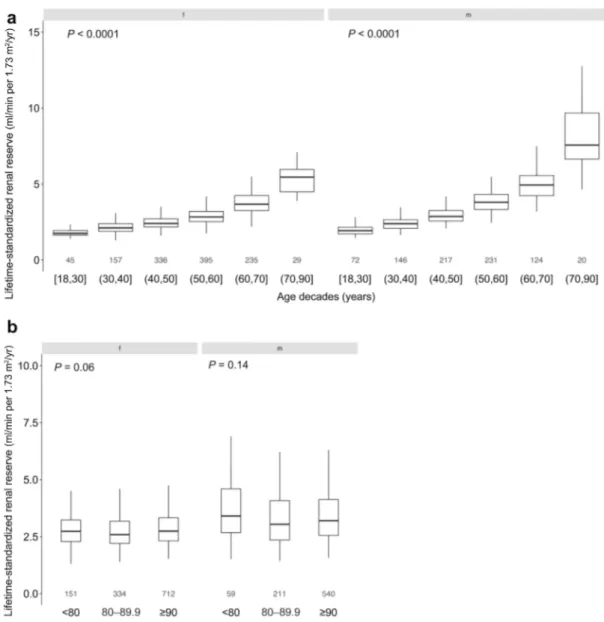
We compared the age of donors according to baseline mGFR and gender. As plotted on Figure 1, age was significantly higher for donors with a lower mGFR both for male and female donors. For donors with an mGFR ≥ 90 ml/min per 1.73 m2, age was 47.5 ± 10.6 years for women and 45.6 ± 11.5 years for men. For donors with an mGFR between 80 and 89.9 ml/min per 1.73 m2, age was 54.1 ± 9.2 years for women and 51.6 ± 12.5 years for men. For donors with an mGFR < 80 ml/min per 1.73 m2, age was 59.9 ± 8.0 years for women and 59.3 ± 10.5 for men. Alternatively, we present donors' age according to baseline eGFR, calculated with the Chronic Kidney Disease Epidemiology equation (CKD-EPI), and gender in Supplementary Figure S1. We observed that 35.4% of donors present an eGFR lower than 90 ml/min per 1.73 m2. For both genders, younger donors presented higher eGFR than older donors.
Lifetime-standardized renal reserve is not different between mGFR groups
In our cohort we observed an inverse relationship between age and mGFR. To further study the link between these two variables, we defined lifetime-standardized renal reserve as the predonation GFR value (either measured or estimated) divided by the number of expected remaining years of life at donation.
First, we compared lifetime-standardized renal reserve using predonation mGFR between different age decade groups at donation for the 2007 donors (Figure 2a). As expected, renal reserve was significantly different between age groups. Renal reserve was significantly higher for older donors, because the number of remaining years of life was lower for those donors. Because we observed that donors with lower mGFR were also older, we wondered whether lifetime-standardized renal reserve was different between baseline mGFR groups.
Table 1 | Baseline characteristics of the donors (n = 2007) Whole cohort mGFR ≥ 90 ml/min per 1.73 m2 mGFR 80-89.9 ml/min per 1.73 m2 mGFR < 80 ml/min per 1.73 m2 Number (%) of donors 2007 1348 (67) 442 (26) 217 (11) Female, n (%) 1197 (59.6) 770 (57.1) 271 (61.3) 156 (71.8) Age (yr) 49.7 (11.7) 47.5 (11.1) 53.5 (10.6) 59.6 (8.8) Weight (kg) 71.6(14.0) 71.9 (14.2) 71.3 (14.2) 70.9(13.4) Height (cm) 167.6(8.9) 167.9 (9.1) 167.5 (8.7) 166.2 (8.7) BMI (kg/m2) 25.4 (4.2) 25.4 (4.2) 25.3 (4.1) 25.6 (4.2) mGFR (ml/min per 1.73 m2) 98.7(17.7) 107.4 (14.5) 84.9 (2.8) 73.0 (5.9) Creatinine (µmol/l) 69.9(13.4) 69.5 (13.3) 73.6 (13.9) 75.2 (14.2) eGFR (ml/min per 1.73 m2) 95.7 (14.4) 100.3 (12.6) 90.3 (12.4) 81.5 (12.3) BMI, body mass index; GFR, glomerular filtration rate; eGFR, estimated GFR; mGFR,
measured GFR.
Data are presented as mean (SD), unless otherwise noted.
As shown in Figure 2b, lifetime-standardized renal reserve was not different between baseline mGFR groups (2.90 ± 0.86, 2.83 ± 0.78, 2.95 ± 0.96, P = 0.06 for female donors with baseline mGFR <80, 80-89.9 and >90 ml/min per 1.73 m2, respectively; 3.91 ± 2.3, 3.64 ± 3.1, 3.47 ± 1.3, P = 0.14 for male donors with baseline mGFR <80, 80-89.9, and >90 ml/min per 1.73 m2, respectively).
Second, we calculated the lifetime-standardized renal reserve at baseline with eGFR instead of mGFR for the 2007 donors (Supplementary Figure S2). We obtained similar results: a higher renal reserve for older donors (Supplementary Figure S2A) and an absence of interaction between lifetime-standardized renal reserve and baseline eGFR values (Supplementary Figure S2B).
One may however argue that, from a physiological standpoint, lifetime-standardized renal reserve could be calculated from the residual eGFR of the remaining kidney after the compensatory phase. To explore this alternative, we have calculated the lifetime-standardized renal reserve from 1-year postdonation eGFR values in a group of 850 donors with 1-year postdonation creatinine available. We report a pattern similar to the one observed with predonation mGFR or eGFR, that is, the absence of interaction between lifetime-standardized renal reserve and baseline GFR values (Supplementary Figure S3).
Of note, our aforementioned observations were verified irrespective of the methods of GFR measurements considered (Supplementary Figure S4).
Figure 1 | Age is different between baseline measured glomerular filtration rate (mGFR) groups.
Boxplot showing age of female (f) and male (m) donors between groups of baseline mGFR. Age is significantly different between groups.
Adaptive response after donation of the remaining kidney is not different between groups of baseline mGFR
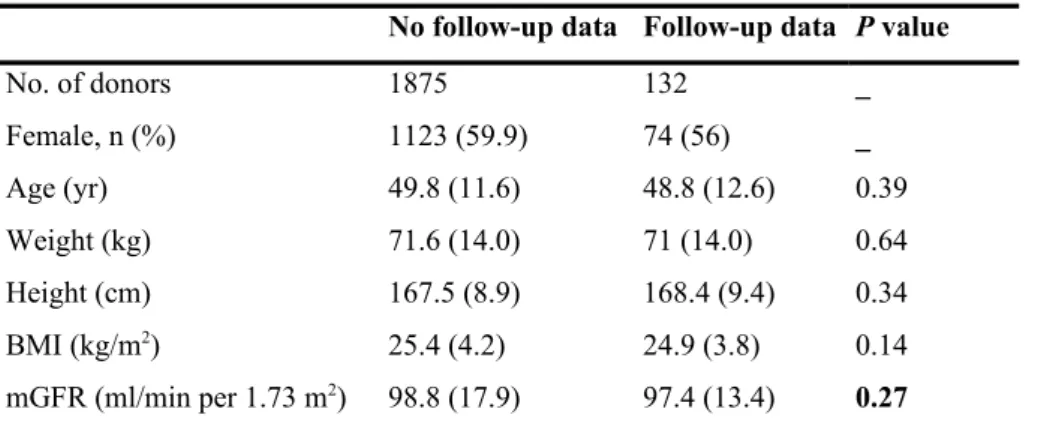
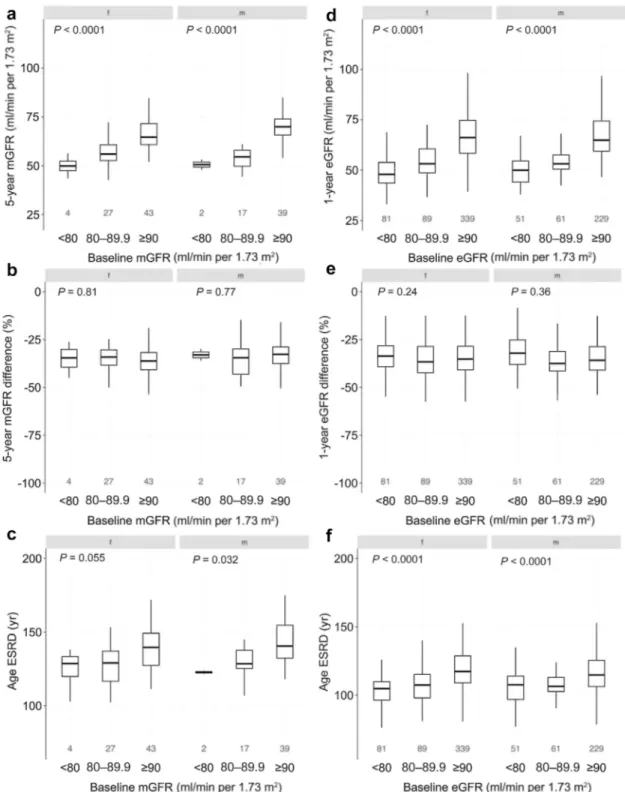
After donation, mGFR of the remaining kidney increases to compensate the loss of the donated kidney. To study whether baseline mGFR had an impact on the kidney function after donation, we compared measured GFR 5 years after donation (mGFR5) in a subgroup of 132 donors (Table 2). The subgroup with mGFR5 was not different from the subgroup of donors without mGFR5. As expected, donors with a higher baseline mGFR had a higher mGFR5 in both sex groups (Figure 3a). For donors with an mGFR ≥ 90 ml/min per 1.73 m2, mGFR5 was 66.8 ± 8.8 ml/min per 1.73 m2 for women and 70.8 ±11.1 for men. For donors with an mGFR between 80 and 89.9 ml/min per 1.73 m2, mGFR5 was 56.5 ± 7.9 ml/min per 1.73 m2 for women and 55.4 ±9.3 for men. For donors with an mGFR < 80 ml/min per 1.73 m2, mGFR5 was 49.9 ±5.3 ml/min per 1.73 m2 for women and 50.6 ± 3.7 for men. Albuminuria to creatinine ratio was not different before and 5 years after donation: 1.1 ± 1.2 versus 1.7 ± 3.8 mg/mmol, P = 0.25. At this time point, no donor had an mGFR lower than 30 ml/min per 1.73 m2. Next, we wondered whether baseline mGFR reflected the ability of the remaining kidney to compensate for the loss of the donated kidney. We compared the relative change of mGFR between donation mGFR and mGFR5. Figure 3b shows that, regardless of sex, the magnitude of mGFR decrease was similar in all groups of baseline mGFR (—34.3% vs. —33.9% vs. —34.9%). This result shows that the relative increase of the remaining kidney mGFR is similar in all groups, regardless of baseline mGFR.
Figure 2 | Lifetime-standardized renal reserve increases with age but is stable across measured glomerular
filtration rate (mGFR) subgroups.
(a) Boxplot of renal reserve for female (f) and male (m) donors, according to age decade subgroups, (b) Boxplot of renal reserve for female
(f) and male (m) donors, according to baseline mGFR subgroups.
We simulated a theoretical age at which donors' mGFR would be as low as 15 ml/min per 1.73 m2. We assumed that 5 years after donation, mGFR of donors would decline annually similarly to the age-related mGFR decline we observed in the whole cohort at baseline. We measured the age-related mGFR decline in the cohort at baseline and applied it to the mGFR5 of donors. In the whole cohort we observed that for each additional year of age, mGFR declines by 0.59 ml/min per 1.73 m2. In Figure 3c we compared the mean theoretical age of ESRD between different baseline mGFR groups. For female donors, mean ESRD theoretical age was higher than 125 years for all groups. For male donors mean ESRD theoretical age was higher than 125 years for donors with a baseline mGFR of 90 and 80-89.9 ml/min per 1.73 m2.
Table 2 | Demographic characteristics of donors with GFR measured 5 years after donation compared with
donors without measured GFR 5 years after donation
No follow-up data Follow-up data P value
No. of donors 1875 132 _ Female, n (%) 1123 (59.9) 74 (56) _ Age (yr) 49.8 (11.6) 48.8 (12.6) 0.39 Weight (kg) 71.6 (14.0) 71 (14.0) 0.64 Height (cm) 167.5 (8.9) 168.4 (9.4) 0.34 BMI (kg/m2) 25.4 (4.2) 24.9 (3.8) 0.14 mGFR (ml/min per 1.73 m2) 98.8 (17.9) 97.4 (13.4) 0.27
BMI, body mass index; mGFR, measured glomerular filtration rate. Data are presented as mean (SD), unless otherwise noted.
For male donors with a baseline mGFR lower than 80 ml/min per 1.73 m2 theoretical age was 123 years. Given the low number of donors for whom we had follow-up mGFR, we then replicated this analysis using the CKD-EPI equation in the subgroup of 850 donors for whom serum creatinine values at 1 year after donation were available. A comparable pattern was observed in this subgroup of donors: a positive relationship between baseline and postdonation eGFR, a similar postdonation drop in eGFR irrespective of baseline eGFR, and a theoretical age of reaching ESRD far beyond the expected life expectancy (Figure 3d-f).
Overall, 38.6% of donors had a 5-year mGFR lower than 60 ml/min per 1.73 m2. Not surprisingly, compared with younger donors, older donors were at increased risk of postdonation mGFR lower than 60 ml/min per 1.73 m2 (Supplementary Table S1).
GFR decline starts at 40 years old
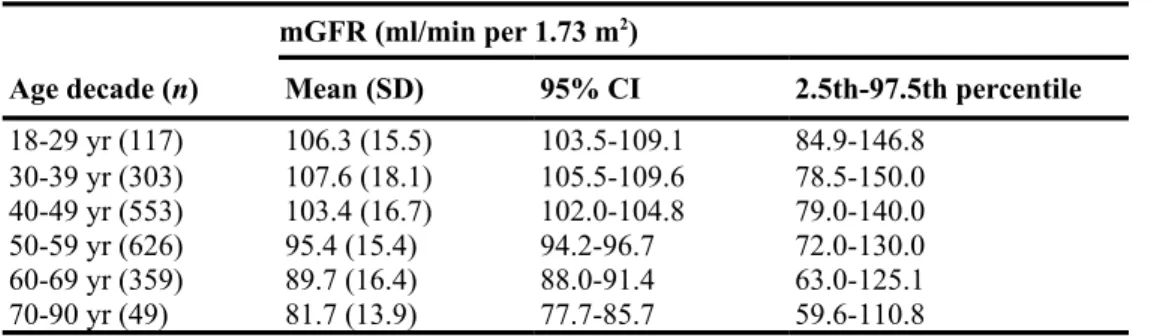
To compare the age-related mGFR decline in our cohort with previously published works, we calculated the 95% confidence interval of mGFR according to decades of age (Table 3). Between 20 and 40 years of age, mGFR did not change significantly. After age 40 years, mGFR declined significantly. To illustrate mGFR decline with age we plotted mGFR against age with the quantile regression lines of 2.5th, 50th and 97.5th percentiles (Supplementary Figure S5).
Figure 3 | Analysis of postdonation glomerular filtration rate (GFR) changes and theoretical age of end-stage
renal disease (ESRD) in subgroups of donors.
(a-c) Subgroup with GFR measured 5 years after donation (n = 132). (a) Boxplots of measured GFR (mGFR) 5 years after donation in each
baseline mGFR group for male (m) and female (f) donors. mGFR5 is significantly different between groups (higher mGFR5 in groups with higher baseline mGFR). (b) Boxplots of the decrease percentage of mGFR, 5 years after donation compared with baseline mGFR. In all groups, mGFR decreased similarly, (c) Boxplots showing the theoretical age at which donors would develop ESRD according to baseline mGFR. (d-f) Subgroup with estimated GFR (eGFR 1) year after donation (n = 850). (d) Boxplots of eGFR 1 year after donation in each baseline eGFR group for male (m) and female (f) donors. eGFR is significantly different between groups (higher 1-year eGFR in group with higher baseline eGFR). (e) Boxplots of the decrease percentage of eGFR, 1 year after donation compared with baseline eGFR. In all groups, eGFR decreased similarly. (f) Boxplots showing the theoretical age at which donors would develop ESRD according to baseline eGFR.
DISCUSSION
Our study can be viewed as a snapshot of French practices on the selection of kidney living donors with a particular focus on predonation mGFR. Our objective was not to address the issue of cardiovascular risk after donation or the controversial question of whether eGFR can replace reference methods for evaluating candidates' GFR, but rather to explore the impact of age on a selection process primarily based on the evaluation of renal function. The first result of our study is that by strictly adopting the newly recommended minimal threshold of 90 ml/min per 1.73 m2, approximately one-third of our donors would have been denied donation. One may argue that the recent KDIGO recommendations are actually more permissive, notably by suggesting adjustment of the final decision according to the global assessment of the candidate's individual risk of developing ESRD. However, this strategy hardly justifies increasing the minimal acceptable threshold, which is, for many countries, set at 80 ml/min per 1.73 m2. As a matter of fact, a GFR value of 80 ml/min per 1.73 m2 is associated with an identical lifetime risk of ESRD as a GFR of 90 ml/min per 1.73 m2. We acknowledge that 90 ml/min per 1.73 m2 is part of the CKD classification and defines stage 1.
Table 3 | Measured GFR in age decade subgroups
mGFR (ml/min per 1.73 m2)
Age decade (n) Mean (SD) 95% CI 2.5th-97.5th percentile
18-29 yr (117) 106.3 (15.5) 103.5-109.1 84.9-146.8 30-39 yr (303) 107.6 (18.1) 105.5-109.6 78.5-150.0 40-49 yr (553) 103.4 (16.7) 102.0-104.8 79.0-140.0 50-59 yr (626) 95.4 (15.4) 94.2-96.7 72.0-130.0 60-69 yr (359) 89.7 (16.4) 88.0-91.4 63.0-125.1 70-90 yr (49) 81.7 (13.9) 77.7-85.7 59.6-110.8 CI, confidence interval; mGFR, measured glomerular filtration rate.
mGFR between age decades differs significantly when 95% Cls do not overlap.
However, we do not see how this consideration could be sufficient in itself to qualify a GFR threshold for donor selection. What really matters in this context is not to determine whether GFR of the donor candidate is greater than or less than a threshold that defines normality at the level of the entire population but rather whether the donor candidate has a GFR value within the range of values observed in similar healthy individuals. In this respect, irrespective of the cutoff GFR value, we believe that it is somewhat artificial and potentially misleading to disconnect the evaluation of predonation renal function from the age of the candidate. The risk of overlooking the common age-related decline in kidney function and of labeling "disease" a physiological process of senescence is real not only in the context of CKD diagnosis but also for selecting living kidney donors. In the same vein, we observed that mGFR was lower than 60 ml/min per 1.73 m2 for 38.6% of donors 5 years after donation. Those donors may be, by definition, considered as suffering from CKD stage 3. Whether they are at higher risk for CKD-related complications is still debated and actually very unlikely.27
Not surprisingly, several national guidelines have recommended calibrating predonation GFR for age. In agreement with the French recommendations, we observe in our cohort that physicians tend to validate donation for older individuals with lower GFR values, even well below 80 ml/min per 1.73 m2.
In this regard, the second key result of our study is that for donors with low predonation GFR (<80 ml/min per 1.73 m2), kidney donations are likely to have acceptable functional consequences, proportionally similar to those seen in younger donors with higher GFR.
Indeed, in our cohort, the lifetime-standardized renal reserve does indeed not vary according to baseline mGFR. We propose this novel metric, which, by combining both predonation GFR and life expectancy, allows comparisons of the available GFR reserve between different age groups. This approach emphasizes that an age-calibrated selection of predonation GFR tends to attenuate differences between older and younger donors. In the same vein, assessing the capacity of the remaining kidney to increase its GFR is important because the magnitude of postdonation decrease in GFR correlates with cardiovascular morbidity and has, for instance, been associated with cardiovascular remodeling and increase in left ventricular mass.28 To what extent donors with lower predonation GFR can counterbalance a 50% loss in renal function is unclear.
baseline mGFR actually does not impact the relative postdonation decrease in GFR, with a reduction of roughly one-third for all baseline GFRs groups.
Finally, the theoretical age of reaching ESRD is another metric that can help to prefigure long-term functional consequences of kidney donation. As expected, we report that donors with the lowest predonation GFR will reach ESRD at a younger theoretical age. However, regardless of the level of predonation GFR, the theoretical age of reaching ESRD for a donor is, in our cohort, always far beyond her/his expected longevity. Overall, this simulation suggests that even for healthy candidates with low—but well age-calibrated—GFR, the postdonation pace of GFR decline is too slow to reach ESRD over a normal human lifetime.
Our study has to be understood with its limitations. First, donors of our cohort may not be perfectly representative of countries other than France, and consequently generalizability of our results may be questioned (e.g., black donors with 2 APOL1 risk alleles who represent a very unique population at a higher risk of renal complication29). In this respect, it would have certainly been informative to provide characteristics of candidates who ultimately were not selected for donation. Those data are, however, usually not recorded by French centers and were not available for our analysis. Consequently, although our study complies with all the items of the Modified STROBE Statement (https://www.strobe-statement.org), item 13 regarding the necessity to report the number of individuals at each stage of the study could not be entirely fulfilled. However, our cohort is similar to many other previously studied cohorts of healthy individuals19,21,22,24,26 regarding the relationship between age and GFR and probably gives a fair illustration of the physiological decline of GFR over time. Second, we were able to study mid-term relationships between baseline GFR and subsequent kidney function only in a very limited number of donors for whom GFR were remeasured at 5 years after donation. Of note, this subgroup of donors shares many characteristics with those of the whole cohort. Third, we defined and used 2 metrics to explore the functional consequences of kidney donation, namely the lifetime-standardized renal reserve and the theoretical age of reaching ESRD. They must be considered as mathematical tools based on different assumptions that may not be verified in real life, particularly the assumption that postdonation GFR decline is systematic and constant. They aim to simulate a situation in which all donors experience ineluctable GFR decline and to determine whether in this scenario, older donors (with lower predonation GFR and shorter life expectancy) would be disadvantaged over younger donors (with higher predonation GFR and longer life expectancy). Those 2 metrics only provide projection, not prediction, based on age-calibrated GFR. Their true association with ESRD has yet to be determined. Importantly, they do not take into consideration interindividual variation in nephron endowment, a characteristic that could be approximated by birth weight.30 Fourth, we aggregated mGFR values obtained from different methods of GFR measurement. Although they are all considered as reference methods, inulin, 51Cr-ethylenediamine tetraacetic acid (51Cr-EDTA), and iohexol measured clearances are not strictly equivalent.31 Importantly, our results are, however, verified in subgroups of donors who have been evaluated by the same technique (Supplementary Figure S4), as well as in the whole cohort when predonation GFR was evaluated by a unique estimator, the CKD-EPI equation (Figure 3; Supplementary Figures S1-S3). Finally, owing to its retrospective nature, we acknowledge that our study is not immune from biases we may have failed to account for. Long-term prospective studies with gold standard techniques have irreplaceable value for exploring the long-term functional consequences of kidney donation.
In conclusion, the new KDIGO guidelines on the evaluation of living kidney donors recommend a new GFR threshold of 90 ml/min per 1.73 m2 to routinely accept donation without explicit consideration of age. Strict adoption of this threshold has little justification and might be too restrictive for a substantial proportion of candidates who are unambiguously eligible for donation according to current standards. Besides the question of the optimal threshold, our data support alternative strategies in which calibration of the GFR to the candidate's age would be the cornerstone of the selection process. An absolute "low" GFR value in a donor candidate can be within the range of physiological normality and should not per se be interpreted as a contraindication to kidney donation.
METHODS Living donors
We conducted a retrospective, multicenter, observational study on living kidney donors, between 2004 and 2017. Eleven transplantation centers participated in the study (Paris-Bichat, Bordeaux, Clermont-Ferrand, Nancy, Grenoble, Lyon, Paris-Necker, Tours, Saint-Etienne, Strasbourg, and Toulouse). Data were recorded anonymously. Potential donors who underwent predonation screening but did not donate were not included in the analysis. For those screened at Necker Hospital, their baseline characteristics are collected and presented in Supplementary Table S2. The flow chart of donors included in the study is presented as Supplementary Figure S6. In a subgroup of donors from Paris-Necker and Strasbourg, GFR was measured 5 years after donation.
Of note, systematic measurement of GFR 5 years after donation is not firmly recommended in France and is only performed as a local practice in Paris-Necker and Strasbourg. We calculated eGFR with the CKD-EPI equation as recommended by the KDIGO.9 Baseline mGFR and baseline age of donors for each center are presented in Supplementary Tables S3 and S4, respectively. According to French law, anonymous retrospective studies do not require institutional review board approval.
GFR measurement
For Paris-Bichat, Paris-Necker, Bordeaux, Grenoble, and Nancy, GFR was measured with 51Cr-EDTA. For Paris-Necker, Paris-Bichat, and Bordeaux, GFR was assessed with the 51Cr-EDTA (GE Healthcare, Little Chalfont, UK) infusion method. For Toulouse, Lyon, Saint Etienne, and Clermont-Ferrand, GFR was measured with inulin clearance. Measurements of plasma and urine polyfructosan concentrations were performed using an enzymatic method. For Lyon, Strasbourg, and Tours, GFR was measured with iohexol. Serum iohexol concentration was measured by high-performance liquid chromatography. The GFR was calculated from plasma clearance with the Bröchner-Mortensen correction. Details for GFR measurement are available in the supplementary materials.
Predonation screening recommendations
Absolute contraindication to donation include (i) hypertension for donors younger than 50 years old, or hypertension requiring more than 2 antihypertensive drugs for older donors; hypertension was defined as systolic blood pressure higher than 140 mm Hg or diastolic blood pressure higher than 90 mm Hg; (ii) presence of diabetes mellitus; and (iii) proteinuria higher than 0.3 g/d.
Statistical analysis
Data processing was done using Excel (2011; Microsoft, Redmond, WA), and statistical analyses were performed using R (R Core Team, 2017; R Foundation for Statistical Computing, Vienna, Austria). Donors were divided in 3 groups according to their baseline mGFR (<80, 80-89.9, and ≥90 ml/min per 1.73 m2). Groups were compared using Kruskal tests. Data are presented as mean and SDs.
To approach the relationship between age and renal function we defined a variable called "lifetime-standardized renal reserve." Lifetime-standardized renal reserve corresponds to GFR (either estimated or measured) divided by the number of expected remaining years of life at donation. Life expectancy values are those of the National Institute for Statistics and Economic Studies, publicly available at www.insee.fr. Life expectancy was calculated for each donor at the date and at the age of donation. Briefly, in 2016 in France, life expectancy for a woman aged 40 years is 86.7 years, that is to say 46.7 years of remaining life to reach life expectancy. If the mGFR of this woman is 100 ml/min per 1.73 m2, then the renal reserve at donation is 100/46.7, that is to say 2.14 ml/min per 1.73 m2 per year of expected life.
To study the ability of the remaining kidney to compensate the lost kidney function after donation we analyzed a subgroup of donors with mGFR5. We compared the characteristics of this subgroup with the group of donors without available mGFR5. We compared absolute values of mGFR5 in each baseline mGFR group. We compared the percentage of lost kidney function in each group as follows: GFR difference (%) = (mGFR5 - mGFR)/mGFR We also compared the relative functional gain of the remaining kidney 5 years after donation between different baseline age decade groups. The relative functional gain is calculated as follows: (mGFR5 — 0.5 × mGFR)/(0.5 × mGFR). This variable represents the percentage of variation of mGFR of the remaining kidney after donation. We calculated a theoretical age of ESRD for donors with a 5-year postdonation measured GFR. Theoretical age of ESRD corresponds to the age at which a donor would reach an mGFR equal to 15 ml/min per 1.73 m2 considering a constant age-related annual GFR decline. This "annual GFR decline" was derived from the mean GFR values observed in our cohort at each age strata and by calculating the corresponding linear regression coefficient (a). We then applied this "annual GFR decline" indifferently to each donor's 5 years' postdonation mGFR, to calculate her/his theoretical age when the threshold of 15 ml/min per 1.73 m2 is reached, as follows:
This "annual GFR decline" is clearly not an estimation but simply a simulation of the actual GFR decline. Because the lifetime standardized renal reserve and the theoretical age for reaching ESRD are both based on the assumption that postdonation GFR decline is systematic and constant, we verified that the GFR slope is constant across age strata (Supplementary Methods, Supplementary Table S5, and Supplementary Figure S7).
Because 3 different methods are used to measure GFR we also calculated the lifetime-standardized renal reserve and theoretical ESRD age using a single estimator (CKD-EPI eGFR) at baseline for the 2007 donors. As for postdonation analyses using eGFR, we studied 850 donors for whom creatinine measurement was available 1 year after donation.
We measured the 95% confidence interval of mGFR according to decades of age. We plotted mGFR against age with the quantile regression lines of 2.5th 50th and 97.5th percentiles.
DISCLOSURE
All the authors declared no competing interests.
ACKNOWLEDGMENTS
The authors thank Catherine Fournier for data collection of Necker donors; Monica Pampillonia La Manna for data collection of Grenoble donors; and all the members of the transplantation commission of the Société Francophone de Néphrologie, Dialyse et Transplantation for data collection. FG thanks Ecole de I'INSERM Liliane Bettencourt for financial support.
SUPPLEMENTARY MATERIAL Modified STROBE Statement. Supplementary Methods.
Figure S1. Age is different between baseline estimated glomerular
filtration rate (eGFR) groups (n = 2007). Boxplot showing age of female (f) and male (m) donors between groups of baseline eGFR calculated with the Chronic Kidney Disease Epidemiology equation. Age is significantly different between groups.
Figure S2. Lifetime-standardized renal reserve increases with age but
is stable across estimated glomerular filtration rate (eGFR) subgroups
(n = 2007). (A) Boxplot of renal reserve for female (f) and male (m)
donors, according to age decade subgroups. (B) Boxplot of renal reserve for female (f) and male (m) donors, according to baseline eGFR subgroups.
Figure S3. Lifetime-standardized renal reserve 1 year after donation
is stable across estimated glomerular filtration rate (eGFR) subgroups
(n= 850). Boxplot of 1-year postdonation renal reserve for female (f)
and male (m) donors, according to baseline eGFR subgroups.
Figure S4. (A) Boxplot showing age of female (f) and male (m) donors
between groups of baseline measured glomerular filtration rate (mGFR) and GFR measurement method. (B) Boxplot of renal reserve for female (f) and male (m) donors, according to baseline mGFR subgroups and GFR measurement method. (C) Boxplot of renal reserve for female (f) and male (m) donors, according to age decade subgroups and GFR measurement method. EDTA, ethylenediamine tetraacetic acid.
Figure S5. Measured glomerular filtration rate (mGFR) physiologically
declines with age. Dotplot showing the relationship between age and mGFR. Solid gray lines represent the 2.5th, 50th, and 97.5th percentile of mGFR for age.
Figure S6. Flow chart of the donors included in the study. Figure S7. Estimated glomerular filtration rate (eGFR) slope after
donation according to age decade at donation. eGFR slope is not different between groups.
Table S1. Adaptation of the remaining kidney for donors with
measured glomerular filtration rate (mGFR) 5 years after donation.
Table S2. Baseline characteristics of potential donors from Necker
Table S3. Baseline measured glomerular filtration rate of donors for
each center.
Table S4. Baseline age of donors for each center.
Table S5. Estimated glomerular filtration rate (eGFR) slope after
donation for 330 donors with eGFR.
Supplementary material is linked to the online version of the paper at
www.kidney-international.org.
REFERENCES
1. Legendre C, Canaud G, Martinez F. Factors influencing long-term outcome after kidney transplantation.
Transpl Int. 2014;27:19-27.
2. Segev DL, Muzaale AD, Caffo BS, et al. Perioperative mortality and long-term survival following live kidney donation. JAMA. 2010;303:959-966.
3. Ibrahim HN, Foley R, Tan L, et al. Long-term consequences of kidney donation. N Engl J Med. 2009;360:459-469.
4. Mjøen G, Hallan S, Hartmann A, et al. Long-term risks for kidney donors. Kidney Int. 2014;86:162-167. 5. Muzaale AD, Massie AB, Wang MC, et al. Risk of end-stage renal disease following live kidney donation.
JAMA. 2014;311:579.
6. Grams ME, Sang Y, Levey AS, et al. Kidney-failure risk projection for the living kidney-donor candidate. N
Engl J Med. 2016;374:411-421.
7. Massie AB, Muzaale AD, Luo X, et al. Quantifying postdonation risk of ESRD in living kidney donors. J
Am Soc Nephrol. 2017;28:2749-2755.
8. Ibrahim HN, Foley RN, Reule SA, et al. Renal function profile in white kidney donors: the first 4 decades. J
Am Soc Nephrol. 2016;27:2885-2893.
9. Lentine KL, Kasiske BL, Levey AS, et al. KDIGO clinical practice guideline on the evaluation and care of living kidney donors. Transplantation. 2017;101 (8 suppl 1):S7.
10. Mandelbrot DA, Pavlakis M. Living donor practices in the United States. Adv Chronic Kidney Dis. 2012;19:212-219.
11. British Transplantation Society. United Kingdom guidelines for living donor kidney transplantation, 3rd ed [updated 2011 May]. Available at: https://bts.org.uk/wp-content/uploads/2016/09/19_BTS_RA_Living_
Donor_Kidney-1.pdf. Accessed April 26, 2018.
12. Organ Procurement and Transplantation Network. Organ Procurement and Transplantation Network policies. Policy 14: living donation. Available at: https://0ptn.transplant.hrsa.g0v/media/l 200/optn_policies. pdf#nameddest=Policy_14. Accessed February 7, 2014.
13. Cohney S, Kanellis J, Howell M, CARI. The CARI guidelines. Donor renal function. Nephrol Carlton Vic. 2010;15(suppl 1):S137-S145.
14. Gentil Govantes MA, Pereira Palomo P. [Assessment and selection of kidney living donors]. Nefrol. 2010;30(suppl 2):47-59.
15. Abramowicz D, Cochat P, Claas FHJ, et al. European Renal Best Practice Guideline on kidney donor and recipient evaluation and perioperative care. Nephrol Dial Transplant. 2015;30:1790-1797.
16. Delmonico F, Council of the Transplantation Society. A report of the Amsterdam Forum on the Care of the Live Kidney Donor: data and medical guidelines. Transplantation. 2005,79(6 suppl):S53-S66.
17. Thuong M. Kidney removal and transplant from a living donor. Formal recommendations from the experts.
Nephrol Ther. 2010;6:138-144.
18. Poggio ED, Rule AD, Tanchanco R, et al. Demographic and clinical characteristics associated with glomerular filtration rates in living kidney donors. Kidney Int. 2009;75:1079-1087.
19. Back SE, Ljungberg B, Nilsson-Ehle I, et al. Age dependence of renal function: clearance of iohexol and p-amino hippurate in healthy males. Scand J Clin Lab Invest. 1989;49:641-646.
20. Delanaye P, Schaeffner E, Ebert N, et al. Normal reference values for glomerular filtration rate: what do we really know? Nephrol Dial Transplant. 2012;27:2664-2672.
21. Davies DF, Shock NW. Age changes in glomerular filtration rate, effective renal plasma flow, and tubular excretory capacity in adult males. J Clin Invest. 1950;29:496-507.
22. Hoang K, Tan JC, Derby G, et al. Determinants of glomerular hypofiltration in aging humans. Kidney Int. 2003;64:1417-1424.
23. Denic A, Mathew J, Lerman LO, et al. Single-nephron glomerular filtration rate in healthy adults. N Engl J
Med. 2017;376:2349-2357.
24. Grewal GS, Blake GM. Reference data for 51Cr-EDTA measurements of the glomerular filtration rate derived from live kidney donors. Nucl Med Commun. 2005;26:61-65.
25. Granerus G, Aurell M. Reference values for 51Cr-EDTA clearance as a measure of glomerular filtration rate. Scand J Clin Lab Invest. 1981;41: 611-616.
26. Pottel H, Delanaye P, Weekers L, et al. Age-dependent reference intervals for estimated and measured glomerular filtration rate. Clin Kidney J. 2017;10:545-551.
27. Glassock R, Delanaye P, El Nahas M. An age-calibrated classification of chronic kidney disease. JAMA. 2015;314:559-560.
28. Moody WE, Ferro CJ, Edwards NC, et al. Cardiovascular effects of unilateral nephrectomy in living kidney donors. Hypertension. 2016;67: 368-377.
29. Doshi MD, Ortigosa-Goggins M, Garg AX, et al. APOL1 genotype and renal function of black living donors. J Am Soc Nephrol. 2018;29: 1309-1316.
30. Brenner BM, Chertow GM. Congenital oligonephropathy and the etiology of adult hypertension and progressive renal injury. Am J Kidney Dis. 1994;23:171-175.