Demographic change and the
drivers of future migration into
Europe. Approach, methodology
and work plan of the JRC/IIASA
Centre of Expertise on
Population and Migration
Lutz, W. & Belanger, A.
IIASA Report
March 2017
Lutz W & Belanger A (2017). Demographic change and the drivers of future migration into Europe. Approach, methodology and work plan of the JRC/IIASA Centre of Expertise on Population and Migration. IIASA Report. Laxenburg, Austria: IIASA Copyright © March 2017 by the author(s). http://pure.iiasa.ac.at/14535/ All rights reserved. Permission to make digital or hard copies of all or part of this work for personal or classroom use is granted without fee provided that copies are not made or distributed for profit or commercial advantage. All copies must bear this notice and the full citation on the first page. For other purposes, to republish, to post on servers or to redistribute to lists, permission must be sought by contacting [email protected]
De ographic cha ge a d the drivers
of future igratio i to Europe
App oa h, Methodolog a d Wo k Pla of the JRC/IIA“A Ce t e
of E pe tise o Populatio a d Mig atio
Wolfgang Lutz and Alain Belanger
(with input by Daniela Ghio, Elke Loichinger, Guillaume Marois, Raya Muttarak, Fabrizio
Natale, Patrick Sabourin, Patrick Sakdapolrak, and Nikolaos Stilianakis)
List of content:
1. Background on JRC and IIASA work ... 1 2. Pull factors ... 2
2.1 Population scenarios (macro-simulation) for the EU member states by age, sex,
level of education and labor force participation to 2060 ... 2 2.2 Microsimulation models based on the EU-LFS for projections of further relevant population
characteristics ... 9
3. Push factors ... 13
3.1 Human Capital projections to 2060 for all African and West-Asian countries
following the SSP narratives ... 13 3.2 Examining how climate change influences drivers of migration ... 20
4. Combining all factors in the definition of alternative migration scenarios to Europe
(including possible policy responses) ... 25 5. Work Plan ... 26
Demographic change and the drivers of future migration
into Europe
App oa h, Methodolog a d Wo k Pla of the JRC/IIA“A Ce t e of
E pe tise o Populatio a d Mig atio
Wolfgang Lutz and Alain Belanger
(with input by Daniela Ghio, Elke Loichinger, Guillaume Marois, Raya Muttarak, Fabrizio Natale, Patrick Sabourin, Patrick Sakdapolrak, and Nikolaos Stilianakis)
Disclaimer
This document reports on the work of the International Institute for Applied Systems Analysis and has received only limited review. Views or opinions expressed herein do not necessarily represent those of the institute, its National Member Organizations, or other organizations supporting the work.
Abstract
This document describes the research approach, methodology and work plan of the Centre of Expertise on Population and Migration that was established in 2016 as a collaboration been IIASA (International Institute for Applied Systems Analysis) and JRC (Joint Research Centre of the European Commission). This collaboration is scheduled for three years and each side provides the funding of five post-doctoral researchers.
Team members will be jointly supervised and be stationed in Ispra and at IIASA with strong interactions. The new Centre will take a multi-dimensional demographic approach to assess the consequences of alternative future population and migration trends in Europe as well as in the main regions of origin for migration into Europe. The Centre will study push and pull factors, different kinds of migration streams as well as the impact of migration flows for Europe in terms of population aging and the p odu ti it of Eu ope’s labor force over the coming decades. This will be done in terms of macro-level modelling including population scenarios by age, sex, level of education and labor force participation for all EU member states as well as micro-simulation models with more characteristics in order to study the integration of migrants. Scenarios by age, sex and level of education will also be done for potential sending countries in Africa, Asia and Eastern Europe and combined with aspects of socio-economic and environmental change following the narratives of the SSPs (Shared Socio-economic Pathways) to assess possible future push factors. Special attention is given to the possible impacts of climate change on migration.
The main output documents will be a set of updated population scenarios by age, sex and level of education follo i g the app oa h of the OUP olu e Wo ld Populatio a d u a Capital i the stCe tu
(Lutz et al. 2014) to be produced by the end of 2017 and a scientific book with the main conclusion concerning alternative migration and integration scenarios to be finalized in late 2018 to serve as input for the policy planning of the new incoming European Commission. In addition the publication of a number of peer-reviewed scientific journal articles is foreseen.
1.
Background
During the first half of 2016 the Joint Research Centre (JRC) of the European Commission and the International Institute for Applied Systems Analysis (IIASA) agreed to form a partnership for the establishment of a joint "Centre of Expertise on Population and Migration". On 20 June, policymakers, analysts, and researchers from around Europe came together in Brussels to launch the new Centre of Expertise on Population and Migration, a joint institution between IIASA and the European Commission Joint Research Centre (JRC). The event was ope ed Chai : Vladi í Šu ha, Di e to -General, Directorate-General Joint Research Centre, European Commission; Kristalina Georgieva, Vice-President of the European Commission, Budget and Human Resources, European Commission; Christos Stylianides, Commissioner for Humanitarian Aid and Crisis Management, European Commission; Tibor Navracsics, Commissioner for Education, Culture, Youth and Sport, European Commission; Peter Diez, Deputy Director Migration Policy, Ministry of Security and Justice , The Netherlands. A keynote speech was delivered by Demetrios G. Papademetriou, President of the Migration Policy Institute (MPI) Europe, and substantive introductions to the work of the Centre of Expertise were done by Delilah Al Khudhairy (JRC), Mariana Kotzeva (Eurostat) and Wolfgang Lutz and Anne Goujon (both IIASA).
The new Centre was tasked to provide multi-dimensional assessments of future population trends in Europe as well as in the main regions of origin for migration into Europe. The Centre will study push and pull factors, different kinds of migration streams as well as the impact of migration flows for Europe in terms of population agi g a d the p odu ti it of Eu ope’s labor force over the coming decades.
This collaborative effort has been designed to fill a research gap because existing research in the EU is insufficient to assess the longer term implications of migration- and population- related challenges
o p ehe si el . The Agei g Repo t of the European Commission provides an assessment of the economic and budgetary challenges associated with demographic change in the 28 member States of the EU up to 2060 (European Commission 2015). Those projections, however, are only based on one scenario assuming relatively moderate migration into Europe. In addition, Eurostat produces regularly national level population projections for all EU member States by age and sex and in irregular intervals regional projections at the NUTS2 level. However, forecasts by level of education and labor force participation or projections for possible countries of origin of migrants are not available. There is also a gap in studying alternative migration policy scenarios differentiated by education levels of migrants or countries of origin.
Outside Europe, the US Census Bureau produces population projections for all countries in the world in the form of a single scenario by age and sex without alternative migration assumptions. The UN Population Division produces probabilistic population projections for all countries in the world by age and sex up to 2100.
It also publishes high and low fertility scenarios, but no scenarios based on alternative migration assumptions. The Wittgenstein Centre for Demography and Global Human Capital (a collaboration of IIASA, ÖAW and WU) has recently produced a set of global population scenarios to 2100 by age, sex and level of education for all countries in the world. These scenarios follow the narratives of the SSPs (Shared Socioeconomic Pathways) which have been defined by a consortium of global environmental change research groups.
This methodological document is divided into four additional sections. The next section presents both the macro and micro models of population projections that will be created in the next three years of the research project. The following section summarizes knowledges developed at IIASA and elsewhere regarding the push factors that drive population migration in the global context and defines how changes will be made to existing models to address the potential impact of changes in narratives more specific to African and West-Asian countries. The fourth section briefly illustrates how all these new findings to be generated can be integrated to help develop new alternative migration scenarios for Europe in the context of population ageing. Finally, the last section presents the milestones and time schedule of the main tasks to be accomplished during the next three years.
2.
Pull factors: Study of demographic trends in the EU
2.1 Population scenarios (macro-simulation) for the EU member states by age, sex,
level of education and labor force participation to 2060
The definition of demography applied in this project will not only include age and sex structures of populations but also their changing compositions by level of education, labor force participation, and other dimensions, as appropriate. In order to embed the population outlook into the context of political, social and economic development, it will also incorporate such changes in potential regions of origin as a driver of future migration. For the EU member states the medium (most likely) scenario will be identical, in terms of population size and age structure, to that produced by Eurostat during the first quarter of 2017. This will assure full consistency of
the projected age and sex structure resulting from this project with the population projections used in other parts of the European Commission and, in particular, by the Working Group on Ageing. But the projections to be produced here will go in several ways beyond what Eurostat or national statistical offices routinely produce: There will be a multitude of different scenarios based on alternative assumptions on future migration, fertility, mortality, and education and the projected populations will be stratified by more characteristics than the conventional age and sex only. In the first part, applying macro-simulations – which are a multi-dimensional generalization of the conventional cohort component model – the population will be also stratified by level of highest educational attainment with different age- and sex-specific fertility, mortality and migration rates for people with different levels of educational attainment. Still in the context of macro-si ulatio ’s, these 3-D (by age, sex and level of education) scenarios will be expanded into 4-D scenarios by superimposing matrices of age-, sex- and education-specific labor force participation rates. This 4th dimension, however, will only be
added in the form of applying a prevalence matrix (Sullivan method) and not assume differential demographic rates by labor force participation status because of strong interactions between fertility, health, and labor force participation. In a second part, that will be described in the following section, tools of microsimulation will be used to dynamically project the population by a larger number of further characteristics that are considered relevant.
Because this approach of multi-dimensional population modelling is not yet widely known and applied, we will start with some more general considerations about the advantages of applying this model1.
Focus on human capital: The rationale of population projections by age, sex and level of education
In general, human beings have many observable and measurable characteristics that distinguish one individual from another as well as one sub-group of a population from another. In demography the sex/gender of a person is considered a most fundamental characteristic because it is essential for studying the process of reproduction. Other demographic processes such as mortality and migration also show significant variation by sex/gender. Age is another key characteristic of people because it is the main driver of biological maturation in early ages and matters for social institutions such as school attendance, labor force entry and retirement. There are also distinct variations in fertility, mortality and migration intensities with age.
But individuals differ in many other measurable characteristics than age and sex. Various biological, social and economic characteristics such as urban/rural place of residence, marital status, educational attainment level, race, migration status, employment status, income group, and health/disability status are measurable characteristics of people that demographers have taken into account. It has been argued that among these, educational attainment level is the single most important source of observable population heterogeneity that should be routinely added to population analyzes based on three criteria (Wolfgang Lutz et al. 1998; Wolfgang Lutz 2010), 2): (a) its explicit consideration is feasible in terms of available data and methodology; (b) it matters significantly in terms of altering population dynamics; and (c) it is of interest in its own right in terms of its social and economic implications. The following sections will address these criteria separately.
Such integration of education can also be i te p eted as addi g a ualit di e sio to the o side atio of population numbers.
Human capital is usually defined to encompass both the education and health of people. While health is an important prerequisite for effectively attending school at young age and matters for economic productivity at adult age, here we will focus primarily on education because it can be measured more consistently across countries and because an exciting new field of analysis has recently opened in the field of demographic education modelling.
When measuring education, it is important to conceptually distinguish between education flows and stocks. The flows refer to the process of education, to schooling, or more generally the production of human capital which may consist of formal and informal education. This process of education is the central focus of pedagogics and education science where the usual statistical indicators are school enrolment rates, student-teacher ratios, drop-out rates and repetition rates. Human capital refers to the stock of educated adult people which is the result of past education flows for younger adults in the more recent past and for older ones quite some decades ago. This stock is usually measured in terms of the quantity of formal education (highest level of attainment or mean years of schooling) but the quality dimension (the skills people actually have) and content or direction of education also matter. Content matters more for higher education than for basic education where the main aim is the acquisition of literacy skills and basic numeracy. The quantity of formal education is often measured by the mean years of schooling of the adult population above either the age of 15 or 25. This has the advantage of capturing the entire human capital of a population at one point in time in one single number (or two when one distinguishes between men and women). But there is much to be gained from decomposing this highly aggregate indicator into the full distribution of educational attainment categories (and capturing the inequality in education) and into different age groups and hence capturing inter-cohort changes that drive many of the consequences of improving human capital on society and economy.
Consistent time series data on educational attainment that are comparable across a large number of countries are difficult to obtain. Theoretically, the data by age, sex and level of education should be available from the censuses and many representative surveys. In practice, these data are almost impossible to compare across
ou t ies a d o e ti e e ause of diffe i g defi itio s of edu atio atego ies despite UNE“CO’s sig ifi a t efforts to standardize classifications in the form of the ISCED categories. This has led several groups of scientists, who needed consistent times series of human capital data for the analysis of the returns to
education to try to estimate the information indirectly (Barro and Lee 2001; Benhabib and Spiegel 1994; Cohen and Soto 2007; de la Fuente and Doménech 2006; Wolfgang Lutz et al. 2007). In most cases this was done by combining information from times series of school enrolment rates with the existing fragmentary information on attainment while at the same time trying to iron out national peculiarities. Demographic multi-state models offer an alternative approach which can deal with age and sex-specific reconstructions and projections of human capital in a unified framework that also considers educational mortality and fertility differentials. The methods of multi-state population dynamics are a generalization of the conventional cohort-component method of population projection which only stratifies populations by age and sex. In the multi-state model (the approach is also known under the name of multi-dimensional mathematical demography) additional dimensions are being added that sub-divide the population into different states which all have their specific fertility, mortality and migration patterns. The methodology was developed during the 1970s in and around IIASA (Keyfitz 1985; Land and Rogers 1982) originating from a geographic perspective in which the states were defined to be regions of a country with the populations interacting through internal migration. Later this concept was generalized and states were defined to mean marital statuses as well as health states (such as disabled and non-disabled) (Manton et al. 1997; Rogers and Belanger 1989) or different types of households (Yi et al. 1998).
Multi-state methods are particularly appropriate for modelling changes in educational attainment. The model is simplified by the fact that transitions from one state to another only go in one direction (people only move up to higher attainment categories) and are concentrated at younger ages. Furthermore, fertility and mortality levels tend to vary greatly and systematically by level of education and hence the explicit consideration makes a crucial difference (discussed below).
In applying these methods for projecting backward (reconstruction) or forward into the future one has to have at least one data point for which the size and structure of the population by age, sex and level of educational attainment is available empirically. The empirical data set for each country used here (KC et al. 2010; Wolfgang Lutz et al. 2007) refers to dates around the year 2000. Given this information the basic idea of projecting is straightforward: Assuming that the educational attainment of a person remains invariant after a certain age, one can derive, e.g., the proportion of women without any formal education aged 50-54 in 2005 directly from the proportion of women without any formal education aged 45-49 in 2000 and vice versa considering the education specific mortality and migration rates between those ages. One has to make further adjustments for the fact that higher education levels can still change after age 15 and fertility, mortality and migration vary by level of education.
Figure 1. Population of Croatia by age and sex and education level for 1970, 1990, 2010 and projected for 2030.
Figure 1 illustrates this dynamic with the example of Croatia, the EUs youngest member, for the period 1970 to 2030. Red shows the number of men and women without any formal education. They are still very numerous among the elderly female population in 1970. Orange indicates persons with some primary education, light blue completed junior secondary and dark blue completed tertiary education. The figure also shows that today the younger cohorts are much better educated than the older ones. Reconstructing the education structure for the year 1970 follows the above-described procedure along cohort lines: those aged 50-54 in 2000 were aged 20-24 in 1970. The same procedure is applied for forecasting where the cohort aged 20-24 in 2010 will be aged 40-44 in 2030 and will essentially maintain its proportions with primary and secondary education. Only the tertiary category may still be joined by some after the age of 20-24. This figure also illustrates that much of the future improvement in the educational attainment of the adult populatio is al ead e edded i toda ’s education structure. Future changes in school enrolment rates will only make a difference for younger cohorts.
This three dimensional population model by age, sex and level of education will be calculated for all countries of the world. Almost universally, the children of more educated women have lower mortality rates. A great deal of research has focused on substantiating the independent and causal relationship between maternal schooling and child health (Caldwell 1979; Fuchs et al. 2010). Reviews of surveys and census data from developing countries (Hobcraft et al. 1984; Mensch et al. 1985) and econometric analyzes of cross-country macro-data o fi ed o e ’s edu atio as the ost sig ifi a t dete i a t of hild o talit , he e estimates show that each additional year of schooling is associated with a 5%-7% reduction in child death (Mensch et al. 1985; Schultz 1993).
A systematic assessment for a large number of developing countries (using recent DHS micro level data) finds that, almost universally, othe s’ edu atio is o e i po ta t fo hild su i al tha household i o e a d wealth. This finding has significant implications for setting policy priorities because it makes a big difference
hethe e phasis is put p i a il o gi l’s edu atio o household i o e ge e atio .
In terms of fertility – measured as the number of live births per woman – the educational differentials are equality pervasive. While fertility rates have seen significant declines in most of Asia and Latin America, in Sub-Saharan Africa they are still at an average of five children per woman with some individual countries such as Niger as high as seven children. In virtually every developing society more educated women have lower fertility than less educated ones. A rather extreme case is Ethiopia, where according to the DHS uneducated women have on average more than six children, while those with secondary education have two children on average. More educated women have lower desired family sizes because they face higher opportunity costs a d te d to put o e e phasis o the ualit of hild e (Becker 1991). The empirical data show that better educated women consistently want fewer children, have greater autonomy in reproductive decision-making, more knowledge about and access to contraception and use it more effectively, and are more motivated to use contraception because of higher opportunity costs of unintended childbearing (Bongaarts 2010; Cleland and Rodriguez 1988).
Education matters greatly for almost every aspect of progress in human development. The empowering function of education is considered a major goal in its own right. The Human Development Index, one of the most widely used indicators of desirable social and economic progress, consists of three components, one measuring progress in education itself and the two others capturing progress in health and material wellbeing. There is reason to assume that these latter two aspects are to some extent driven by progress in the education of the population and that indeed human capital may be viewed as the root cause of human development (Wolfgang Lutz 2009a). The human capital data that are differentiated by age and sex helped to shed some light on this assertion.
In economics it has been assumed for a long time that education has an important positive effect not only on individual earnings but also on aggregate-level economic growth. While the empirical evidence is unambiguous for individual-level earnings, the statistical evidence for economic growth has been rather weak until recently. The reasons for this unsatisfactory situation can be found in the lack of precision of the education data used and more specifically in the lack of explicitly considering the age structure of human capital (Benhabib and Spiegel 1994; Cohen and Soto 2007; de la Fuente and Doménech 2006; W. Lutz et al. 2008). As can be seen from the example of Croatia in Figure 1, the most frequently used indicator of human capital in economic growth regressions – the mean years of schooling of the entire adult population above the age of 25 – averages over age cohorts with very different levels of education, including the highly educated young cohorts as well as the poorly educated older ones. In recent analyzes that explicitly consider the age structure of human capital, it could be shown that economic growth is fastest when the better educated young cohorts enter young adulthood. This pattern is most clearly visible for the Asian tiger states where the inter-cohort improvements in education were dramatic. At the global level, the age-specific human capital indicators statistically confirm the key role of human capital for economic growth unambiguously2.
2 (W. Lutz et al. 2008)
Education is also one of the most important determinants of adult health and mortality. Large numbers of studies have established significant education gradients in mortality in different parts of the world despite marked contextual differences (KC and Lentzner 2010; Mackenbach et al. 1999). Even more dramatic are the education differentials with respect to disability at older ages. A recent global level study on the basis of the World Health Survey found that almost universally, more educated men and women at a given age have a much lower level of self-reported disability (ADL – limitations in activities of daily living) than the less educated (KC and Lentzner 2010). Viewing this fact together with the above-described education projections entirely changes our outlook on the prevalence of disability in the future. If the focus is only on age and sex, then the observed pattern of increased disability at higher ages, together with the projection that there will be more elderly in the future, results in quite dramatic forecasts of future numbers of persons with severe disabilities. If education is also factored in, the picture looks less dramatic. In most countries of the world the elderly of the future will be better educated than the elderly of today. Assuming that the more educated at any age have significantly lower disability rates, this improving education factor may partly or even fully compensate for the aging factor (KC and Lentzner 2010; Wolfgang Lutz 2009b). But since there are still many unknowns, these interactions between education and health are an important field for more research.
Education matters significantly for many further issues than disability, longevity and economic wellbeing. At the individual level more educated people are doing better along almost any dimension ranging from mental health to the ability to recover from shock to lower unemployment. At the aggregate level systems of
go e a e a d de o a ha e ee sho to e losel elated to a so iet ’s level of education. It has been shown that the age structure of human capital and in particular the time when large cohorts of better
educated men and women enter the young adult ages play a key role in the transitions of societies into modern democracies (Wolfgang Lutz et al. 2010). Large cohorts of young adults (someti es alled the outh ulge who are also better educated but cannot match their higher aspirations with the realities under an oppressive regime, present a major force towards change or migration out from the country. This picture fits well to the recent events in the Arab world.
Methods and Data for the macro-level projections
Over the past decades, IIASA has developed a methodology to project multi-dimensional population dynamics. By multi-dimensional we mean population projections that go beyond age and sex, the two dimensions of population projections realized using the traditional cohort-component approach. IIASA has since published several sets of scenarios projecting the population for all countries in the world to 2100 by age, sex and education (3D model). The latest round of projections produced by IIASA following this methodology project the population by age and sex and six education categories for 195 countries of the world. (Wolfgang Lutz et al. 2014).
As described above, there are at least two important reasons to use this multi-dimensional methodology rather than the traditional cohort-component method which stratifies populations only by age and sex. First, adding additional dimensions such as education should improve the accuracy of the demographic projections since education is perhaps the most important determinant of the components of population changes: fertility, mortality and migration. A projection that takes into account the differentials in fertility, mortality and migration is likely to better project the future number of births, deaths or migrants since it will explicitly account for the change in the population composition by education level. The other main reasons to use multi-dimensional projections is that adding the education dimension to population projections provides much more useful results to guide future policies because education is a main determinant to many socio-economic behaviors. Thus, the composition of the population by education level will also affect the global labor force participation rate or the productivity of the labor force and, ultimately, the economic growth rate. More recently, the methodology was expanded by Loichinger (Loichinger 2015) to add a fourth dimension, the labor force participation by age, sex and education.
While for the rest of the world this project with carry out population scenarios by age, sex, and level of education following the SSP narratives (see description in section 3 below) for the EU member states labor force participation will be added as a fourth dimension on the macro level. The base line data for all 28 EU
e e s’ states will come from Eurostat and the European Labor Force Surveys (LFS).
Adding labor force participation to the age, sex and education projections is realized in two additional sub-steps. The first sub-step necessitates the projection for each country of the future participation rates by age, sex and education level. Multiplying the projected labor force participation rates by age, sex and education level to the corresponding projected population will yield the projected labor force projection. This is a procedure called derived projections. Using this methodology, labor force status cannot be used as a determinant of the demographic components of population changes.
The difficulty here is to make plausible assumptions on the future trends in labor force participation rates. This will be achieved through an analysis of past trends in age, sex and education specific trends to support assumptions on future evolution of the rates. The data on past labor force participation trends will be extracted from cross-sectional files of the European labor force survey (EU-LFS). This survey provides
comparable information across time and space since the concepts, definitions and classifications employed are harmonized by Eurostat. The education variable will be the highest education level completed (HATLEVID) which is available in the data set since 1992. For each country, past participation rates by age, sex and education level will be computed by dividing the active population (employed and unemployed) by the total population. The youngest age group will be 15-19 and the open age group will be 65+.
Then, scenarios will be built by making assumption on future trends. It is planned to have at least three scenarios. The first one, the constant scenario, will be based on the most recent observations (2014) and will maintain constant these observed rates during the entire projection period. The second one, the recent trend scenario, will be based on an extrapolation of the recent observed changes in participation rates by age, sex and education. This scenario will thus take into account the increasing participation rates of younger female cohorts compared to older ones observed in many European countries resulting from greater gender equality. It can also take into account the changes in the age at retirement observed in some countries or delayed entry into the labor force. It is important to carefully select the observation period to take into account specific period effect due to the cyclical nature of the economy. The third scenario will model the participation rates towards a given distribution. Called the benchmark scenario, it will assume that all countries age, sex and participation rates will converge towards the 2014 observed rates in the more advanced economy. As stated by Loichinger (2015) , this benchmark scenario illustrates what can be achieved in other countries in case they follow this example.
Based on the alternative population scenarios by age, sex and level of education that were recently produced by the Wittgenstein Centre for Demography and Global Human Capital (a collaboration of IIASA, VID/ÖAW and WU), a set of 4-dimensional projections was produced for all EU countries that added labor force participation by age, sex and education as an additional dimension. These calculations, however, did not yet consider alternative migration scenarios but only focused on changes in the economic dependency ratio (the proportion of non-working people to people in the labor force), as a consequence of three different scenarios of future labor force participation: 1. keeping the current pattern of age-specific participation rates constant (constant scenario), 2. accounting for the fact that young cohorts (in particular women) work in higher proportions than older ones and likely will continue to do so when they become older (cohort scenario) and 3. under the assumption that the pattern in all European countries over the next two decades moves to that currently observed in Sweden (benchmark scenario).
The dotted lines in the below figure give the scenarios that are only based on the age- and sex-specific labor force participation rates. The solid lines show those that, in addition, consider the education structure. Since more educated women (and to a lesser extent also men) have higher labor force participation rates and also tend to retire significantly later and in all European countries the younger cohorts are better educated than the older ones, this will result in higher labor force participation, as the better educated cohorts move up the age p a id a p o ess alled de og aphi eta olis . These scenarios only assume modest future migration into Europe.
The project will enrich this sort of analysis through a number of different migration scenarios varying the volume, education level and labor force participation rates of migrants at their time of arrival. In other words, migrants will be allocated to the states of in the labor force or not in the labor force at the time of their arrival since migrant status in not a separate dimension in this four-dimensional macro analysis. In the micro-simulation allowing for much higher dimensionality not only migrant status but also duration of stay in the country will be explicitly considered variables linked to labor force participation.
Figure 2: Trend in the economic dependency ratio in the EU27 according to different scenarios of future age-, sex- and education-specific labor force participation rates. Source: Loichinger 2015
2.2 Microsimulation models based on the EU-LFS for projections of further relevant
population characteristics
Macro level population projection models based on multistate methodology will be used in a different phase of the project to forecast the EU-28 population by age, sex, education level and labor force participation. Multistate projections have been extensively used in the past by national statistics agency and Eurostat alike to forecast population by age, sex and some other dimensions. In addition, the CEPAM is aiming to investigate the impact of other dimensions, such as immigrant status, duration of residence in the host country, country of birth, language or religion. These additional dimensions prove to be important as immigration streams impact populations demographically, socio-economically, spatially, and culturally. Furthermore, demographic behaviors and socio-economic outcomes of immigrants differ from natives and in a context where the
immigrant population is growing fast, it becomes more and more important to account for these differentials. The objective here is, thus, to project as many characteristics of the population as possible, so as to generate relevant results guiding policy makers in their decisions with respect to immigration policy, social cohesion, labor market needs and changes, poverty and inequalities, as well as education and language skills formation needs.The simultaneous projection of several dimensions in a multistate model, however, entails technical challenges that prove difficult to overcome as the model state-space (matrix size) grows exponentially to include all possible combinations of attribute values. We have, thus, to change the methodological paradigm from multistate to microsimulation.
Microsimulation is a powerful tool that can be used to make population projections when the number of dimensions becomes large. There is also an emerging consensus about the usefulness of this type of models for population projections in general. We therefore propose to develop a new European microsimulation model to project the population of the EC-28 countries by age, sex, immigrant status, region of birth, education status, labor force participation as core dimensions. In countries with sufficient and reliable data other
dimensions, such as knowledge of languages or religious denomination, may be added.
This part of this methodological document is sub-divided in three sections. In the first section, the structure of the proposed microsimulation model is presented in general terms. In the second section, special attention is given to the content of the European Labor Force Survey (EU-LFS) which is proposed as the main data source and the base population of the model. Finally, the third section defines the main events governing
state transitions in the model and discusses the methods used to estimate relevant parameters.
1 - General structure of the model
We propose to develop a dynamic, continuous time, case- and event-based, open, stochastic (Monte Carlo) and spatial microsimulation projection model of the EU-28 population using the Modgen3 programming
language. Its point of departure will be 2015 and its starting population will be based on a pooled 2014-2015 EU-LFS microdata file to increase the sample size. Its general structure will be similar to the structure of the LSD-C model4 developed for projecting the Canadian population. For the purpose of this methodological report,
we will refer to the proposed model using the name CEPAM-EU.
CEPAM-EU will be case-based, meaning that each individual will be simulated separately from other individuals and that no interactions between individuals will be allowed (with the exception of interactions between mother and children). The model will also be dynamic and in continuous time, meaning that characteristics of i di iduals a e odified o ti uousl i eal ti e , i o t ast to dis ete-time models where characteristics are changed within predefined time units (typically one year). This allows for an easier treatment of competing risks.
3 Modgen is a meta language of C++ developed and maintained by Statistics Canada. Modgen and its documentation may be downloaded for free on
The CEPAM-EU model will simultaneously projects demographic (age, sex, place of residence, immigrant status), ethnocultural (country of birth, and where possible other variables such as language or religion) and socioeconomic (education, labor force participation, unemployment and hours worked) characteristics of the EU-28 population. It will allow for changes in individual characteristics over the life course as well as for intergenerational transfers of some characteristics of the mother to the child born.
Individuals from the base population will be simulated one by one and their characteristics will be modified through scheduled events whose timing will be determined by the values of their specific input parameters at any given time during the projection period. The parameters will themselves be derived from a variety of sources and methods.
The occurrence of each event will depend on a selection of individual characteristics which can vary from one type of event to the other, or between countries. Interregional mobility, for example, can vary according to age, sex, place of residence, language skills, immigrant status and country of birth, education and labor force participation; while fertility can vary with age, religion, immigrant status and education. It is important to stress that microsimulation is a flexible methodology allowing the use of different equations and risk
odels fo the sa e e e t a o di g to a i di idual’s egio o ou t of eside e. Thus, i the ase of the fertility example, fertility differentials by religious affiliation can be added only where this information is available.
The conceptualisation of the model events and the derivation of the corresponding parameters are described below in the last section. The following section addresses the issue of the base population.
2 - The EU-LFS and the base population
The base population is a representation of the population at a given time and is used as a starting point in a simulation. A micro database representative of the starting population along all (or most) of its relevant characteristics is the corner stone of any dynamic microsimulation model. In a country-specific project, the base population will usually be extracted from a national census, a population register or another large survey. Finding such a database covering all EC-28 countries with harmonized content for all the dimensions was one of the challenges of the present project. Fortunately, the EU-LFS provides an adequate survey base for the starting population, and its advantages and disadvantages will be discussed below.
A base population is usually constructed by recoding and extracting relevant variables from a large survey or a national census. It the context of this project, we would have to rely on a survey that ideally covered all needed variables5 for all EU-28 countries in a harmonized way. The EU-LFS appears to meet these criteria. It has the
advantage of providing several years of consistent and harmonized data for all countries6 and has a large
sample size. A typical yearly data file contains a total of total of 4.7 million cases, but the coverage varies between countries. In 2012, Iceland with near 13 000 cases had the smallest sample size while Italy with 607 000 cases was the largest. Two years of data can be pooled to increase the sample size, improve estimations and reduce the Monte Carlo error. The historical data may also be used to follow trends and determine if parameters are stable or more likely to change over time. The EU-LFS obviously contains detailed data on labor and employment history (including duration in current LF status), but also several individual characteristics necessary to fulfil the project objectives: age, sex, country of residence, nationality, country of birth, year and age at immigration (in the country of residence), years of education and year of completion of highest education level, education of parents and household structure which can be used to estimate fertility differentials using the own-children method.
As comprehensive as it may be, the EU-LFS does not include all of the suggested dimensions included
in this proposal, such as religious affiliation or language skills7. Those characteristics will have to be imputed in
the base population based on another data sources (ESS). This shortcoming, however, is of relatively minor importance compared to the substantial advantages of using the EU-LFS as the base population.
3 - Main components of the model
In general, model parameters will be estimated using logistic regressions or proportional hazard modeling. Several data sources will be used for analysis: EU-LFS, censuses, vital statistics, European Social Surveys, Eurobarometers, Population Health Surveys and other relevant sources. The following paragraphs briefly discuss data sources and estimation procedures of model parameters. It currently relies extensively on the EU-LFS data as the exploration of other possible sources is yet to be completed.
Mortality: Projected survivorship proportions by age, sex, country and education level estimated for the macro
model can be directly used in the microsimulation model. In addition, it might be possible to add a parameter to take into account the healthy immigrant effect, but at this point it is not clear whether a data file exists to estimate this differential.
Fertility: I the p oposed odel, the p o a ilit of ha i g a hild ill depe d o the othe ’s age, pla e of
residence, immigrant status and length of residence, and education level. Base risk will be estimated using vital statistics and fertility differentials using the EU-LFS data and the own- hild e ethod. A i th does ’t ha ge the othe ’s ha a te isti s e ept its pa it , a d sta ts the si ulatio of a e ase. The ha a te isti s of the child are defined using i fo atio f o the othe , ut the ha a te isti s of the hild do ’t ha e to be the same as the characteristics of the mother (i.e. there is a possibility of intergenerational changes in characteristics such as spoken language or religion).
Internal migration: In the context of an European model, internal migration refers to moves between the EU-28
countries. The EU-LFS is not a good source for estimating flows between countries because of sample size and under enumeration of non-natives, but will be used to estimate differentials in the probability of migrating using the information about the country of residence a year ago available in the EU-LFS. In a first step, the origin-destination total flows will be estimate using Bayesian method. Then, using the Rogers-Castro model, the total flows will be disaggregated by age. Differentials in outmigration probabilities will be estimated using logistic regressions and the EU-LFS. Regressors will include immigrant status, country of birth, education level, LF activity status, and length of time spent in the current country of residence and control for age and sex. In a final step, a country of destination will be attributed to each out-migrant according to his or her specific country of origin, age group, sex and education level using distribution matrices estimated from past observed trends.
Education level: Transitions between four education levels (less than high school, high school graduate, more
than high school but not graduated, and university graduate) will be estimated using logistic regressions and the EU-LFS data. The model will first attribute a highest education level (determined at birth or at t0 for those
aged 0-24 in the base population) and then, for those with a high school level or more, determine the age at transition to higher education level. The relevant determinants will be sex, country of residence, education of mother, immigrant status, language spoken and religion. A cohort parameter will also be estimated to take into account the increasing educational attainment of younger cohorts.
Labor force: EU-LFS data will be used to estimate the transitions between active and inactive and between
employed and unemployed statuses by age, sex, region, immigrant status/country of origin and possibly some other characteristics. For those who are employed, we will also project the total number of hours worked.
Emigration: Since migrations between EU countries are modeled as internal mobility, emigration refers to a
move outside the EU-28. Probabilities of leaving the country (excluding internal moves) will be estimated using annual emigration rates by age, sex, and region from national population estimates. If possible, a parameter will take into account the highe isk fo e e t i ig a ts to lea e the ou t , ut at this poi t e do ’t know whether a data source is available to realize that estimation.
Immigration: a predetermined number of immigrants from outside the EU-28 will be added into the projection
model year by year. This number of immigrants and their characteristics will vary from one scenario to the other. The model will allow to specify the characteristics (age at arrival, sex, country of birth, education level, etc.) of new immigrants according to an observed distribution (for instance, taken from recent immigrants in the EU-LFS o a o di g to the fi di gs ge e ated i the a al sis of the push fa to s . O e i to the odel, immigrants will be subject to the same events as the base population, but with their specific probabilities.
Assumptions and scenarios
Projection scenarios will be established according to specific sets of assumptions on both the general level of each phenomenon and the characteristic-specific differentials between individuals at risk of experiencing the event. For example, the model will allow for changes of total fertility level over time and of fertility differentials a o di g to the o a ’s characteristics.
For immigration level and characteristics, specific scenarios will be established in the analytical part of part 3 of the research project (push factors). For the sake of this proposal, it is only important to state that scenarios and hypotheses will occur both at the macro and micro (individual) levels, and will permit changing behavior over the simulated life courses.
One scenario will be designed so as to replicate the age and sex structure of the national population
projections compiled by Eurostat (this scenario will not include any differential risks). This will be useful to both calibrate and validate the microsimulation model and to assure a projection scenario that will provide detailed characteristics of the population that will be coherent in terms of age and sex structure with the official national statistics.
3.
Push factors:
3.1 Human Capital projections to 2060 for all African and West-Asian countries following the
SSP narratives
Population, Migration and Environment: The long view
The number of people inhabiting the earth has fluctuated significantly over the course of human history, in response to both natural changes in the environment and stresses to local habitats created by the populations themselves (FN: This section draws heavily on Chapter 12 of Lutz et al 2014). From the first appearance of Ho o sapie s so e , ea s ago i Af i a u til a out , ea s ago, the o ld’s hu a populatio was well under one million, a number that meant the threat of extinction was always looming (Biraben 2003). Only after the Neolithic Revolution, which introduced agriculture, did the world population increase
significantly, surpassing 100 million about 7000 years ago. But it was in the 19th century that population growth
ega to a ele ate i hat a e o the o ld’s ost i dust ialized ou t ies. This apid populatio i ease as a consequence of declining death rates due to better nutrition and hygiene, more accessible fresh water supplies, and advances in preventive medicine. Immediately following World War II, death rates began a precipitous fall, due primarily to the development of antibiotics and other medical advances. For several decades following the war, birth rates remained very high (and in some cases increased due to the better health of women) because high fertility norms had been deeply imbedded in most traditional cultures and religions. Such norms tend to change only slowly, and as a consequence, the world population experienced a dramatic increase, from 2.5 billion in 1950 to more than seven billion today.
Conventional population projections rarely make reference to the fact that all human life depends on
fun tio i g e i o e tal life suppo t s ste s. This suppo t s ste aspe t of hu a life as i luded i the expert questionnaire described in Chapters 2-7 of Lutz et al 2014, with some of the predefined arguments explicitly referring to the possible effects of environmental change on future trends in health, mortality, and migration.
With a time horizon of up to 2050, the possible effects of environmental change on the population outlook are typically seen by the experts as having only marginal impacts. This may be due to the fact that the international population experts included in the survey were almost exclusively social scientists who rarely deal with
environmental issues and consider social and economic factors as the key drivers in their analyzes. The slow progression of global climate change, at least on the scale of human measurement, is also a factor in the e pe ts’ judg e ts. A othe da pe i g fa to o the ati g of e i o e tal ha ge is that even the more dramatic climate change scenarios do not predict significant changes over the next few decades. The significant changes in sea level rise and regional temperature and precipitation patterns could potentially have serious implications for future health and migration patterns, but not until the second half of the century and beyond. This section will address the environmental change issue directly by analyzing the global population and human capital outlook for the rest of this century in a broader context of sustainable development and global
environmental change. In doing so, we will consider both the effects of human population on the natural environment and the vulnerability of human populations to such possible future changes.
Figure 3: Chart depicting how the human population influences climate change and is in turn affected by the consequences of climate change (Source: (Wolfgang Lutz 2009c)).
Figure 3 depicts how the interactions between population change and climate change can be conceptualized. It shows that the changing size and structure of human populations enter into our concerns about climate change at both the beginning and the end of the causal chain. Humans have been causing the emissions that trigger climate change. In turn, climate change sets in motion forces that a th eate hu a s’ ell-being. In the past most research and policy focus has been on mitigating greenhouse gas emissions, but more recently the emphasis has been shifting to strategies for strengthening adaptive capacities for coping with unavoidable climate change. This shift opens important new areas of analysis for demographers in all parts of the world. Although efforts to quantify the contribution of population changes to climate change have been outside the realm of demography and have proven difficult, efforts to address adaptive capacity by studying and forecasting differential vulnerability are well-suited to what the powerful demographic toolbox has to offer (Wolfgang Lutz 2009c).
Climate change is of concern principally because it is dangerous to human well-being. The notion of da ge ous has a spe ifi i po ta e ith espe t to li ate ha ge e ause the o l glo all i di g agreement, the 1992 Framework Convention o Cli ate Cha ge, postulates i its o e se te e to a oid dangerous interfe e e ith the li ate s ste . This o e tio has e o e the fu da e tal do u e t supporting every international effort to combat or adapt to climate change. In principle, every assessment of the dangers associated with alternative emissions trajectories would have to anticipate the consequences of the resulting climate change on human well-being. This is impossible in practice because not enough is known about what changes will occur in the bio-physical conditions or how future populations will be able to cope with those changes. The European Union and the Copenhagen Climate Summit have defined a simple, clear goal in mitigating climate change: limiting the warming to not more than 2 °C in global mean temperature. This pragmatic definition of dangerous climate change, however, does not address the role of adaptation in moderating the impacts on human well-being. This path of causation is depicted on the right-hand side of the chart at the bottom of Figure 3.
On the left side of the chart, population is viewed as a driver of the emissions of greenhouse gases (GHG), which is in line with the conventional view: The I = PAT model (Ehrlich and Holdren 1971) tried to distinguish between the supposedly separate effects of population size (P), consumption associated with affluence (A), and technological efficiency (T). Recent analyzes have considered more complex effects and the possibility of interactions such as the odel O’Neill et al (2010), which includes the effects of changing household size, age structure, and urbanization on energy use. The findings show that population ageing and urbanization can have significant effects on total emissions with the magnitudes depending on the specific model definitions. In the same chart, the changing structure of the human population by age, sex, education, place of residence, and household size also appear as drivers of consumption levels.
The right hand side of Figure 3 indicates that the human population is also being affected by climate change. People will likely be exposed to increasing hazards resulting from more frequent and intensive extreme events such as storms, floods, sea-level rise, and changing regional and temporal patterns of temperature and
humidity. The temperature and humidity changes are expected to affect agricultural production and the spread of certain diseases. Whether and to what extent these hazards will result in human fatalities depends on the vulnerability of the people affected. That vulnerability is dependent on their strength and resiliency.
Assessment of likely future vulnerability presents the biggest research gap for assessing the dangers associated with climate change and is difficult to conduct. Many published estimates of likely climate-induced fatalities, for instance calculations of additional malaria deaths due to climate change, assume that future climate conditions (e.g. in 2070) will affect populations that will continue into the future with similar socio-economic development and, as a result, have similar public health capabilities as they have today. As illustrated in other chapters of Lutz et al. 2014, however, societies are not stationary and will almost certainly be quite different from today. In particular, younger generations in almost all countries are on average better educated than the older ones, which will result in improvements in the average education of the future adult population. Economic growth and public health governance will also strengthen resilience. In addition to mortality and morbidity directly inflicted by such hazards, many of the expected consequences of climate change arise from climate-induced threats to traditional livelihoods. Loss of li elihood a constitute a push factor for migration or, in the worst case, lead to mortality – both demographic factors that ha ge a populatio ’s
structure.
As demonstrated in the previous sections, we not only know that societies change over time as a function of changing age, sex, education, and other structures, but we also have a unique tool kit (multi-state cohort component methods) to model and project those changing structures with relatively small uncertainties over several decades. Furthermore, demographers have long studied a wide variety of differentials, particularly differential vulnerability to threats such as infant mortality, adult mortality, morbidity, and disability. We can also study differentials in education and other empowerment factors that enhance the adaptive capacity of individuals, households, and communities.
Defining the SSP scenarios
The multi-state cohort component approach has substantial potential for studying climate change mitigation and adaptation. Accordingly, the most recent international effort to develop a shared set of socio-economic scenarios included a more detailed population component than previous efforts. For more than a dozen years the Intergovernmental Panel on Climate Change (IPCC) modeling community has used a set of emissions scenarios as defined in Nakicenovic (2000) . While these SRES scenarios were very detailed on the energy, technology, and emissions side, they included only total population size and GDP per capita as indicators. Population was only used as a scaling variable.
More recently the climate change research community began development of a new framework for the creation and use of scenarios to improve interdisciplinary analysis and assessment of climate change, its impacts, and response options O’Neill et al.
This process, as formulated at an IPCC workshop in 2007, includes a set of forcing pathways, known as the Representative Concentration Pathways (RCPs), to be combined with alternative socioeconomic development pathways (Moss et al. 2010). The development of RCPs has been completed and the pathways documented in a special issue of Climatic Change (Vuuren et al. 2011) . The development of the socioeconomic scenarios, known as Shared Socioeconomic Pathways (SSPs) was completed in late 2012.
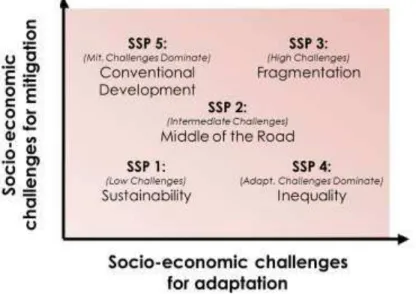
The SSPs were designed to include both a qualitative component in the form of a narrative on global
development (see below), and a quantitative component that includes numerical pathways for certain variables (Arnell et al. 2011). Narratives were developed for basic versions of five SSPs, illustrated in Figure 3 with respect to socioeconomic challenges to mitigation and adaptation. This range of the SSPs is broad enough, in principle, to contain a large number of socioeconomic pathways that represent various combinations of challenges to mitigation and adaptation.The SSPs as presented here are single pathways that are
representative of the types of socioeconomic pathways that could occupy particular domains within the overall range. The following definitions of the narratives are based on O’Neill O’Neill et al. . In the following list, we present the overall storyline and then translate this general view of future global trends into specific assumptions for future fertility, mortality, migration, and education trends as they have been developed at IIASA in consultations with the global SSP community (see Table 1 below). Three groups of countries are
o side ed: High fe tilit ou t ies as defi ed a Total Fe tilit Rate of more than 2.9 in 2005-2010; Lo fertilit ou t ies i ludi g all ou t ies ith a Total Fe tilit Rate of .9 a d elo that a e ot i luded i the thi d atego ; Ri h-OECD ou t ies , defi ed OECD e e ship a d the Wo ld Ba k atego of high income countries. It is important to note that for this set of general SSPs, countries are assumed to stay in their initial grouping throughout the process. This may be unrealistic for countries that are, for example, in the midst of a fertility decline and may move soon into the low fertility group of countries. Because there are a seemingly infinite number of ways in which countries could change groupings, it was decided that this should be left to users who want to define their country-specific SSPs.
Although the SSP process and the effort reported in the first eleven chapters of Lutz et al 2014 book were independent processes, they now have been merged in the sense that the Medium Scenario of the above described new populations projections is identical in every respect with the SSP2 as described below. Similarly, the different education scenarios and the high and low fertility, mortality, and migration assumptions used in the SSP scenarios are directly derived from the analysis presented in this book. In this way the SSP community can benefit from the scientific effort that produced this new set of projections.
SSP 1: Sustainability
This world is making relatively good progress toward sustainability, with ongoing efforts to achieve
development goals while reducing resource intensity and fossil fuel dependency. Elements that contribute to this progress are a rapid development of low-income countries, a reduction of inequality (globally and within economies), rapid technology development, and a high level of awareness regarding environmental
degradation. Rapid economic growth in low-income countries reduces the number of people below the poverty line. The world is characterized by an open, globalized economy, with rapid technological change directed toward environmentally friendly processes, including clean energy technologies and innovations that enhance agricultural output. Consumption is oriented toward low material growth and energy intensity, with a relatively low level of consumption of animal products. Significant investments in education coincide with low population growth, and both government and private institutions are working together to promote public policy solutions and economic development. The Millennium Development Goals are achieved within the next decade or two, resulting in educated populations with access to safe water, improved sanitation and medical care. Other factors that reduce vulnerability to climate and other global changes include the implementation of stringent policies to control air pollutants and rapid shifts toward universal access to clean and modern energy in the developing world.
Population Component of SSP1:
This storyline assumes that educational and health investments accelerate the demographic transition, leading to a relatively low world population. This implies assumptions of low mortality and high education for all three country groups. With respect to fertility assumptions the story is more complex. For rich OECD countries the emphasis on quality of life is assumed to make it easier for women to combine work and family, making further fertility declines unlikely. For this reason the medium fertility assumption is chosen for this group of countries. Low fertility assumptions are chosen for all other countries as implied by the assumed rapid continuation of demographic transition. Migration levels are assumed to be medium for all countries under this SSP.
SSP2: Middle of the road
– continuation of trends
In this SSP2 world, trends typical of recent decades continue, with some progress toward achieving development goals, historic reductions in resource and energy intensity, and slowly decreasing fossil fuel dependency. Development of low-income countries proceeds unevenly, with some countries making relatively good progress while others are left behind. Most economies are politically stable with partially functioning and globally connected markets. A limited number of comparatively weak global institutions exist. Per-capita income levels grow at a medium pace on the global average, with slowly converging income levels between developing and industrialized countries. Intra-regional income distributions improve slightly with increasing national income, but disparities remain high in some regions. Educational investments are not high enough to rapidly slow population growth, particularly in low-income countries. Achievement of the Millennium Development Goals at the country level is delayed by several decades, leaving populations without access to safe water, improved sanitation, or medical care. Similarly, there is only intermediate success in addressing air pollution and improving energy access for the poor.
Population Component of SSP2: Medium
This is the middle of the road scenario that that can also be seen as the most likely path for each country. It combines for all countries medium fertility with medium mortality, medium migration, and the Global Education Trend (GET) education scenario. This corresponds exactly to the medium scenario of the Wittgenstein Centre projections described in the previous chapters.
SSP 3: Fragmentation
This narrative is an opposite of sustainability. The world is separated into regions characterized by extreme poverty, with pockets of moderate wealth. In the majority of countries, the struggle is to maintain living standards for rapidly growing populations. Regional blocks of countries have re-emerged with little
coordination between them. This is a world failing to achieve global development goals and with little progress in reducing resource intensity and fossil fuel dependency. Environmental concerns such as air pollution are not being addressed. Countries in this scenario focus on achieving energy and food security goals within their own region. The world has de-globalized, and international trade, including energy resource and agricultural markets, is severely restricted. The lack of international cooperation combined with low investments in technology development and education slow down economic growth in high-, middle-, and low-income regions. Population growth in this scenario is high as a result of the education and economic trends, and the growth in urban areas in low-income countries is often in unplanned settlements. Unmitigated emissions are relatively high, driven by the high population growth, use of local energy resources, and slow technological change in the energy sector. Governance and institutions are weak and lack cooperation, consensus, or effective leadership. Investments in human capital are low and inequality is high. A regionalized world leads to reduced trade flows, and institutional development is unfavorable, leaving large numbers of people vulnerable to climate change because of their low adaptive capacity. Policies are oriented towards security, including barriers to trade.
Population Component of SSP3: Stalled Development
In demographic terms this is a world with a stalled demographic transition. Fertility is assumed to be low in the rich OECD countries and high in the other two country groups. Population growth is assumed to be high in developing countries and low in industrialized countries. Accordingly, this scenario assumes high mortality and low education for all three country groupings. Due to the emphasis on security and barriers to international exchange, migration is assumed to be low for all countries.
SSP 4: Inequality
This pathway envisions a highly unequal world, both within and across countries. A relatively small, rich global elite is responsible for much of the emissions, while a larger, poorer group contributes little to emissions and is vulnerable to impacts of climate change in both industrialized and developing countries. In this world, global energy corporations use investments in Research and Development as hedging strategy against potential resource scarcity or climate policy, developing and applying low-cost alternative technologies. Mitigation challenges are therefore low due to a combination of low reference emissions and/or high latent capacity to mitigate. Governance and globalization are effective for and controlled by the elite, but are ineffective for most of the population. Access to high quality education, health services, and family planning is also limited, leading to high population growth in low-income countries. Challenges to adaptation are high due to relatively low income and low human capital among the poorer population, and ineffective institutions.
Population Component of SSP4: Inequality
In order to best reflect the inequality in education, Lutz et al (2014) developed a special scenario that differs from the standard education scenarios used in the rest of the book in that it produces a more polarized education distribution in every country. There is a group with very high education levels (which is bigger in the rich OECD countries) and large groups with low education levels. In terms of fertility, the national averages i pl o ti ued high fe tilit i toda ’s high fe tilit ou t ies a d o ti ued lo fe tilit i oth g oups of lo fertility countries. The high fertility countries are assumed to suffer from high levels of mortality, whereas the other two groups have medium mortality. Migration is assumed to be at the medium level for all countries.