This is an author-deposited version published in : http://oatao.univ-toulouse.fr/ Eprints ID : 3176
O
pen
A
rchive
T
OULOUSE
A
rchive
O
uverte (
OATAO
)
OATAO is an open access repository that collects the work of Toulouse researchers and makes it freely available over the web where possible.
To link to this article : DOI:10.1002/bit.22035 URL : http://dx.doi.org/ 10.1002/bit.22035
To cite this version :
Loubiere, Karine and Olivo, Erell and Bougaran, Gael and Pruvost, Jérémy and Robert, René and Legrand, Jack ( 2009) A new photobioreactor for continuous microalgal production in hatcheries based on external-loop airlift and swirling flow. Biotechnology and Bioengineering, vol. 102 (n° 1). pp. 132-146. ISSN 0006-3592
A NEW PHOTOBIOREACTOR FOR CONTINUOUS MICROALGAL PRODUCTION IN HATCHERIES BASED ON EXTERNAL-LOOP AIRLIFT AND SWIRLING
FLOW
Karine Loubière1, Erell Olivo², Gael Bougaran², Jérémy Pruvost1, René Robert3, Jack Legrand1
1
Laboratoire GEPEA UMR CNRS 6144
CRTT, Boulevard de l'Université, BP 406, 44602 Saint-Nazaire Cedex, France Telephone: +33(0)2 40.17.26.68; Fax: +33(0)2.40.17.26.18
e-mail: Jeremy.Pruvost @univ-nantes.fr
2
Laboratoire Physiologie et Biotechnologie des Algues
IFREMER Centre de Nantes, BP 21105, 44311 Nantes cedex 3, France
3
Laboratoire de Physiologie des Invertébrés
IFREMER, Station Expérimentale d'Argenton, Presqu'île du Vivier, 29840 Argenton en Landunvez, France
Abstract.
This study deals with the scale of a new photobioreactor for continuous microalgal production in hatcheries. The combination of the state-of-art with the constraints inherent to hatcheries has turned the design into a closed, artificially illuminated and external-loop airlift configuration based on a succession of elementary modules, each one being composed of two transparent vertical interconnected columns. The liquid circulation is ensured pneumatically (air injections) with respect to a swirling motion (tangential inlets). A single module of the whole photobioreactor was built-up to investigate how parameters, such as air sparger type, gas flow rate, tangential inlet, column radius and height can influence radiative transfer, hydrodynamics, mass transfer and biological performances. The volumetric productivities were predicted by modeling radiative transfer and growth of Isochrysis affinis galbana (clone Tahiti). The hydrodynamics of the liquid phase was modeled in terms of global flow behavior (circulation and mixing times, Péclet number) and of swirling motion decay along the column (Particle Image Velocimetry). The aeration performances were determined by overall volumetric mass transfer measurements. Continuous cultures of Isochrysis affinis galbana (clone Tahiti) were run in two geometrical configurations, generating either an axial or a swirling flow. Lastly, the definitive options of design are presented as well as a 120 Liter prototype, currently implemented in a French mollusk hatchery and commercialized.
Keywords: continuous photobioreactor, hatchery, airlift, swirling flow, Isochrysis affinis
galbana
INTRODUCTION
With regard to their taxonomic diversity and plasticity, photosynthetic microorganisms are a natural resource with high potential, thus attracting scientific and industrial attention. Their
production of high-value compounds and for environmental applications (wastewater treatment, hydrogen or biodiesel production) (Richmond 2004, Spolaore et al 2006). Their production under controlled conditions implies a specific reactor, named photobioreactor, which mainly differs from classical bioreactors by the need of a light supply, these microorganisms being photoautotrophic. Light cannot be considered as a common substrate insofar as it involves two antagonist phenomena: on the one hand, a high amount of photonic energy is required to ensure microalga growth conditions, but on the other hand, the increase of the biomass concentration in the reactor decreases the light penetration depth in the culture due to cell self-shading. Thus, the use of light in the culture is the major constraint in photobioreactors, which makes their scale-up difficult and often limits the production of concentrated biomass with high quality and productivity. The literature describes a great diversity of photobioreactors, often classified into plane and cylindrical/tubular geometrical configurations (Carvalho et al 2006), showing that no a priori ideal geometry exists.
In the present study, the application targeted is aquaculture and more particularly mollusk hatcheries. Microalgae are here used to feed broodstock, larvae and spat, and have then to be regularly produced in large amounts (Coutteau and Sorgeloos 1992). According to a survey that we have conducted in the main six hatcheries of the French West Coast, microalgal production represented in 2002, for flagellate microalgae, from 400 to 6,000 billions cells per day, and for diatoms, from 900 to 20,000 billions cells per day. The microalgae commonly cultivated for mollusks are Isochrysis affinis galbana, Pavlova lutheri, Chaetoceros muelleri,
Chaetoceros calcitrans, Thalassiosira pseudonana, Skeletonema marinoï (Borowitzka, 1997).
For Pacific cupped oyster Crassostrea giga larvae, a bi-specific diet is rather privileged for
the youngest larvae: Isochrysis affinis galbana is then associated with a complementary microalga which is different from one hatchery to another (Rico-Villa et al 2006). At present, microalgal production in French hatcheries is mainly performed by means of batch culture
systems consisting of vertical aerated column PMMA reactors. Their major drawbacks are a partial control of biomass quality and quantity, low productivities, contamination, manpower intensive (frequent handling and cleaning operations), biofouling.
To improve this situation, the present work proposes a new photobioreactor for continuous microalgal production in hatcheries. The constraints to integrate for the design are: to ensure a continuous production adjustable to hatchery requirements, to be a closed and artificially illuminated system, to have a design as simple as possible for minimizing fabrication cost, price and floor-space, to be robust (marine atmosphere) and easy to clean. From that, a preliminary choice of geometrical configuration has been realized: it consists of a succession of elementary modules, each one being composed of two transparent vertical interconnected columns. The liquid phase circulation is performed pneumatically, namely by gas injections placed at the column bottom and uniformly dispatched in the whole photobioreactor. Thus, each elementary module can be seen as an external loop airlift photobioreactor, except that the outlet of the downcomer is connected to the next module. In addition, as already used in annular (Pruvost et al 2002, Muller-Feuga et al 2003a, Muller-Feuga et al 2003b) and torus photobioreactors (Pottier et al 2005), a swirling motion will be generated (tangential inlets) in order to minimize the biofilm formation at walls. The major interest of this design is not only to enable closed, artificially-illuminated and continuous microalgal culture to be easily performed, but also modularity in volume to be satisfied without scaling-up/down calculations. Indeed, the illumination device will be designed so as to conserve the same illuminated specific surface (ratio of the illuminated surface to the culture volume) whatever the numbers of modules, implying that, for a given incident flux and a fixed dilution rate, the volumetric productivity will remain identical for a single module and for a multimodule photobioreator. As a consequence, the number of elementary modules will only be conditioned by the microalgal production required. This is an essential advantage with regard
to the variability of hatchery sizes and phytoplankton productions.
This study reports results of various investigations carried out to scale the geometry of this photobioreactor (column diameter and length) and to optimize its design (air sparger, tangential inlets). A single module of the whole photobioreactor is built up to test the influence of various parameters. The column diameter constitutes a key parameter as controlling the light distribution inside the culture: it will be chosen in accordance with the predictions of volumetric productivities (coupled modeling of radiative transfer and photosynthetic growth). The column height is mainly dependent on the decay of swirling motion along the column and on its efficiency to limit biofouling at walls; that is why the effects of air flow rate, air sparger and tangential inlets on hydrodynamics will be investigated (tracing, PIV). Moreover, the aeration performances will be determined by overall volumetric mass transfer measurements. Lastly, continuous cultures of the microalga Isochrysis affinis
galbana (clone Tahiti) will be run in two geometrical configurations, generating either an
axial or a swirling motion; they will enable the volumetric productivities and the biofouling deposited to be compared. In conclusion, the definitive options of design will be expressed and a 120-L prototype presented.
MATERALS AND METHODS
Description of the experimental set-up
The single-module photobioreactor consists of an external-loop airlift made of transparent PMMA to allow effective light penetration and a clear visual observation (Figure 1a). This device is composed of two vertical columns connected by two flanges, the column above the air sparger being called the riser and the other one the downcomer. Liquid circulation is induced by the hydrostatic unbalance caused by the density difference between the gassed and ungassed liquid columns. These columns are of equal sizes with a 0.03 m radius R, a 1 m
liquid height HL. The total liquid volume VL is 6.1 L. Note that the downcomer column is machined in a cubic transparent block to minimize optical distortion for PIV measurements. The swirling motion is induced by tangential inlets inside each column (Legentilhomme and Legrand 1991). For that, specific connection flanges are designed by means of prism-shaped inserts of different sizes introduced in the body of the flange (Figure 1b). The three geometrical configurations of flanges investigated are characterized by Velocity Factors VF equal to 1, 4 and 9, where VF1 generates an axial motion inside columns (no prism insert). This latter parameter, VF, is defined as the ratio of the injection velocity at the flange outlet to the mean velocity at the flange inlet (Legentilhomme and Legrand 1991), namely between the sections at the flange inlet and outlet (Figure 1c).
Two air spargers are tested (Figure 1a): a capillary (2 mm in diameter) located tangentially to the wall of the riser base (noticed T), and an elastic multi-perforated membrane recovering the entire column section (denoted M). The air flow rates QG vary between 0.1 and 1.6 NL.min-1. The superficial velocities UG are then very low, ranging from 2.2 to 9.4 mm.s-1. The
associated specific power input in the reactor P /G VL (Chisti, 1989) varies from 11 to 43 W.m-3. Note that no bubbles are observed in the downcomer and that the average gas hold-up is always below 1% (qualitative measurements).
Hydrodynamics of the liquid phase
Tracer measurements. A pulse of tracer (seawater) is injected in front of the inlet of the lower connection flange, and is detected by a platinum conductimetric probe located inside this flange, flushed with wall. The variation in conductance, directly proportional to tracer concentration, is measured by a conductimeter Tacussel® CD810 coupled with a data acquisition device and a computer. These tracer experiments are performed in water, for three Velocity Factors (VF1, VF4, VF9), for both air spargers and for seven gas flow rates.
its decay along the downcomer height where no bubble entrainment occurs. A Dantec® device is used with a laser Nd-YAG New Wave Solo (15 mJ/pulse). The light pulses are synchronized with a CCD camera (Dantec Dynamics Flow Sense M2/E 8 bits, 1600×1186 pixels²) equipped with an objective Nikon 60 mm. These images are analyzed with the Flow Manager® software to obtain velocity fields. The tracer is made of polyamide particles (Dantec Invent® 38A2121) with a mean diameter of 50 µm (concentration close to 0.1 g.L-1). The image calibration is ensured by using sighting marks placed inside the downcomer whose dimensions are known. To determine the swirl intensity, instantaneous velocity fields are measured, inside the downcomer, in rx-planes (Figure 2) at different radial positions (r equal to -0.025, -0.02, -0.01, 0, 0.01, 0.02 and 0.025 m) and axial positions (x equal to 0.05, 0.15, 0.25, 0.4, 0.55 and 0.85 m). For a given operating condition, an average of 200 image acquisitions is required to calculate time-averaged velocity fields. The image post-treatment is equivalent to the one performed by Pruvost et al (2000). Finally, the radial profiles of axial and tangential components of time-averaged velocity (noted U(r) and W(r) respectively) are obtained at different heights, x, in the downcomer. It is important to precise that, according to the measurement planes, the tangential component of velocity, W, can be only known in the vertical symmetrical plane of the downcomer (Pruvost et al 2000). In Figure 2a, the locations where they are calculated are represented by black points. In practice, for one given axial position x, the radial profiles of tangential components, W(r), are reconstructed from data measured in the rx-planes acquired at different radial positions r (Figure 2a). These PIV experiments are carried out in seawater, for two Velocity Factors (VF4, VF9), both air spargers and two gas flow rates (QG = 0.74 and 1.6 NL.min-1).
Gas-Liquid mass transfer
The well-known dynamic gassing-in and gassing-out method is used to measure overall volumetric gas-liquid mass transfer coefficients kLa (Roustan 2003). After removing oxygen
from the liquid phase (nitrogen bubbling), air flow is established and the time-variation of CL
followed, until saturation, by means of an oxygen probe (Mettler Toledo® O2 InPro 6800) placed at the top of the downcomer column and connected to a transmitter (Mettler Toledo® O2 InPro 4100). During this reoxygenation step, the mass balance in dissolved oxygen concentration is: ) ( d d * L L L L k a C C t C − = (1)
where CL* is the dissolved oxygen concentration at saturation (at 25°C and at the oxygen
partial pressure in air under atmospheric pressure, it is equal to 8.3 mg.L-1 for tap water and to
6.9 mg.L-1 for seawater and Conway medium). The dynamics of the oxygen probe can be
described using a first-order differential equation (Ingham et al 1994) as:
) ( 1 d d p L p p C C t t C − = (2)
where Cp is the dissolved oxygen concentration inside the probe. The time constant of the
oxygen probe, tp, is measured using a method based on probe response to negative oxygen
steps (Vandu et al 2004), and found equal to 14 s. This latter value is negligible when
compared to mass transfer characteristic times,1/kLa, the minimum of which is here 73 s.
Finally, the overall volumetric mass transfer coefficient is accurately determined by solving
the following equation resulting from the combination of Eq. (1) with Eq. (2):
− − − − + = 1 . ) / exp( . . ) . exp( 1 * p L p p L L L p t a k t t t a k t a k C C (3)
The mass transfer experiments are run for three liquid phases (tap water, seawater, Conway
medium), three Velocity Factors (VF1, VF4, VF9), both air spargers and five gas flow rates.
For all these conditions, the usual assumptions associated with Eq. (1) (i.e. a perfectly mixed
Algal cultures
Microalga and culture medium. Because it is used in French mollusk hatcheries, Isochrysis
affinis galbana (clone Tahiti) is selected for this study. Under the reference CCAP 927/14, it
was obtained from the phytoplanktonic collection of Oban (Scotland). The algal nutritive
medium consists of natural seawater (originated from the coastal area of Saint-Malo in
France, aged in the dark during one month, filter-sterilized through a 0.22 µm pore-size filter)
enriched in Conway medium at 1 mL per Liter of seawater (Table 1).
Growth curve. The growth curve of the microalga Isochrysis affinis galbana, µ(G), has to be determined for predicting productivity. For that,the planar torus photobioreactor described by
Pottier et al (2005) and Pruvost et al (2006) is used.The cultures are run in turbidostat mode.
A low cellular concentration (109 cell.L-1) is maintained to minimize the effects of mutual
shading. Indeed, to display accurate results, it is important to differentiate the incident light,
qO, measured behind the reactor surface from the averaged irradiance, G, really received by
the culture. Knowing cell concentration inside the reactor, G is calculated by integrating,
along the culture depth z, the attenuation profile of irradiance predicted by the radiative
transfer model (see Theoretical Developments below). As a very low concentration is
maintained in the torus reactor, the incident and averaged lights is very close, and thus the
potential error induced by the model becomes negligible. It must be noticed that such method
remains valid if incident light flux is kept in an acceptable range. Because of the low cell
density, high incident light flux would indeed lead to photoinhibition effects, possibly not
occurring when working in standard production conditions, with higher biomass concentration
and thus attenuation conditions.
This torus photobioreactor is illuminated by a set of 10 daylight fluorescent tubes (OSRAM
L13W/12-950, diameter 16 mm), fixed on a framework to keep them parallel. For a given
flux density - as commonly named in PBR studies) is measured, without microalgal culture,
behind the front surface of the reactor, by means of a spherical quantum sensor (LICOR
US-SQS/A Heinz Walz). Four measurement points are considered to calculate an average value of
qO. Once the culture has reached equilibrium, the averaged growth rate <µ> is determined,
and according to previous comments, can be associated to the real irradiance G received by
microalgae. The Isochrysis affinis galbana growth curve is here established for qO ranging
from 15 to 400 µmol.m-2.s-1.
Continuous cultures. The single-module photobioreactor is sterilized by a peroxyacetic acid solution (5‰, 20 min). The microalgal inoculum leads to an initial concentration close to 109
cell.L-1. Continuous cultures are run in chemostat mode: a KNF Stepdos® pump is used for
medium renewal while the culture is harvested by overflowing. Isochrysis affinis galbana
cultures are run in two geometrical configurations to compare biological performances using
an axial or a swirling motion. Thus, two identical pilots are used simultaneously: the first is
equipped with VF1-shaped flanges and the second with VF4-shaped flanges. Apart from VF,
the other conditions are similar. The dilution rate D is set to 0.36 d-1, but daily controlled. The
temperature is regulated at 27 ± 1°C (thermoregulated room), and the pH maintained at 7.2 ± 0.1 by automatic injection of CO2 (solenoid valve). The average incident light flux qO on the
reactor surface is equal to 250 ± 10 µmol.m-2.s-1. The air sparger is the capillary located tangentially to the wall of the riser base, and the air flow rate is fixed at 1.4 NL.min-1. Cell
concentration, X, is daily measured by cellular counting (Malassez cell), as well as the nitrate
and phosphate residual concentrations (ionic chromatography) to verify that no substrate
limitation occurs. For each VF condition, the continuous cultures are run three times. Lastly,
the volumetric productivity PX is calculated by the product between X and D at equilibrium.
To compare both configurations, the biofouling at walls is also visually observed.
fluorescent tubes (Grolux® F58W/GRO-T8, Sylvania Co.), horizontally disposed and spaced
12 cm from each other. For different distances between reactor and tubes, the incident light
flux qO behind the curved surface of the reactor is measured as a function of the angular
position
θ
C(from -π/2 to π/2).These measurements are performed, without culture, by using aspherical quantum sensor (LICOR US-SQS/A Heinz Walz, 3 mm in diameter), and will serve
as initial conditions in the light transfer modeling (see Theoretical Developments below).
Moreover, the attenuation profile of irradiance is experimentally determined for X = 1.7.1010
cell.L-1 and for qO = 210 µmol.m-2.s-1. For these experiments, the underwater spherical
quantum sensor is displaced radially inside the column (with an increment equal to 4.5 mm),
and a black shield is placed around the column half circumference opposite the light source to
avoid wall reflections.
THEORETICAL DEVELOPMENTS
Productivity prediction and Radiative transfer modeling
In steady state regime, the volumetric microalgal productivity, PX, is expressed as:
DX X µ
PX =< > = (4)
where <µ> is the average growth rate. For photosynthetic growth, µ depends on the
irradiance received G. Both absorption and scattering phenomena led to heterogeneous
radiative field inside the culture. Therefore, knowing the determination of <µ> imposes to
calculate first the attenuation profile along the culture depth, G(z). The coupling with
Isochrysis affinis galbana growth curve then enables the local growth kinetics µ(G(z)) and so
<µ> to be determinedcalculate.
As in Cornet et al (1995) and in Pottier et al (2005), a two-flux formulation of the general
theory of radiative transfer is used to determine the irradiance field. Based on an
and a normal incidence, this leads to the following analytical solution for irradiance
attenuation along a direction z (see Pottier et al., 2005 for a complete description of the
calculation):
(
)
(
)
( )
L(
L)
z L z L q z G O C δ α δ α δ α δ α θ − − − + − − − − − + = .exp ) 1 ( .exp ) 1 ( ) ( ).exp 1 ( ) ( ).exp 1 ( ) ( 2 ) ( 2 2 (5) where, E bE X bE E E s a s a aδ
α
α
, ( 2 ) ) 2 ( + = + =In contrast to the planar torus photobioreactor of Pottier et al (2005), the present airlift
geometry has a cylindrical-shaped surface. In this case, due to refraction effects induced by
curvature, the direction of light attenuation is no more unique: when passing across the
curvature, light rays are deviated from their initial direction. This phenomenon has been
integrated into the light transfer modeling of Pottier et al (2005), by considering: (i) the
distribution of incident light flux at the curvature boundaries, ( C)
O
q
θ
(see Material and Methods above), (ii) the Snell-Descartes law to calculate, for each incident light rayimpinging the reactor optical surface, its new direction z inside the culture and the associated
light path length L. The refraction phenomenon leads to intersections inside the culture
between several light directions: if the case, the resulting irradiance is then calculated as the
sum of irradiances obtained at the intersection point. Note that, even though the previous
assumptions are not really verified in the present case (quite diffused illumination), this
approach will be conserved insofar as the aim is just to use the light transfer modeling as a
tool to pre-design the multimodule photobioreactor.
the light propagation is considered along a unique axis, z, but in two opposite directions to
take into account the backward scattering part of light flux (I−). Assuming a quasi-collimated field of radiation and a normal incidence, the set of differential equations to solve
) ( d d ) ( d d − + − − − + + + − − = − − − = I I X bE XI E z I I I X bE XI E z I s a s a (5)
Note that, even though the previous assumptions are not really verified in the present case
(external and quite diffused illumination), this approach will be conserved insofar as the aim
is just to use the light transfer modeling as a tool to pre-design the multimodule
photobioreactor. Once the boundary conditions defined, the resolution of Eq. (5) leads to I+
and I−, and thus to the irradiance G at a given culture depth z as:
− ++ =I I z
G )( (6)
In contrast to the planar torus photobioreactor of Pottier et al (2005), the present airlift
geometry has a cylindrical-shaped surface. In this case, due to refraction effects induced by
curvature, the direction of the incident light flux is no more unique: when passing across the
curvature, light rays are deviated from their initial direction. This phenomenon has been
integrated into the light transfer modeling of Pottier et al (2005), by considering: (i) the
distribution of incident light flux at the curvature boundaries, ( C)
O
q
θ
(see Material and Methods above), (ii) the Fresnel-Descartes law to calculate, for each incident light rayimpinging the reactor optical surface, its new direction z inside the culture and the associated
light path length L. The refraction phenomenon leads to intersections inside the culture
between several light directions: the resulting irradiance is then calculated as the sum of
irradiances obtained at the intersection point.
The boundary conditions linked to Eq. (5) depend on light conditions and reactor geometry.
As, in the single-module photobioreactor, the front optical side is illuminated and the back
optical side is transparent, they are written, if L is the light path length, as:
0 : ) ( : 0 = = = = − + I L z q I z C O
θ
(7)Lastly,the irradiance profile along each ray direction is expressed by the analytical solution:
(
)
(
)
( )
L(
L)
z L z L q z G O C δ α δ α δ α δ α θ − − − + − − − − − + = .exp ) 1 ( .exp ) 1 ( ) ( ).exp 1 ( ) ( ).exp 1 ( ) ( 2 ) ( 2 2 (8) where, E bE X bE E E s a s a aδ
α
α
, ( 2 ) ) 2 ( + = + = (9)The accurate formulation of this radiative transfer model needs to determine the optical
properties of the culture. Pottier et al (2005) computed the optical properties of the microalga
Chlamydomonas reiinhardtii, by means of a powerful predictive method based on the
Lorenz-Mie theory and on a preliminary knowledge of microalga pigment contents, size and shape.
The same approach is applied here for Isochrysis affinis galbana by considering a mean
diameter of 5 µm, a mean cellular mass of 7.64 pg and an ovoid shape (image analysis).
Issued from literature data (Green and Leadbeater 1994), the pigment composition (weighted
percent) is: chlorophyll-a 2%, chlorophyll-b 0%, chlorophyll-c 0.6%, photoprotective
carotenoids (fucoxanthine, diadinoxanthine, diatoxanthine, caroten) 2.4%. Finally, the optical
properties of Isochrysis affinis galbana are the following:
01162 . 0 .kg m 757 .kg m 293 2 1 = 2 1 = = − E − b Ea s (6)
Global flow modeling
From tracer measurements, the hydrodynamic behavior is modeled by an axial dispersed plug
flow with total recirculation, thereby enabling the mean circulation time tC and the axial
dispersion coefficient Dax to be determined. This model, commonly used in the case of
swirling flows (Benkhelifa et al 2000), is expressed by:
(
)
∑
+∞ −∞ = ∞ + − − = j L L Pe j z Pe C Cθ
θ
πθ
θ
4 * exp 2 1 ) ( 2 (7)The mean circulation time, tC, is optimized, as well as the Péclet number PeL and the
algorithm. The optimization is considered valid if the mean standard deviation (between
calculated and experimental responses) is between 0.05 and 0.1. The mean circulation
velocity, UC, is then calculated by:
C t C t L U = (8)
The mixing time tm is defined with respect to a homogeneity degree equal to 95 %.
Characterization of swirling decaying flows
Even if swirling decaying flows are extremely complex (three-dimensional,
non-axi-symmetrical and non-established with regard to the axial position), the swirl intensity can be
quantified according to the swirl number Sn. This dimensionless parameter represents the
axial flux of swirl momentum divided by the product between the axial flux of axial
momentum and the column diameter (Gupta et al 1984), and is given by:
∫
∫
− − = R R R R r r U R r UWr Sn d 2 d 2 2 (9)It is particularly useful to study the decay of the swirling motion with the axial position from
the swirl inducer, this decay is often correlated by an empirical exponential law as:
− = R b a Sn 2 ' exp ' (10)
where a’ et b’ are empirical coefficients linked to the initial swirling intensity and the motion
decay respectively.
RESULTS AND DISCUSSION Theoretical productivity
Validation of the radiative transfer modeling. For qO = 210 µmol.m-2.s-1 and X = 1.7.1010
measured irradiances. The integration of refraction effects in the modeling is positive: a better
agreement between experimental and predicted irradiances occurs when optical distortion is
considered. Although the model tends to underestimate the attenuation at the back optical
side, these results are widely acceptable, especially with regard to the geometrical complexity
(curved surface) and the simplifying assumptions emitted (collimated incident light,
approximate optical properties). Figure 4 gives an example of predicted irradiance fields over
the column section whether refraction effects are considered or not. Important differences are
highlighted: light ray refraction slows down light dilution inside the culture and reduces the
proportion of slightly illuminated zones. This is directly linked to the irradiance
over-concentrations generated near walls on light source side. Such results are in agreement with
the attenuation profiles observed in Figure 3.
Isochrysis affinis galbana growth curve. The experimental specific growth rates µ of Isochrysis affinis galbana are reported in Figure 5 as a function of the irradiance received G.
As no photoinhibition is experimentally observed below 360 µmol.m-2.s-1, a simple model
based on a Monod law is chosen to describe the growth curve:
m G µ G K G µ µ − + = max (11)
Calculated by a multi-parametric regression based on experimental data, these parameters are:
µmax = 3.12 d-1, µm = 0.93 d-1, KG = 25.6 µmol.m-2.s-1. The compensation irradiance GC
(determined from Eq. (15) when µ = 0) is then equal to 10.9 µmol.m-2.s-1. The latter value is
rather in agreement with literature: Falkowski et al (1985) found GC equal to 16 µmol.m-2.s-1,
Molina Grima et al (1997) to 10 µmol.m-2.s-1 and Tzovenis et al (2003) to 8 µmol.m-2.s-1.
Molina Grima et al (1997) determined a maintenance term µm close to the present one, 0.92 d
-1
versus 0.93 d-1 respectively. Nevertheless, an important variability is observed for the
500 µmol.m-2.s-1; according to Molina Grima et al (1997), the growth optimum varies from
820 to 1620 µmol.m-2.s-1, the photoinhibition occuring over. These results remain difficult to
interpret and to compare because: (i) light measurement methods are different and/or not
precised, (ii) the time during which microalgae are submitted to a given incident flux is not
well defined, (iii) the light flux considered is often the one emitted by light source or
measured at the reactor surface and not the irradiance really received by microalgae (function
of biomass concentration).
Predicted productivity. The microalgal productivity is predicted according to Eq. (4) where
<µ> is the average of the local growth kinetics, µ(G(z)), solved by coupling the two-flux
radiative transfer model, Eqs. (5-10), and the Isochrysis affinis galbana growth curve, Eq.
(15). Figure 6a reports, for qO = 250 µmol.m-2.s-1, the predicted productivity, PX, as a function
of dilution rate, D, and of the column radius, R. Whatever the column radius, the variation
looks similar and is characterized by an optimum obtained for a dilution rate D close to 0.035
h-1 (0.84 d-1). These optimal volumetric productivities result from an equilibrium maximizing
both cell concentration and culture harvest flow rate. They are very sensitive to the column
radius, a drastic decrease being observed for increasing radii. Figure 6b presents, at the
dilution rate chosen for experiments (D = 0.36 d-1), the variations of the volumetric
productivity with the column radius, for three incident light flux. It clearly appears that,
especially for low radii, the incident light flux has a major influence: for R = 0.03 m, PX is
close to 3.0.1010 cell.L-1.d-1 for 250 µmol.m-2.s-1, to 2.5.1010 cell.L-1.d-1 for 200 µmol.m-2.s-1
and to 1.5.1010 cell.L-1.d-1 for 100 µmol.m-2.s-1.
For designing the multimodule photobioreactor, these predictions are very useful: knowing
the daily larval needs in microalgae, the photobioreactor volume theoretically required can be
easily calculated for each column radius and incident light flux. A survey has been conducted
oyster Crassostrea gigas). The data collected have shown that the production of Isochrysis
affinis galbana required is close to 1.2.1012 cell.d-1 (this is an average value which can
significantly vary depending on hatchery sizes). Using these data, the photobioreactor volume
theoretically required is ranging from 50 to 130 L (for 2 < R < 5 cm and 100 < qO < 200
µmol.m-2.s-1). It increases for increasing radii and for decreasing incident flux. Using low
column radii offers, on the one hand, the undeniable advantage to reduce the photobioreactor
volume (higher productivities), but on the other hand, presents the drawback to multiply the
number of columns and connection flanges, which is economically disadvantageous. These
results indicate that the optimal column diameter should be mainly chosen from a compromise
between productivity and building cost prices, even though other factors, such as floor-space
or cleaning simplicity, should also be taken into account. Finally, the complete integration of
various parameters converges towards a column radius equal to 0.03 m (study not detailed).
Hydrodynamics of the liquid phase
The aim being to design a multimodule photobioreactor for hatcheries, no advanced modeling
on hydrodynamics will be proposed here: the investigations will therefore be restricted to the
characterization of the global flow behavior and of the swirling motion decay. Note that
comparisons with literature on airlift reactors will remain, in general, difficult because the
characteristics of the present airlift are original: very low superficial gas velocity (below 1
cm.s-1), external-loop with columns of equal sizes, swirling motion.
Global flow behavior. In Figure 7a, the mean circulation velocities UC are plotted as a
function of superficial gas velocity UG, for several Velocity Factors and air spargers. They are
significantly larger when the motion inside the reactor is axial rather than swirling, or in other
words, when the Velocity Factor decreases. This is directly linked to the increase of pressure
drops due to section restrictions inside the connection flanges. When compared to Velocity
membrane sparger (M) tends to generate slightly higher velocities than the capillary located
tangentially to the column (T), probably resulting from larger gas retentions. As in Chisti
studies (1989), the previous variations of UC with UG can be described by an empirical
relation based on a power law (see Table 2).
The mean circulation times, tC, are reported in Table 2. They clearly highlight how the
swirling flow enables the time necessary for fluid to cover one reactor loop to be significantly
increased, when compared to a purely axial motion. In Table 2 are also reported the ratios,
averaged over the range of gas velocity, of mixing time to mean circulation time. They
decrease for increasing Velocity Factors: generating a swirling flow, instead of an axial one,
then enables the number of loops necessary to reach a perfectly mixed state to be reduced.
The mixing ability of the reactor is thus enhanced thanks to swirling motion.
Figure 7b presents the Péclet number (defined on the mean reactor length) as a function of the
superficial gas velocity. Whatever the conditions, no noticeable variation of Péclet number
with gas velocities is observed. In contrast, the Velocity Factor induces a significant decrease
of PeL (or a rise of the axial dispersion coefficient Dax, see Table 2)with increasing VF. This
shows that the motion behavior goes from a plug type flow (PeL > 100 for VF1) to a mixed
type flow, thus confirming thus that swirling motion enables the mixing to be improved.
Swirling flow characterization. First of all, for each operating condition, it has been verified
that, when the radial profiles of axial velocity components are integrated along the column
diameter, the mean circulation velocity deduced is conserved whatever the axial positions,
and is equal to the one calculated by tracer measurements (Eq. 12). These calculations make
the velocity field measurements valid, even if they have been only performed for a single
angular position
θC
.Figures 8a and 8b plot typical radial profiles of velocity components at different axial
controlled by the tangential component, which decreases with increasing axial positions but
always remains greater than the axial component. The latter observation is particularly
important to prove that the designed tangential inlets are efficient to generate a swirling flow
along the full column height. As already observed in annular photobioreactors using swirling
flows (Pruvost et al 2000), the extremes of both axial and tangential velocities are located
near the walls and tend to shift towards the center of the column for increasing axial positions.
This is explained by the centrifugal force effects induced by the tangential inlet that diminish
as far as the distance from the connection flange increases. In contrast to annular
configurations, negative axial velocities are present in the central area of the column, giving
evidence of flow recirculations. They are highly pronounced at the top of the column and
disappear more downstream; their existence enables the increase of tangential component
generated by the centrifigal force to be counterbalanced (Aoubed et al 1994). Note that, when
air flow rate increases, all these behaviors are conserved or become acute (data not reported).
Lastly, the comparison between Figures 8a and 8b logically shows that smaller axial
components and greater tangential components are obtained for VF9 than for VF4
The curves of the swirl number Sn as a function of the axial position x are given in Figure 9.
As aforementioned (Figure 8), the attenuation of the swirling motion is here clearly
demonstrated whatever the operating conditions. It is essential to note that this decay is
significant at the bottom of the column but not complete. Except near the tangential inlet, no
major difference is found between both Velocity Factors and air flow rates. As a consequence,
the decay of the swirling motion is modeled by a unique exponential law with a’ = 0.920 and
b’ = 0.086 (Eq. 14).
The conclusion to be drawn from these results is that, independently of air sparger and air
flow rate, both Velocity Factors, VF4 and VF9, ensure the conservation of swirling motion
to impose, for the multimodule photobioreactor, a column height which does not exceed 1 m.
Gas-liquid mass transfer
The variations of the volumetric gas-liquid mass transfer coefficient with the superficial gas
velocity are plotted in Figure 10 with tap water as liquid phase. Whatever the operating
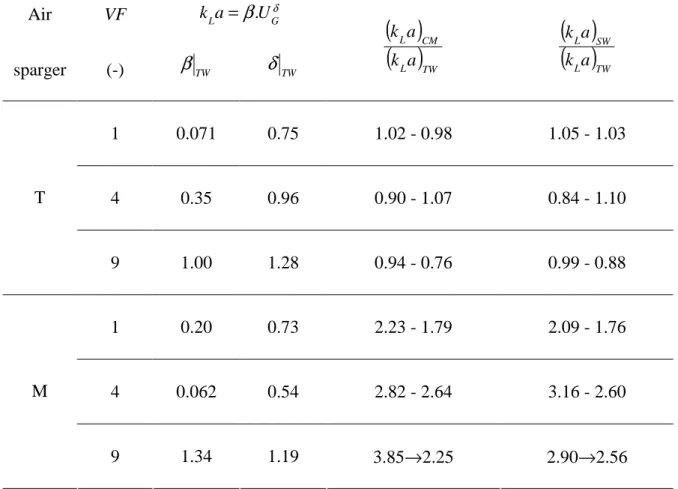
conditions, kLa can be correlated with UG according to a power law (Wu and al 1992):
δ
β
GLa U
k = . (12)
The values of the empirical coefficients,
β
andδ
, are reported in Table 3. Beyond this, it is interesting to note that, whatever the Velocity Factors, the membrane sparger (M) inducesvolumetric mass transfer coefficients two to three times higher than the capillary sparger (T).
This is directly related to the fact that the membrane sparger generates smaller bubble sizes
and higher gas retentions than the capillary one, thus producing higher interfacial areas. The
mass transfer performances of such a sparger are widely recognized (Hébrard et al 1996,
Loubière et al 2003) and are here reinforced by the fact that all the bubbles formed at the exit
of the membrane orifices are collected under the influence of the swirling motion inside an air
column which, about twenty centimeters above, bursts into a swarm of very small spherical
bubbles (below 1 mm). This phenomenon does not exist with the capillary as, contrary to the
membrane punctured over its entire surface sheet, this sparger is located tangentially to the
wall at the column base and generates only one train of large bubbles (spherical cap shape,
above 10 mm) rising along the column wall according to trajectories which follow the main
streamlines induced by the swirling motion.
Figure 10 also shows the influence of the Velocity Factor on the volumetric mass transfer
coefficients. For the membrane, the swirling motion has a negative impact: when compared to
VF1, kLa is reduced by a factor varying between 1.1 and 1.3 for VF4, and between 1.6 to 1.2
for VF9. In contrast, for the capillary sparger, the greatest coefficients are obtained for VF4,
without quantitative measurements for bubble sizes and gas retentions. Nevertheless, the
hypothesis that can be put forward concerns the mechanisms of bubble formation at the
sparger which are: (i) fundamentally different depending on the air sparger type (one train of
large bubbles against an air column bursting into small bubbles), and (ii) susceptible to be
disturbed according to the nature and the intensity of the liquid motion produced at the exit of
the connection flange.
For superficial gas velocities varying from 0.004 to 0.010 m.s-1, Table 3 reports the ratio of
the volumetric mass transfer coefficients measured, either in the Conway medium (CM) or in
seawater (SW), to the ones in tap water (TW). For the capillary sparger (T), these ratios are
almost constant and close to 1 whatever the Velocity Factors: the physico-chemical properties
of sea media do not therefore modify the aeration performances of this sparger, probably due
to the large sizes of the bubbles produced. This is not the case with the membrane sparger
where kLa are two to four times higher in presence of seawater and Conway medium, this
phenomenon being more pronounced when VF increases. These tendencies should also here
come from the bubble formation mechanisms.
Lastly, whatever the operating conditions, the volumetric gas-liquid mass transfer coefficients
vary between 0.001 s-1 and 0.013 s-1 in Conway medium. For design purposes, it is now
interesting to qualitatively compare these aeration performances with the oxygen produced
photosynthetically by the microalga Isochrysis affinis galbana. The single-module
photobioreactor was not equipped to follow either the dissolved oxygen concentration or the
gas composition during the microalgal cultures. Consequently, a Chlorolab2® system
(Hansatech Instruments ®) has been used to estimate, under controlled conditions of
temperature and irradiance, both respiration and photosynthesis (liquid phase measurements).
It reveals that the oxygen production by Isochrysis affinis galbana is almost 6.10-10
single-module photobioreactor have lead to a cellular concentration of 4.26.1010 cell.L-1 at
equilibrium for this incident light flux (Figure11). Using this value, an oxygen production of
25.5 µmol.L-1.min-1 is deduced. If, by a very simple approach, this production is directly
extrapolated to the total liquid volume of the single-module photobioreactor (VL = 6.1 L), a
flow rate of oxygen produced equal to 0.083 mg.s-1 is obtained. In parallel, the oxygen
physically transferable from liquid to gas phases (namely by desorption) is expressed by:
) ( . * 2 L L P L O k aV C C N = − (13)
where CL* is here equal to 6.9 mg.L-1 (Conway medium, 25°C, Patm). By substituting 0.083
mg.s-1 into Eq. (17) and by considering the worst and the best aeration performances (kLa =
0.001 and 0.013 s-1 respectively), the exchange potentials, * L P C
C
C = −
∆ ,necessary to remove all the oxygen produced are then ranging from 13 to 1 mg.L-1. In view of these low values, it
is reasonable to conclude that the single-module photobioreactor will be able to evacuate the
oxygen produced. Consequently, for such geometrical configuration of photobioreactor, the
microalgal growth will not be a priori limited by gas-liquid mass transfer, whatever the
operating conditions that could be retained in the end. Nevertheless, to definitively conclude
on this point, more advanced investigations have to be conducted, based, in particular, on
oxygen in-situ measurements (both liquid and gas phases) during cultures.
Continuous microalgal cultures
Isochrysis affinis galbana continuous cultures are compared depending on whether an axial
(VF1) or a swirling flow (VF4) is generated inside the single-module photobioreactor, the
other experimental conditions being similar (see Material and Methods above). Typical
growth curves are plotted in Figure 11 for both Velocity Factors. The nature of the flow
induced inside the photobioreactor has no effect on the cellular concentration at equilibrium:
in both cases, after almost 15 days, the cultures reach an equilibrium corresponding to
experimental volumetric productivities are calculated at the equilibrium: no significant
difference is detected between both FV1 and FV4, leading to an average productivity of
1.64.1010± 3.108 cell.L-1.d-1. This result is consistent as the productivity inside phobioreactors is only controlled by the reactor geometry (defining the illuminated specific surface) and by
the light input, and independently of hydrodynamics (Pruvost et al 2008). One exception
appears when the microalgae are sensitive to light/dark cycle effects: a dynamic coupling
occurs then between biological response and fluctuating light regimes encountered by flowing
cells, thus implying an alteration of the photosynthetic conversion and a modification of the
photobioreactor efficiency (Janssen et al 2000, Richmond 2004). Here, this phenomenon does
not a priori exist due to the small incident flux applied.
For identical conditions (q0 = 250 µmol.m-2.s-1, D =0 .36 d-1), the theoretical productivity was
close to 3.0.1010 cell.L-1.d-1 (Figure 6b), and thus is rather in agreement with the experimental
one. The difference can be explained by: (i) experimental uncertainties (cell counting,
fluctuating dilution rate), (ii) the assumptions associated with light transfer modelling
(collimated incident flux, optical properties and cellular mass of Isochrysis affinis galbana).
It is now interesting to compare these results with larval needs in hatcheries which, as
aforementioned, are averaged to 1.2.1012 cell.d-1. By considering PX = 1.64.1010 cell.L-1.d-1,
the daily microalgal production is, in this single-module photobioreactor, 1011 cell.d-1 and, by
extrapolating to a 120-L multimodule one, 2.1012 cell.d-1. Such latter volume would enable the
averaged larval requirements to be covered.Note that the multimodule photobioreactor should
be designed so as to adjust its microalgal production to the hatchery size, by modifying either
the number of modules (i.e. the culture volume) or, the light flux (see Figure 6b). For the
highest productions, another alternative is to use several identical multimodule
photobioreactors in parallel.
after 40 days of continuous cultures, submitted to an axial (VF1) or a swirling flow (VF4). It
clearly demonstrates that the microalgal deposition is significantly lower when a swirling
motion is generated. Even if no fine analysis has been performed here to understand how local
hydrodynamics affects biofouling, it is reasonable to suppose that this result is closely related
to hydrodynamic characteristics inherent to swirling flows, namely: a high turbulence
intensity, great tangential components of velocity close to walls (Figure 8) and high levels of
wall friction (Gupta et al 1984, Legentilhomme and Legrand 1991, Pruvost et al 2000). This
ability of swirling flows to limit the biofilm formation is particularly interesting for long-term
continuous cultures because it suggests that the reactor walls could be maintained almost
transparent. This will be helpful to prevent the irradiance received by microalgae from
decreasing as long as the biofilm is depositing at walls. This phenomenon should not be
neglected as it can induce a long-term reduction in productivity.
To conclude, the continuous cultures run in the single-module photobioreactor have shown
that (i) the volumetric productivity is equal to 1.64.1010 ± 3.108 cell.L-1.d-1 and remains constant whatever the hydrodynamic conditions (q0 = 250 µmol.m-2.s-1, D =0 .36 d-1), (ii) the
microalgal production required in hatcheries can be satisfied, (iii) the microalgal deposition at
walls is reduced when a swirling flow is generated instead of an axial one. In the specific
context of hatcheries, these three points offer undeniable advantages as the continuous
microalgal cultures have to be run during several months with a productivity that should
remain constant for optimizing larvae feeding.
CONCLUSIONS
The present work has reported investigations carried out to optimize both design elements and
dimensions of a new photobioreactor for continuous production in mollusk hatcheries. The
succession of elementary modules, each one being composed of two transparent vertical
interconnected columns. The liquid circulation is ensured pneumatically with respect to a
swirling motion (tangential inlets). A single module of the whole photobioreactor was built
up. Firstly, the two-flux radiative transfer model was adapted to account for refraction effects
(front surface curvature) and for the optical properties of Isochrysis affinis galbana. The
growth curve of this microalga was determined by using a planar torus photobioreactor and
modeled with respect to a Monod law. By coupling the previous light and growth models, the
volumetric productivities were predicted as a function of incident light flux, dilution rate and
column radius. These results have revealed that a column radius of 0.03 m represents a good
compromise between productivity and building cost price; therefore, this radius will be
retained for scaling the multimodule photobioreactor. In a second step, the hydrodynamics of
the liquid phase was modeled in terms of global flow behavior (mean circulation velocity,
Péclet number) and of swirling motion decay. The generation of a swirling flow motion was
logically proven positive for enhancing mixing. Whatever the operating conditions, the
swirling motion, characterized by high tangential components of velocity, was conserved but
significantly attenuated along the column. Thus, it is reasonable not to exceed a column
height of 1 m for the multimodule system. In a third time, the aeration performances were
determined by overall volumetric mass transfer coefficient measurements and demonstrated
that the single-module photobioreactor had the physical capacity to remove the oxygen
produced photosynthetically. Finally, Isochrysis affinis galbana continuous cultures were run
for geometrical configurations generating either an axial or a swirling motion (the other
conditions remaining similar: q0 = 250 µmol.m-2.s-1, D =0 .36 d-1). In both cases, the same
productivity was reached: 1.64.1010 ± 3.108 cell.L-1.d-1. When accounting for experimental sensitivity and light modelling assumptions, this value was found to agree with the predicted
appeared in terms of biofouling. Indeed, the film deposited at walls was significantly thinner
when a swirling motion was generated. To maintain high biological performances for
long-term continuous cultures, such result is of great importance.
Coupled with technico-economical considerations, these investigations led us to design and
build up a 120-L prototype made of 18 elementary modules (0.06 m in diameter, 1 m in
length) connected by flanges equipped with VF4 prisms. As illustrated in Figure 13, the
fluorescent lamps are inserted between columns and uniformly spaced. The column assembly
was optimized to restrict floor-space (1 m × 1.1 m × 1.65 m). Air injections were regularly dispatched in the prototype and performed by using capillaries placed tangentially to walls at
the column base. The prototype can pivot according to a horizontal axis, thereby making
cleaning and sterilization steps easier and less manpower intensive. Isochrysis affinis galbana
continuous cultures were successfully run in this prototype (results not exposed here) and led
to a microalgal production of stable quality and quantity under controlled conditions.
The comparison in terms of volumetric productivity with other commercialized systems is
difficult to set up as the complete set of parameters (i.e. microalga type, incident light flux,
dilution rate) is not most often available. The first one is the CAPS systems from the Sea
Salter Shellfish® Company. They are bags or sleeve polyethylene reactors, suspended from a
framework or supported within a mesh frame, indoors or outdoors, in which the culture is
mixed by bubbling air. Under artificial illumination (the irradiance and the microalga type
being non precised unknown), the 500-L CAPS systems would yield 80-120 L of microalgae
per day with a cell density of 4.109 cell.L-1 (http://www.seacaps.com/specs.htm); the
associated volumetric productivities would thus be ranging from 6.4.108 to 9.6.108 cell.L-1.d-1.
The second competing system is the Biofence® photobioreactor (Cell Pharm® company)
which is based on tubular units consisting of a vertical array of horizontal tubes connected to
day would be harvested per block (each block being composed of 16 tubes, namely 100 L in
volume) and a concentration of 20.109 cells of Isochrysis galbana per Liter would be reached
for indoor cultures (unknown irradiance, http://www.variconaqua.com/new_page_2.htm); the
associated volumetric productivities would thus be equal to 6.6.109 cell.L-1.d-1. Both CAPS
and Biofence® systems lead therefore to volumetric productivities smaller than in the
multimodule photobioreactor (1.64.1010 cell.L-1.d-1). In addition, the designed system offers
other undeniable advantages for optimizing the mollusk larvae feeding: (i) it is expandable in
elementary modules (i.e. adjustable to the microalgal production required), (ii) it is based on a
pneumatic agitation (lower power input and more respectful for cell integrity), (iii) the fouling
at walls is minimized, (iv) it is less manpower intensive (ability to ensure long-term
continuous cultures, easy to clean and sterilize) and restricted in floor-space. Currently, this
prototype has been implemented in a French mollusk hatchery (Vendée Naissain®) and will
be commercialized by the company Jouin Solutions Plastiques®.
ACKNOWLEDGMENTS
The development of this work was made possible by the technical and financial support
(CIFRE fellowship) of the plastic company Jouin Solutions Plastiques® (www.jouin.com);
the authors are especially grateful for helpful discussions and suggestions provided by
Jean-Claude Jouin. The authors would like to acknowledge also the French Region
Pays-de-la-Loire for partly supporting this work through SMIDAP research program. Thanks to Loic Le
Déan (Ifremer Nantes) for his technical help.
NOMENCALTURE
b backward scattering coefficient [dimensionless]
CL dissolved oxygen concentration inside the liquid phase [mol.m-3]
* L
C dissolved oxygen concentration at saturation inside the liquid phase [mol.m-3]
CP dissolved oxygen concentration inside the probe [mol.m-3]
C∝ final tracer concentration inside the reactor [mol.m-3]
D dilution rate [s-1]
Dax axial dispersion coefficient [m².s-1]
Ea mass absorption coefficient [m².kg-1]
Es mass scattering coefficient [m².kg-1]
G spherical irradiance [µmol.m-2.s-1]
GC compensation irradiance [µmol.m-2.s-1]
+
I specific radiant intensity relative to the incident light flux direction [µmol.m-2.s-1]
−
I specific radiant intensity relative to the opposite direction of incident light flux
(backward scattering part) [µmol.m-2.s-1]
KG limitation constant [µmol.m-2.s-1]
kLa overall volumetric mass transfer coefficient [s-1]
L light path length [m]
Lt mean reactor length (Lt =2.32 m) [m]
PeL Péclet number based on the mean reactor length (
ax t C L D L U Pe = . ) [dimensionless]
PX volumetric microalgal productivity [cell.m-3.s-1]
qO averaged incident radiant light flux on the reactor surface [µmol.m-2.s-1]
r radial coordinate inside the column [m]
R radius of the single-module photobioreactor column [m]
Sn swirl number [dimensionless]
tC mean circulation time [s]
tm mixing time defined using a homogeneity degree equal to 95% [s]
tp time constant of the oxygen probe [s]
U axial component of time-averaged velocity [m.s-1]
UC mean circulation velocity [m.s-1]
UG superficial gas velocity defined with respect to the column section [m2.s-1]
VL total liquid volume inside the single-module photobioreactor [m3]
VF Velocity Factor [dimensionless]
W tangential component of time-averaged velocity [m.s-1]
x axial coordinate inside the downcomer column, the origin being at the top [m]
X cellular concentration [cell.m-3]
z position along the culture depth [m]
z* geometrical distance between tracer injection and detection points [dimensionless]
Greek letters
α linear scattering modulus [dimensionless]
δ two-flux extinction coefficient [m-1]
G
ε mean gas hold-up inside the pilot [dimensionless]
µ specific growth rate [s-1]
µm maintenance term linked to respiration [s-1]
µmax maximal specific growth rate [s-1]
θ ratio between time and mean circulation time [dimensionless]
θC angular position inside the column [radian]
electrochemical and dot-paint methods for the study of swirling flow. J. Appl.
Electrochem. 24:619-625.
Benkhelifa H, Legrand J, Legentilhomme P, Montillet A 2000. Study of the hydrodynamic
behavior of the batch and continuous torus reactor in laminar and turbulent flow regimes
by means of tracer methods. Chem. Eng. Sci. 55:187-1882
Borowitzka MA 1997. Microalgae for aquaculture: Opportunities and constraints. J. Appl.
Phycol. 9:393–401.
Carvalho AP, Meireles LA, Malcata FX 2006. Microalgal reactors: A review of enclosed
system designs and performances, Biotechnol. Prog. 22:1490-1506
Chisti YM 1989. Airlift Bioreactors. London, England, Elsevier Applied Science.
Cornet J-F, Dussap C-G, Gros J-B 1995. A simplified monodimensional approach for
modeling coupling between radiant light transfer and growth kinetics in photobioreactors.
Chem. Eng. Sci. 50(9):1489-1500
Coulteau P, Sorgeloos P 1992. The use of algal substitutes and the requirement for live algae
in hatchery and nursery rearing of bivalve mollusks: an international survey. Journal of
Shellfish Research 11:467–476.
Falkowski PG, Dubinsky Z, Wyman K 1985. Growth-irradiance relationships in
phytoplankton. Limnology and Oceanography 30(2):311-321.
Green JC, Leadbeater BSC 1994. The Haptophyte algae. Oxford, England, The Systematics
Association special volume ISBN 0-198-57772-9 446.
Gupta A, Lilley DG, Syred N 1984. Swirl flow. Energy and engineering sciences series.
Abacus Press Cambridge.
Hébrard G, Bastoul D, Roustan M 1996. Influence of the gas sparger on the hydrodynamic
behavior of bubble columns. Trans. IChem. E. 74(A):406-414.
with PC simulation. New York, USA, VCH publishers Inc. ISBN 3-527-28577-6. pp. 127.
Janssen M, Janssen M, de Winter M, Tramper J, Mur LR, Wijffels RH 2000. Efficiency of
light utilization of Chlamydomonas reinhardtii under medium-duration light/dark cycles.
J. Biotechnology 78:123-137
Loubière K, Hébrard G, Guiraud P 2003. Dynamics of bubble growth and detachment from
rigid and flexible orifices. Can. J. Chem. Eng. 81(3-4): 499-507
Legentilhomme P, Legrand J 1991. The effects of inlet conditions on mass transfer in annular
swirling decaying flow. Int. J. Heat Mass Transfer 34:1281-1291
Molina Grima E, García Camacho F, Sanchez Perez JA, Acién Fernández FG, Fernandez
Sevilla JM 1997. Growth yield determination in a chemostat culture of the marine
microalga Isochrysis galbana. J. Applied Ecology 8:529-534.
Muller-Feuga A, Le Guedes R, Pruvost J 2003a. Benefits and limitations of modeling for
optimization of Porphyridium cruentum cultures in an annular photobioreactor. J. Biotech.
102(2):153-163
Muller-Feuga A, Pruvost J, Le Guedes R, Le Dean L, Legentilhomme P, Legrand J 2003b.
Swirling flow implementation in a photobioreactor for batch and continuous cultures of
Porphyridium cruentum. Biotech. Bioeng. 84(5):544-551
Pottier L, Pruvost J, Deremetz J, Cornet J-F, Legrand J, Dussap CG 2005. A fully predictive
model for one-dimensional light attenuation by Chlamydomonas reinhardtii in a torus
photobioreactor. Biotech. Bioeng. 91(5):569-582.
Pruvost J, Legrand J, Legentilhomme P 2000. Particle image velocimetry investigation of the
flow-field of a 3D turbulent annular swirling decaying flow induced by means of a
tangential inlet. Exp. in Fluids 29:291-301
Pruvost J, Legrand J, Legentilhomme P, Muller-Feuga A 2002. Simulation of microalgae